
|
|||||
|
 | |
| |
| |
| |
| |
| |
|
Gene: LMO3 |
Gene summary for LMO3 |
| Gene information | Species | Human | Gene symbol | LMO3 | Gene ID | 55885 |
| Gene name | LIM domain only 3 | |
| Gene Alias | RBTN3 | |
| Cytomap | 12p12.3 | |
| Gene Type | protein-coding | GO ID | GO:0000165 | UniProtAcc | A0A024RAT1 |
Top |
Malignant transformation analysis |
| Identification of the aberrant gene expression in precancerous and cancerous lesions by comparing the gene expression of stem-like cells in diseased tissues with normal stem cells |
| Entrez ID | Symbol | Replicates | Species | Organ | Tissue | Adj P-value | Log2FC | Malignancy |
| 55885 | LMO3 | TD9 | Human | Lung | IAC | 8.20e-05 | 4.54e-01 | 0.088 |
| 55885 | LMO3 | RNA-P10T2-P10T2-1 | Human | Lung | AAH | 3.68e-03 | 8.80e-01 | -0.1271 |
| 55885 | LMO3 | RNA-P10T2-P10T2-2 | Human | Lung | AAH | 1.70e-02 | 7.95e-01 | -0.1406 |
| 55885 | LMO3 | RNA-P17T-P17T-4 | Human | Lung | IAC | 4.29e-04 | 2.32e-01 | 0.343 |
| 55885 | LMO3 | RNA-P17T-P17T-6 | Human | Lung | IAC | 1.67e-05 | -8.39e-02 | 0.3385 |
| 55885 | LMO3 | RNA-P17T-P17T-8 | Human | Lung | IAC | 4.17e-04 | -2.61e-01 | 0.3329 |
| 55885 | LMO3 | RNA-P25T1-P25T1-1 | Human | Lung | AIS | 1.19e-17 | 7.66e-01 | -0.2116 |
| 55885 | LMO3 | RNA-P25T1-P25T1-2 | Human | Lung | AIS | 1.23e-07 | 8.63e-01 | -0.1941 |
| 55885 | LMO3 | RNA-P25T1-P25T1-3 | Human | Lung | AIS | 2.15e-12 | 9.61e-01 | -0.2107 |
| 55885 | LMO3 | RNA-P25T1-P25T1-4 | Human | Lung | AIS | 1.37e-13 | 8.57e-01 | -0.2119 |
| 55885 | LMO3 | RNA-P6T1-P6T1-2 | Human | Lung | MIAC | 5.92e-04 | 6.19e-01 | -0.0186 |
| 55885 | LMO3 | RNA-P6T2-P6T2-1 | Human | Lung | IAC | 4.42e-18 | 5.09e-01 | -0.0166 |
| 55885 | LMO3 | RNA-P6T2-P6T2-2 | Human | Lung | IAC | 4.40e-22 | 4.93e-01 | -0.0132 |
| 55885 | LMO3 | RNA-P6T2-P6T2-3 | Human | Lung | IAC | 1.57e-31 | 5.51e-01 | -0.013 |
| 55885 | LMO3 | RNA-P6T2-P6T2-4 | Human | Lung | IAC | 1.70e-22 | 4.86e-01 | -0.0121 |
| 55885 | LMO3 | RNA-P7T1-P7T1-1 | Human | Lung | AIS | 7.61e-07 | 6.86e-01 | -0.0961 |
| 55885 | LMO3 | RNA-P7T1-P7T1-2 | Human | Lung | AIS | 8.47e-14 | 8.24e-01 | -0.0876 |
| 55885 | LMO3 | RNA-P7T1-P7T1-3 | Human | Lung | AIS | 6.82e-06 | 7.84e-01 | -0.0822 |
| 55885 | LMO3 | RNA-P7T1-P7T1-4 | Human | Lung | AIS | 2.90e-09 | 6.98e-01 | -0.0809 |
| 55885 | LMO3 | male-WTA | Human | Thyroid | PTC | 2.50e-69 | 7.86e-01 | 0.1037 |
| Page: 1 2 |
| Tissue | Expression Dynamics | Abbreviation |
| Lung | 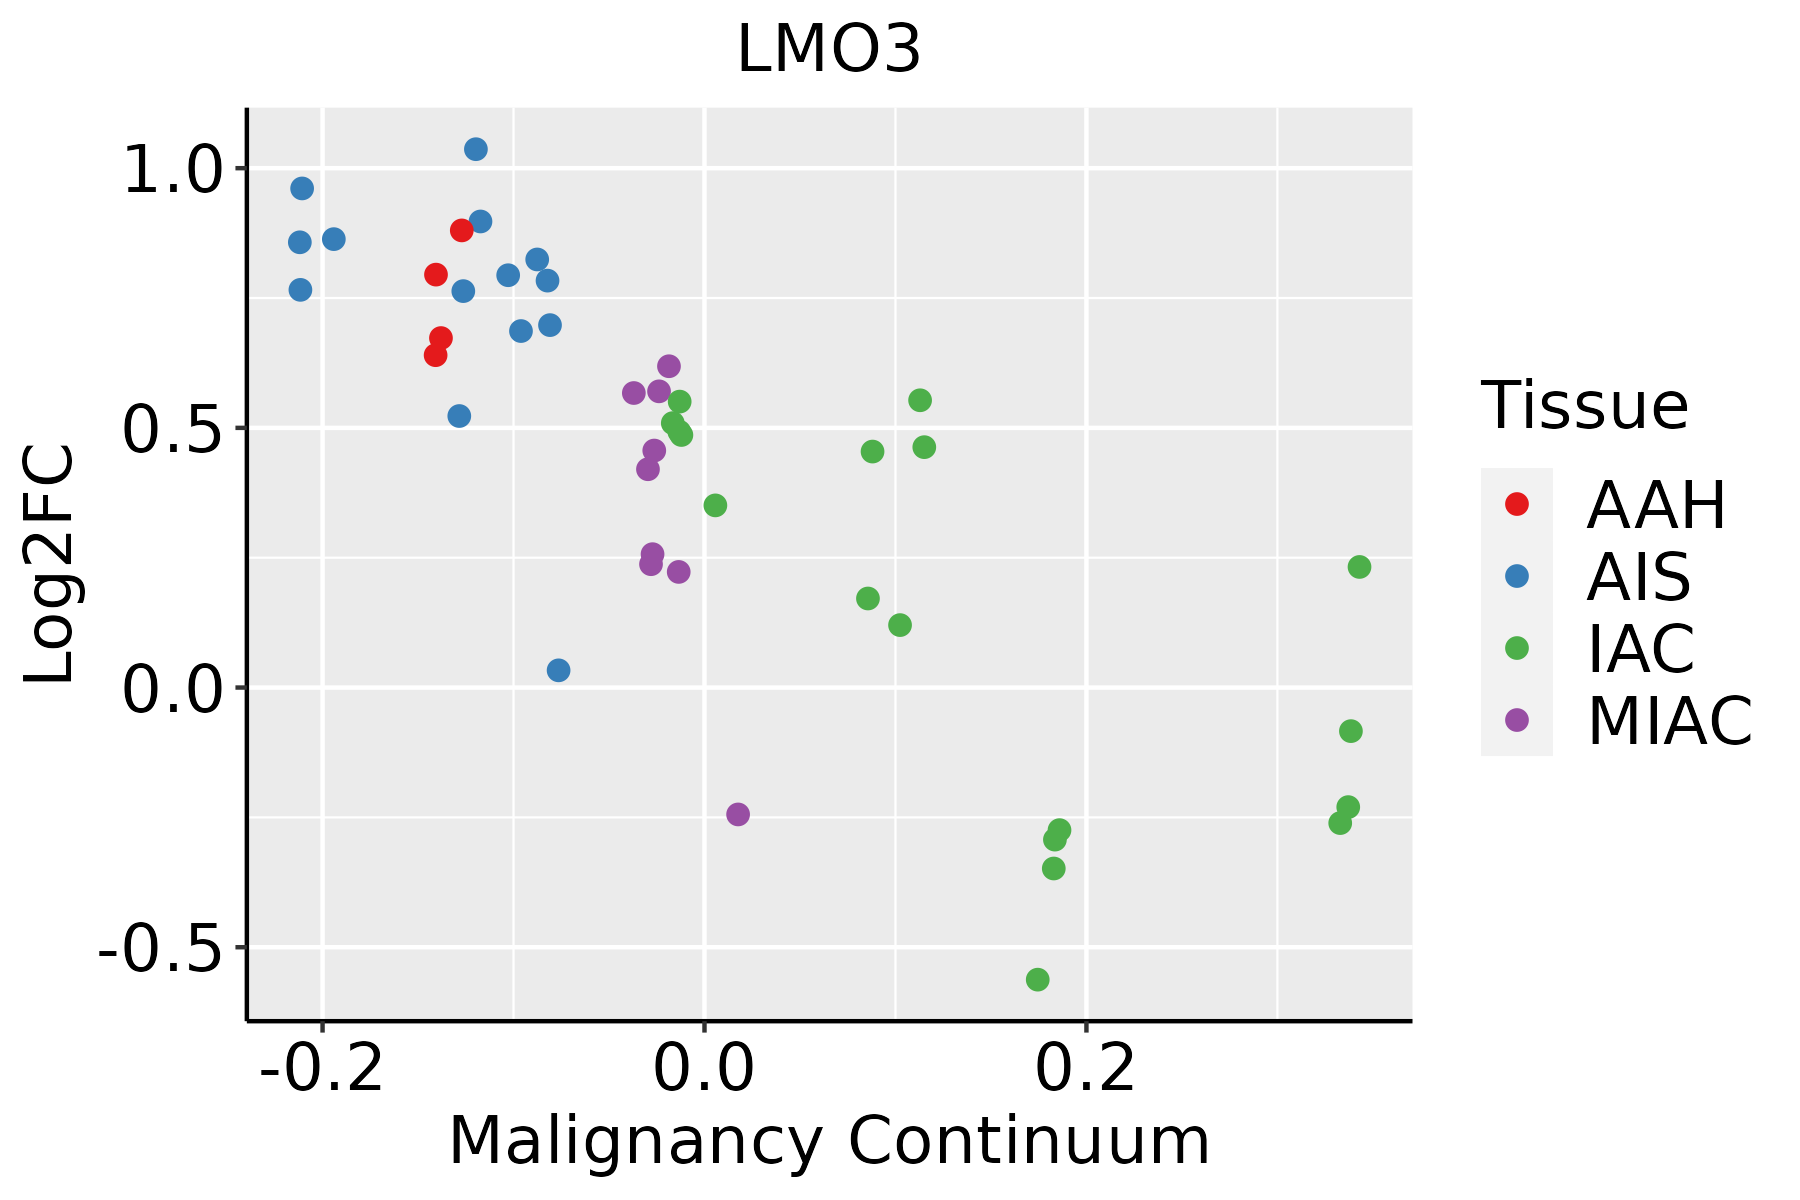 | AAH: Atypical adenomatous hyperplasia |
| AIS: Adenocarcinoma in situ | ||
| IAC: Invasive lung adenocarcinoma | ||
| MIA: Minimally invasive adenocarcinoma | ||
| Thyroid | 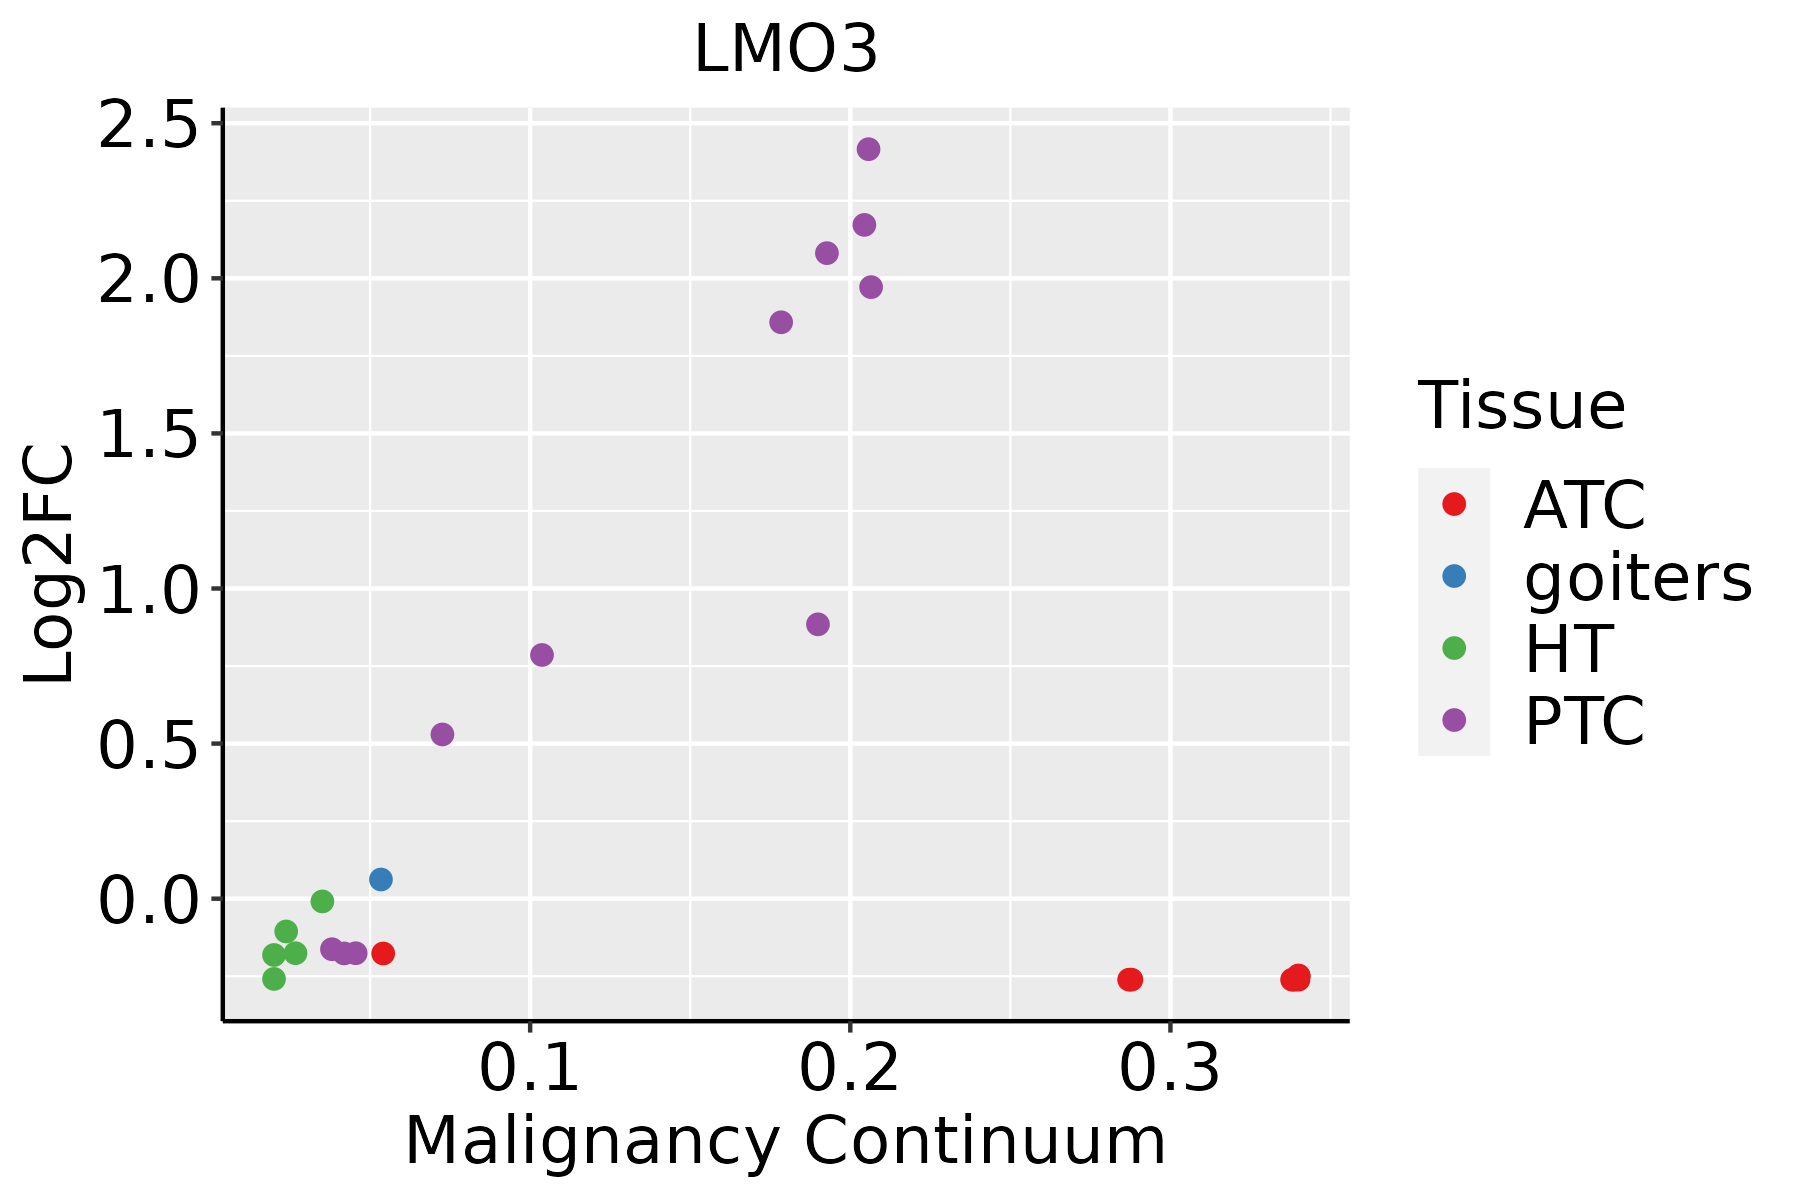 | ATC: Anaplastic thyroid cancer |
| HT: Hashimoto's thyroiditis | ||
| PTC: Papillary thyroid cancer |
| ∗log2FC in expression of this searched gene in stem-like cells from each diseased tissue sample relative to stem-like cells in normal samples in each tissue plotted against the malignancy continuum. Samples are colored based on if they are from different disease stage. |
Top |
Malignant transformation related pathway analysis |
| Find out the enriched GO biological processes and KEGG pathways involved in transition from healthy to precancer to cancer |
| Tissue | Disease Stage | Enriched GO biological Processes |
| Colorectum | AD |  |
| Colorectum | SER |  |
| Colorectum | MSS |  |
| Colorectum | MSI-H |  |
| Colorectum | FAP |  |
| ∗Top 15 enriched GO BP terms are showed in the bar plot of each disease state in each tissue. Each row represents a significant GO biological process which is colored according to the -log10(p.adjust). |
| Page: 1 2 3 4 5 6 7 8 9 |
| GO ID | Tissue | Disease Stage | Description | Gene Ratio | Bg Ratio | pvalue | p.adjust | Count |
| GO:000701527 | Esophagus | ESCC | actin filament organization | 259/8552 | 442/18723 | 2.37e-08 | 4.50e-07 | 259 |
| GO:00305227 | Lung | IAC | intracellular receptor signaling pathway | 59/2061 | 265/18723 | 8.88e-08 | 8.50e-06 | 59 |
| GO:00485458 | Lung | IAC | response to steroid hormone | 69/2061 | 339/18723 | 2.99e-07 | 2.34e-05 | 69 |
| GO:00713837 | Lung | IAC | cellular response to steroid hormone stimulus | 47/2061 | 204/18723 | 6.27e-07 | 3.72e-05 | 47 |
| GO:00305186 | Lung | IAC | intracellular steroid hormone receptor signaling pathway | 30/2061 | 116/18723 | 5.77e-06 | 2.18e-04 | 30 |
| GO:00434098 | Lung | IAC | negative regulation of MAPK cascade | 40/2061 | 180/18723 | 1.05e-05 | 3.30e-04 | 40 |
| GO:00434017 | Lung | IAC | steroid hormone mediated signaling pathway | 31/2061 | 136/18723 | 6.00e-05 | 1.31e-03 | 31 |
| GO:00331434 | Lung | IAC | regulation of intracellular steroid hormone receptor signaling pathway | 19/2061 | 74/18723 | 3.15e-04 | 4.98e-03 | 19 |
| GO:00456002 | Lung | IAC | positive regulation of fat cell differentiation | 17/2061 | 66/18723 | 6.14e-04 | 8.46e-03 | 17 |
| GO:00454443 | Lung | IAC | fat cell differentiation | 42/2061 | 229/18723 | 6.19e-04 | 8.50e-03 | 42 |
| GO:00097557 | Lung | IAC | hormone-mediated signaling pathway | 36/2061 | 190/18723 | 7.95e-04 | 1.02e-02 | 36 |
| GO:0070373 | Lung | IAC | negative regulation of ERK1 and ERK2 cascade | 18/2061 | 78/18723 | 1.72e-03 | 1.78e-02 | 18 |
| GO:003052213 | Lung | AIS | intracellular receptor signaling pathway | 53/1849 | 265/18723 | 4.57e-07 | 3.55e-05 | 53 |
| GO:004340912 | Lung | AIS | negative regulation of MAPK cascade | 39/1849 | 180/18723 | 1.92e-06 | 1.12e-04 | 39 |
| GO:003051812 | Lung | AIS | intracellular steroid hormone receptor signaling pathway | 28/1849 | 116/18723 | 6.14e-06 | 2.82e-04 | 28 |
| GO:007138313 | Lung | AIS | cellular response to steroid hormone stimulus | 41/1849 | 204/18723 | 7.76e-06 | 3.35e-04 | 41 |
| GO:004854513 | Lung | AIS | response to steroid hormone | 59/1849 | 339/18723 | 1.15e-05 | 4.65e-04 | 59 |
| GO:004340112 | Lung | AIS | steroid hormone mediated signaling pathway | 28/1849 | 136/18723 | 1.32e-04 | 2.97e-03 | 28 |
| GO:003314312 | Lung | AIS | regulation of intracellular steroid hormone receptor signaling pathway | 18/1849 | 74/18723 | 2.42e-04 | 4.78e-03 | 18 |
| GO:0070371 | Lung | AIS | ERK1 and ERK2 cascade | 52/1849 | 330/18723 | 4.80e-04 | 7.95e-03 | 52 |
| Page: 1 2 3 |
| Pathway ID | Tissue | Disease Stage | Description | Gene Ratio | Bg Ratio | pvalue | p.adjust | qvalue | Count |
| Page: 1 |
Top |
Cell-cell communication analysis |
| Identification of potential cell-cell interactions between two cell types and their ligand-receptor pairs for different disease states |
| Ligand | Receptor | LRpair | Pathway | Tissue | Disease Stage |
| Page: 1 |
Top |
Single-cell gene regulatory network inference analysis |
| Find out the significant the regulons (TFs) and the target genes of each regulon across cell types for different disease states |
| TF | Cell Type | Tissue | Disease Stage | Target Gene | RSS | Regulon Activity |
| ∗The dot plots of a searched regulon are shown for all cell subpopulations in each disease state of each tissue based on the regulon specific score inferred using pySCENIC and by calculating the average expression. |
| Page: 1 |
Top |
Somatic mutation of malignant transformation related genes |
| Annotation of somatic variants for genes involved in malignant transformation |
| Hugo Symbol | Variant Class | Variant Classification | dbSNP RS | HGVSc | HGVSp | HGVSp Short | SWISSPROT | BIOTYPE | SIFT | PolyPhen | Tumor Sample Barcode | Tissue | Histology | Sex | Age | Stage | Therapy Types | Drugs | Outcome |
| LMO3 | SNV | Missense_Mutation | c.340C>G | p.Arg114Gly | p.R114G | Q8TAP4 | protein_coding | deleterious(0) | probably_damaging(0.993) | TCGA-A1-A0SG-01 | Breast | breast invasive carcinoma | Female | <65 | I/II | Chemotherapy | SD | ||
| LMO3 | SNV | Missense_Mutation | c.25A>G | p.Lys9Glu | p.K9E | Q8TAP4 | protein_coding | tolerated(0.1) | benign(0.028) | TCGA-AO-A128-01 | Breast | breast invasive carcinoma | Female | <65 | I/II | Chemotherapy | doxorubicin | SD | |
| LMO3 | SNV | Missense_Mutation | rs145877643 | c.452N>T | p.Thr151Met | p.T151M | Q8TAP4 | protein_coding | tolerated(0.28) | benign(0.066) | TCGA-A6-A56B-01 | Colorectum | colon adenocarcinoma | Male | <65 | III/IV | Chemotherapy | fluorouracil | PD |
| LMO3 | SNV | Missense_Mutation | novel | c.115N>G | p.Lys39Glu | p.K39E | Q8TAP4 | protein_coding | deleterious(0) | probably_damaging(0.977) | TCGA-AA-A00N-01 | Colorectum | colon adenocarcinoma | Male | >=65 | I/II | Unknown | Unknown | PD |
| LMO3 | SNV | Missense_Mutation | rs867223722 | c.137N>A | p.Arg46His | p.R46H | Q8TAP4 | protein_coding | deleterious(0) | probably_damaging(0.967) | TCGA-AA-A01I-01 | Colorectum | colon adenocarcinoma | Male | >=65 | I/II | Unknown | Unknown | SD |
| LMO3 | SNV | Missense_Mutation | c.298G>A | p.Ala100Thr | p.A100T | Q8TAP4 | protein_coding | tolerated(0.05) | probably_damaging(0.952) | TCGA-A5-A0G2-01 | Endometrium | uterine corpus endometrioid carcinoma | Female | <65 | III/IV | Unknown | Unknown | SD | |
| LMO3 | SNV | Missense_Mutation | c.136N>T | p.Arg46Cys | p.R46C | Q8TAP4 | protein_coding | deleterious(0.01) | benign(0.219) | TCGA-BS-A0TJ-01 | Endometrium | uterine corpus endometrioid carcinoma | Female | <65 | I/II | Unknown | Unknown | SD | |
| LMO3 | SNV | Missense_Mutation | novel | c.416N>C | p.Lys139Thr | p.K139T | Q8TAP4 | protein_coding | deleterious(0) | probably_damaging(0.924) | TCGA-BS-A0UF-01 | Endometrium | uterine corpus endometrioid carcinoma | Female | >=65 | I/II | Unknown | Unknown | SD |
| LMO3 | SNV | Missense_Mutation | c.277N>G | p.Phe93Val | p.F93V | Q8TAP4 | protein_coding | deleterious(0.03) | probably_damaging(0.979) | TCGA-BS-A0UF-01 | Endometrium | uterine corpus endometrioid carcinoma | Female | >=65 | I/II | Unknown | Unknown | SD | |
| LMO3 | SNV | Missense_Mutation | rs145877643 | c.452C>T | p.Thr151Met | p.T151M | Q8TAP4 | protein_coding | tolerated(0.28) | benign(0.066) | TCGA-EO-A22R-01 | Endometrium | uterine corpus endometrioid carcinoma | Female | <65 | I/II | Unknown | Unknown | SD |
| Page: 1 2 |
Top |
Related drugs of malignant transformation related genes |
| Identification of chemicals and drugs interact with genes involved in malignant transfromation |
| (DGIdb 4.0) |
| Entrez ID | Symbol | Category | Interaction Types | Drug Claim Name | Drug Name | PMIDs |
| Page: 1 |

Copyright 2023-Present -The University of Texas Health Science Center at Houston |