
|
|||||
|
 | |
| |
| |
| |
| |
| |
|
Gene: LMO1 |
Gene summary for LMO1 |
| Gene information | Species | Human | Gene symbol | LMO1 | Gene ID | 4004 |
| Gene name | LIM domain only 1 | |
| Gene Alias | RBTN1 | |
| Cytomap | 11p15.4 | |
| Gene Type | protein-coding | GO ID | GO:0000122 | UniProtAcc | P25800 |
Top |
Malignant transformation analysis |
| Identification of the aberrant gene expression in precancerous and cancerous lesions by comparing the gene expression of stem-like cells in diseased tissues with normal stem cells |
| Entrez ID | Symbol | Replicates | Species | Organ | Tissue | Adj P-value | Log2FC | Malignancy |
| 4004 | LMO1 | P4_S8_cSCC | Human | Skin | cSCC | 7.54e-09 | 2.57e-01 | -0.3095 |
| 4004 | LMO1 | P1_cSCC | Human | Skin | cSCC | 3.68e-09 | 3.49e-01 | 0.0292 |
| 4004 | LMO1 | P2_cSCC | Human | Skin | cSCC | 1.28e-11 | 3.65e-01 | -0.024 |
| 4004 | LMO1 | P4_cSCC | Human | Skin | cSCC | 4.34e-22 | 4.52e-01 | -0.00290000000000005 |
| 4004 | LMO1 | P10_cSCC | Human | Skin | cSCC | 1.14e-03 | 2.26e-01 | 0.1017 |
| 4004 | LMO1 | cSCC_p1 | Human | Skin | cSCC | 2.77e-05 | 2.25e-01 | -0.1916 |
| 4004 | LMO1 | cSCC_p11 | Human | Skin | cSCC | 1.47e-03 | 1.81e-01 | -0.2102 |
| 4004 | LMO1 | cSCC_p8 | Human | Skin | cSCC | 6.22e-09 | 2.43e-01 | -0.1971 |
| 4004 | LMO1 | cSCC_p9 | Human | Skin | cSCC | 3.85e-13 | 3.06e-01 | -0.1991 |
| Page: 1 |
| Tissue | Expression Dynamics | Abbreviation |
| Skin | 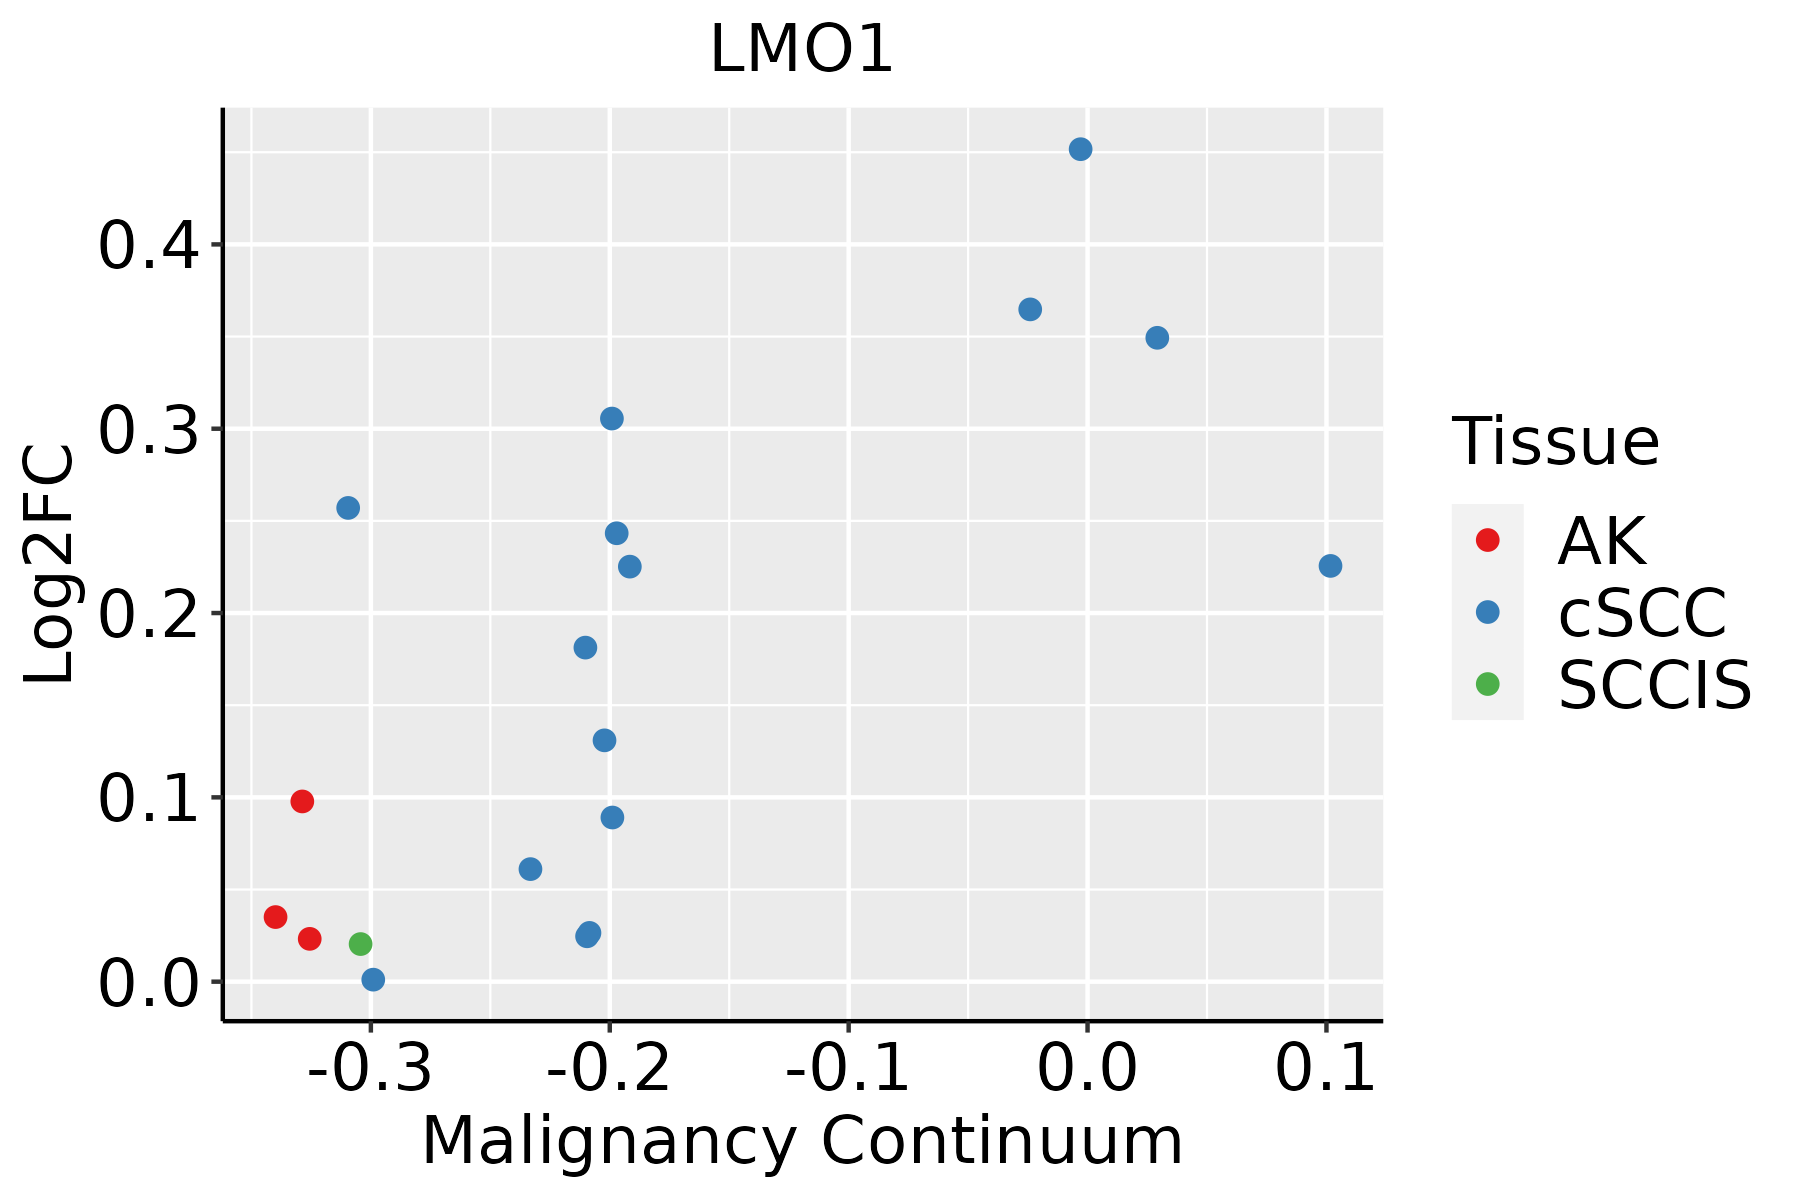 | AK: Actinic keratosis |
| cSCC: Cutaneous squamous cell carcinoma | ||
| SCCIS:squamous cell carcinoma in situ |
| ∗log2FC in expression of this searched gene in stem-like cells from each diseased tissue sample relative to stem-like cells in normal samples in each tissue plotted against the malignancy continuum. Samples are colored based on if they are from different disease stage. |
Top |
Malignant transformation related pathway analysis |
| Find out the enriched GO biological processes and KEGG pathways involved in transition from healthy to precancer to cancer |
| Tissue | Disease Stage | Enriched GO biological Processes |
| Colorectum | AD |  |
| Colorectum | SER |  |
| Colorectum | MSS |  |
| Colorectum | MSI-H |  |
| Colorectum | FAP |  |
| ∗Top 15 enriched GO BP terms are showed in the bar plot of each disease state in each tissue. Each row represents a significant GO biological process which is colored according to the -log10(p.adjust). |
| Page: 1 2 3 4 5 6 7 8 9 |
| GO ID | Tissue | Disease Stage | Description | Gene Ratio | Bg Ratio | pvalue | p.adjust | Count |
| GO:0007015 | Colorectum | AD | actin filament organization | 167/3918 | 442/18723 | 1.65e-16 | 7.94e-14 | 167 |
| GO:0007265 | Colorectum | AD | Ras protein signal transduction | 104/3918 | 337/18723 | 1.01e-05 | 2.35e-04 | 104 |
| GO:0016601 | Colorectum | AD | Rac protein signal transduction | 20/3918 | 42/18723 | 1.02e-04 | 1.53e-03 | 20 |
| GO:00070154 | Colorectum | FAP | actin filament organization | 125/2622 | 442/18723 | 1.97e-15 | 3.03e-12 | 125 |
| GO:00072652 | Colorectum | FAP | Ras protein signal transduction | 80/2622 | 337/18723 | 9.61e-07 | 4.33e-05 | 80 |
| GO:00166012 | Colorectum | FAP | Rac protein signal transduction | 14/2622 | 42/18723 | 1.20e-03 | 1.14e-02 | 14 |
| GO:000701516 | Endometrium | AEH | actin filament organization | 98/2100 | 442/18723 | 1.99e-11 | 2.98e-09 | 98 |
| GO:00072657 | Endometrium | AEH | Ras protein signal transduction | 63/2100 | 337/18723 | 3.09e-05 | 5.66e-04 | 63 |
| GO:00166016 | Endometrium | AEH | Rac protein signal transduction | 11/2100 | 42/18723 | 5.45e-03 | 3.37e-02 | 11 |
| GO:000701517 | Endometrium | EEC | actin filament organization | 95/2168 | 442/18723 | 1.31e-09 | 1.09e-07 | 95 |
| GO:000726513 | Endometrium | EEC | Ras protein signal transduction | 64/2168 | 337/18723 | 4.31e-05 | 7.10e-04 | 64 |
| GO:000701527 | Esophagus | ESCC | actin filament organization | 259/8552 | 442/18723 | 2.37e-08 | 4.50e-07 | 259 |
| GO:000726510 | Esophagus | ESCC | Ras protein signal transduction | 201/8552 | 337/18723 | 1.44e-07 | 2.30e-06 | 201 |
| GO:00166019 | Esophagus | ESCC | Rac protein signal transduction | 33/8552 | 42/18723 | 1.35e-05 | 1.23e-04 | 33 |
| GO:00072654 | Liver | NAFLD | Ras protein signal transduction | 66/1882 | 337/18723 | 8.43e-08 | 7.09e-06 | 66 |
| GO:00070157 | Liver | NAFLD | actin filament organization | 78/1882 | 442/18723 | 5.44e-07 | 3.21e-05 | 78 |
| GO:00166014 | Liver | NAFLD | Rac protein signal transduction | 11/1882 | 42/18723 | 2.32e-03 | 2.19e-02 | 11 |
| GO:000701512 | Liver | Cirrhotic | actin filament organization | 171/4634 | 442/18723 | 3.93e-11 | 2.30e-09 | 171 |
| GO:000726511 | Liver | Cirrhotic | Ras protein signal transduction | 119/4634 | 337/18723 | 8.16e-06 | 1.22e-04 | 119 |
| GO:001660111 | Liver | Cirrhotic | Rac protein signal transduction | 19/4634 | 42/18723 | 3.00e-03 | 1.71e-02 | 19 |
| Page: 1 2 |
| Pathway ID | Tissue | Disease Stage | Description | Gene Ratio | Bg Ratio | pvalue | p.adjust | qvalue | Count |
| Page: 1 |
Top |
Cell-cell communication analysis |
| Identification of potential cell-cell interactions between two cell types and their ligand-receptor pairs for different disease states |
| Ligand | Receptor | LRpair | Pathway | Tissue | Disease Stage |
| Page: 1 |
Top |
Single-cell gene regulatory network inference analysis |
| Find out the significant the regulons (TFs) and the target genes of each regulon across cell types for different disease states |
| TF | Cell Type | Tissue | Disease Stage | Target Gene | RSS | Regulon Activity |
| ∗The dot plots of a searched regulon are shown for all cell subpopulations in each disease state of each tissue based on the regulon specific score inferred using pySCENIC and by calculating the average expression. |
| Page: 1 |
Top |
Somatic mutation of malignant transformation related genes |
| Annotation of somatic variants for genes involved in malignant transformation |
| Hugo Symbol | Variant Class | Variant Classification | dbSNP RS | HGVSc | HGVSp | HGVSp Short | SWISSPROT | BIOTYPE | SIFT | PolyPhen | Tumor Sample Barcode | Tissue | Histology | Sex | Age | Stage | Therapy Types | Drugs | Outcome |
| LMO1 | SNV | Missense_Mutation | rs774615420 | c.28N>A | p.Val10Met | p.V10M | P25800 | protein_coding | tolerated(0.08) | benign(0.081) | TCGA-2W-A8YY-01 | Cervix | cervical & endocervical cancer | Female | <65 | I/II | Chemotherapy | cisplatin | CR |
| LMO1 | SNV | Missense_Mutation | rs776473765 | c.178G>A | p.Glu60Lys | p.E60K | P25800 | protein_coding | deleterious(0) | possibly_damaging(0.769) | TCGA-JX-A3Q0-01 | Cervix | cervical & endocervical cancer | Female | <65 | III/IV | Unknown | Unknown | SD |
| LMO1 | SNV | Missense_Mutation | rs371807297 | c.101G>A | p.Arg34His | p.R34H | P25800 | protein_coding | deleterious(0) | probably_damaging(0.996) | TCGA-G4-6628-01 | Colorectum | colon adenocarcinoma | Male | >=65 | I/II | Unknown | Unknown | SD |
| LMO1 | SNV | Missense_Mutation | novel | c.308N>A | p.Arg103Gln | p.R103Q | P25800 | protein_coding | deleterious(0) | probably_damaging(0.972) | TCGA-A5-A0G2-01 | Endometrium | uterine corpus endometrioid carcinoma | Female | <65 | III/IV | Unknown | Unknown | SD |
| LMO1 | SNV | Missense_Mutation | rs536636517 | c.43N>A | p.Val15Ile | p.V15I | P25800 | protein_coding | tolerated(0.16) | benign(0.005) | TCGA-AP-A051-01 | Endometrium | uterine corpus endometrioid carcinoma | Female | >=65 | I/II | Unknown | Unknown | SD |
| LMO1 | SNV | Missense_Mutation | novel | c.396N>T | p.Lys132Asn | p.K132N | P25800 | protein_coding | tolerated(0.31) | benign(0.038) | TCGA-AP-A1E0-01 | Endometrium | uterine corpus endometrioid carcinoma | Female | <65 | III/IV | Chemotherapy | paclitaxel | SD |
| LMO1 | SNV | Missense_Mutation | rs371807297 | c.101N>A | p.Arg34His | p.R34H | P25800 | protein_coding | deleterious(0) | probably_damaging(0.996) | TCGA-AX-A2HD-01 | Endometrium | uterine corpus endometrioid carcinoma | Female | >=65 | III/IV | Unknown | Unknown | SD |
| LMO1 | SNV | Missense_Mutation | novel | c.455N>G | p.Glu152Gly | p.E152G | P25800 | protein_coding | tolerated(0.35) | benign(0.036) | TCGA-B5-A3FC-01 | Endometrium | uterine corpus endometrioid carcinoma | Female | <65 | I/II | Unknown | Unknown | SD |
| LMO1 | SNV | Missense_Mutation | c.136N>A | p.Glu46Lys | p.E46K | P25800 | protein_coding | deleterious(0.03) | probably_damaging(0.936) | TCGA-BS-A0UF-01 | Endometrium | uterine corpus endometrioid carcinoma | Female | >=65 | I/II | Unknown | Unknown | SD | |
| LMO1 | SNV | Missense_Mutation | novel | c.55N>T | p.Gly19Trp | p.G19W | P25800 | protein_coding | deleterious(0) | possibly_damaging(0.502) | TCGA-53-7626-01 | Lung | lung adenocarcinoma | Female | >=65 | I/II | Unspecific | Cisplatin | PD |
| Page: 1 2 |
Top |
Related drugs of malignant transformation related genes |
| Identification of chemicals and drugs interact with genes involved in malignant transfromation |
| (DGIdb 4.0) |
| Entrez ID | Symbol | Category | Interaction Types | Drug Claim Name | Drug Name | PMIDs |
| Page: 1 |

Copyright 2023-Present -The University of Texas Health Science Center at Houston |