
|
|||||
|
 | |
| |
| |
| |
| |
| |
|
Gene: LMNB2 |
Gene summary for LMNB2 |
| Gene information | Species | Human | Gene symbol | LMNB2 | Gene ID | 84823 |
| Gene name | lamin B2 | |
| Gene Alias | EPM9 | |
| Cytomap | 19p13.3 | |
| Gene Type | protein-coding | GO ID | GO:0008150 | UniProtAcc | Q03252 |
Top |
Malignant transformation analysis |
| Identification of the aberrant gene expression in precancerous and cancerous lesions by comparing the gene expression of stem-like cells in diseased tissues with normal stem cells |
| Entrez ID | Symbol | Replicates | Species | Organ | Tissue | Adj P-value | Log2FC | Malignancy |
| 84823 | LMNB2 | LZE7T | Human | Esophagus | ESCC | 1.12e-04 | 1.68e-01 | 0.0667 |
| 84823 | LMNB2 | LZE8T | Human | Esophagus | ESCC | 2.39e-10 | 3.70e-01 | 0.067 |
| 84823 | LMNB2 | LZE20T | Human | Esophagus | ESCC | 1.18e-04 | 2.18e-01 | 0.0662 |
| 84823 | LMNB2 | LZE24T | Human | Esophagus | ESCC | 1.34e-10 | 3.34e-01 | 0.0596 |
| 84823 | LMNB2 | LZE21T | Human | Esophagus | ESCC | 1.40e-06 | 4.65e-01 | 0.0655 |
| 84823 | LMNB2 | LZE6T | Human | Esophagus | ESCC | 1.10e-06 | 4.27e-01 | 0.0845 |
| 84823 | LMNB2 | P1T-E | Human | Esophagus | ESCC | 4.95e-08 | 5.21e-01 | 0.0875 |
| 84823 | LMNB2 | P2T-E | Human | Esophagus | ESCC | 1.29e-21 | 4.16e-01 | 0.1177 |
| 84823 | LMNB2 | P4T-E | Human | Esophagus | ESCC | 8.69e-18 | 4.86e-01 | 0.1323 |
| 84823 | LMNB2 | P5T-E | Human | Esophagus | ESCC | 2.62e-14 | 3.18e-01 | 0.1327 |
| 84823 | LMNB2 | P8T-E | Human | Esophagus | ESCC | 6.87e-06 | 1.11e-01 | 0.0889 |
| 84823 | LMNB2 | P9T-E | Human | Esophagus | ESCC | 1.95e-12 | 3.44e-01 | 0.1131 |
| 84823 | LMNB2 | P10T-E | Human | Esophagus | ESCC | 5.33e-16 | 5.23e-01 | 0.116 |
| 84823 | LMNB2 | P11T-E | Human | Esophagus | ESCC | 1.16e-05 | 3.12e-01 | 0.1426 |
| 84823 | LMNB2 | P12T-E | Human | Esophagus | ESCC | 2.06e-10 | 2.87e-01 | 0.1122 |
| 84823 | LMNB2 | P15T-E | Human | Esophagus | ESCC | 6.14e-12 | 4.35e-01 | 0.1149 |
| 84823 | LMNB2 | P16T-E | Human | Esophagus | ESCC | 4.61e-12 | 2.83e-01 | 0.1153 |
| 84823 | LMNB2 | P17T-E | Human | Esophagus | ESCC | 5.71e-22 | 8.89e-01 | 0.1278 |
| 84823 | LMNB2 | P19T-E | Human | Esophagus | ESCC | 1.12e-05 | 5.34e-01 | 0.1662 |
| 84823 | LMNB2 | P20T-E | Human | Esophagus | ESCC | 1.16e-08 | 3.05e-01 | 0.1124 |
| Page: 1 2 3 4 5 |
| Tissue | Expression Dynamics | Abbreviation |
| Esophagus |  | ESCC: Esophageal squamous cell carcinoma |
| HGIN: High-grade intraepithelial neoplasias | ||
| LGIN: Low-grade intraepithelial neoplasias | ||
| Oral Cavity |  | EOLP: Erosive Oral lichen planus |
| LP: leukoplakia | ||
| NEOLP: Non-erosive oral lichen planus | ||
| OSCC: Oral squamous cell carcinoma | ||
| Skin | 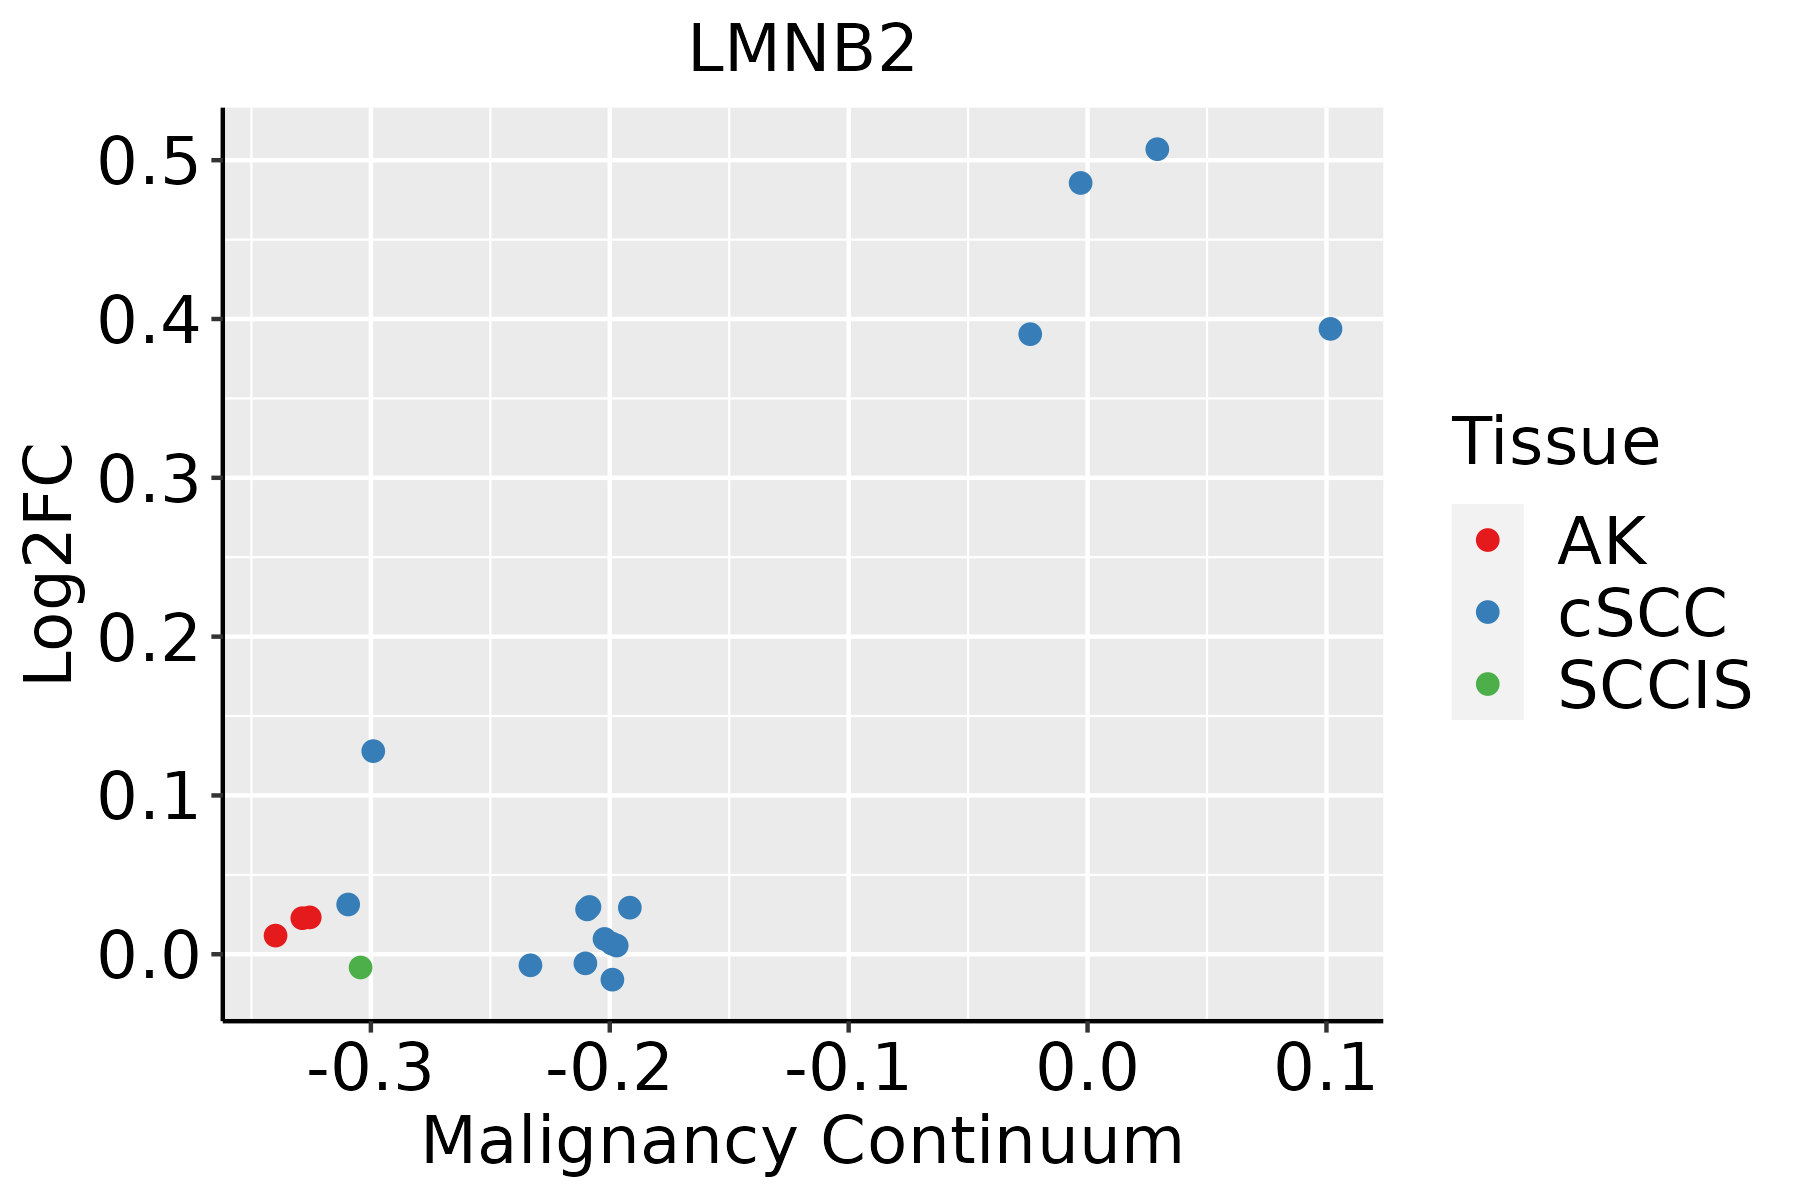 | AK: Actinic keratosis |
| cSCC: Cutaneous squamous cell carcinoma | ||
| SCCIS:squamous cell carcinoma in situ | ||
| Thyroid |  | ATC: Anaplastic thyroid cancer |
| HT: Hashimoto's thyroiditis | ||
| PTC: Papillary thyroid cancer |
| ∗log2FC in expression of this searched gene in stem-like cells from each diseased tissue sample relative to stem-like cells in normal samples in each tissue plotted against the malignancy continuum. Samples are colored based on if they are from different disease stage. |
Top |
Malignant transformation related pathway analysis |
| Find out the enriched GO biological processes and KEGG pathways involved in transition from healthy to precancer to cancer |
| Tissue | Disease Stage | Enriched GO biological Processes |
| Colorectum | AD |  |
| Colorectum | SER |  |
| Colorectum | MSS |  |
| Colorectum | MSI-H |  |
| Colorectum | FAP |  |
| ∗Top 15 enriched GO BP terms are showed in the bar plot of each disease state in each tissue. Each row represents a significant GO biological process which is colored according to the -log10(p.adjust). |
| Page: 1 2 3 4 5 6 7 8 9 |
| GO ID | Tissue | Disease Stage | Description | Gene Ratio | Bg Ratio | pvalue | p.adjust | Count |
| Page: 1 |
| Pathway ID | Tissue | Disease Stage | Description | Gene Ratio | Bg Ratio | pvalue | p.adjust | qvalue | Count |
| hsa0421027 | Esophagus | ESCC | Apoptosis | 102/4205 | 136/8465 | 1.05e-09 | 1.21e-08 | 6.21e-09 | 102 |
| hsa0421037 | Esophagus | ESCC | Apoptosis | 102/4205 | 136/8465 | 1.05e-09 | 1.21e-08 | 6.21e-09 | 102 |
| hsa0421018 | Oral cavity | OSCC | Apoptosis | 101/3704 | 136/8465 | 3.34e-13 | 7.00e-12 | 3.56e-12 | 101 |
| hsa0421019 | Oral cavity | OSCC | Apoptosis | 101/3704 | 136/8465 | 3.34e-13 | 7.00e-12 | 3.56e-12 | 101 |
| hsa0421026 | Oral cavity | LP | Apoptosis | 65/2418 | 136/8465 | 1.33e-06 | 1.48e-05 | 9.53e-06 | 65 |
| hsa0421036 | Oral cavity | LP | Apoptosis | 65/2418 | 136/8465 | 1.33e-06 | 1.48e-05 | 9.53e-06 | 65 |
| Page: 1 |
Top |
Cell-cell communication analysis |
| Identification of potential cell-cell interactions between two cell types and their ligand-receptor pairs for different disease states |
| Ligand | Receptor | LRpair | Pathway | Tissue | Disease Stage |
| Page: 1 |
Top |
Single-cell gene regulatory network inference analysis |
| Find out the significant the regulons (TFs) and the target genes of each regulon across cell types for different disease states |
| TF | Cell Type | Tissue | Disease Stage | Target Gene | RSS | Regulon Activity |
| ∗The dot plots of a searched regulon are shown for all cell subpopulations in each disease state of each tissue based on the regulon specific score inferred using pySCENIC and by calculating the average expression. |
| Page: 1 |
Top |
Somatic mutation of malignant transformation related genes |
| Annotation of somatic variants for genes involved in malignant transformation |
| Hugo Symbol | Variant Class | Variant Classification | dbSNP RS | HGVSc | HGVSp | HGVSp Short | SWISSPROT | BIOTYPE | SIFT | PolyPhen | Tumor Sample Barcode | Tissue | Histology | Sex | Age | Stage | Therapy Types | Drugs | Outcome |
| LMNB2 | SNV | Missense_Mutation | novel | c.1053N>C | p.Lys351Asn | p.K351N | Q03252 | protein_coding | deleterious(0.03) | benign(0.029) | TCGA-BH-A0B6-01 | Breast | breast invasive carcinoma | Female | <65 | I/II | Unknown | Unknown | SD |
| LMNB2 | SNV | Missense_Mutation | rs367908162 | c.1288C>T | p.Arg430Cys | p.R430C | Q03252 | protein_coding | deleterious(0) | probably_damaging(0.969) | TCGA-AA-A01P-01 | Colorectum | colon adenocarcinoma | Female | >=65 | III/IV | Unknown | Unknown | PD |
| LMNB2 | SNV | Missense_Mutation | rs774978600 | c.1700C>T | p.Ala567Val | p.A567V | Q03252 | protein_coding | deleterious(0.03) | benign(0.084) | TCGA-CA-6717-01 | Colorectum | colon adenocarcinoma | Male | <65 | I/II | Chemotherapy | oxaliplatin | CR |
| LMNB2 | SNV | Missense_Mutation | c.800N>G | p.His267Arg | p.H267R | Q03252 | protein_coding | deleterious(0) | possibly_damaging(0.662) | TCGA-CK-4951-01 | Colorectum | colon adenocarcinoma | Female | >=65 | I/II | Unknown | Unknown | PD | |
| LMNB2 | SNV | Missense_Mutation | rs777408921 | c.1540G>A | p.Ala514Thr | p.A514T | Q03252 | protein_coding | tolerated(0.84) | benign(0.001) | TCGA-G5-6235-01 | Colorectum | rectum adenocarcinoma | Male | >=65 | III/IV | Chemotherapy | oxaliplatin | PD |
| LMNB2 | insertion | Frame_Shift_Ins | rs776267567 | c.1629_1630insC | p.Ser544LeufsTer23 | p.S544Lfs*23 | Q03252 | protein_coding | TCGA-A6-6780-01 | Colorectum | colon adenocarcinoma | Male | >=65 | I/II | Unknown | Unknown | SD | ||
| LMNB2 | deletion | In_Frame_Del | c.1843_1845delNNN | p.Arg615del | p.R615del | Q03252 | protein_coding | TCGA-AA-3815-01 | Colorectum | colon adenocarcinoma | Female | >=65 | I/II | Unknown | Unknown | SD | |||
| LMNB2 | SNV | Missense_Mutation | novel | c.631C>T | p.Arg211Cys | p.R211C | Q03252 | protein_coding | deleterious(0) | probably_damaging(0.969) | TCGA-A5-A2K5-01 | Endometrium | uterine corpus endometrioid carcinoma | Female | >=65 | I/II | Unknown | Unknown | SD |
| LMNB2 | SNV | Missense_Mutation | novel | c.895N>A | p.Ala299Thr | p.A299T | Q03252 | protein_coding | tolerated(0.54) | probably_damaging(0.976) | TCGA-A5-A3LP-01 | Endometrium | uterine corpus endometrioid carcinoma | Female | >=65 | I/II | Chemotherapy | carboplatin | CR |
| LMNB2 | SNV | Missense_Mutation | rs771415464 | c.1420G>A | p.Val474Ile | p.V474I | Q03252 | protein_coding | tolerated(0.43) | benign(0.003) | TCGA-AJ-A3OK-01 | Endometrium | uterine corpus endometrioid carcinoma | Female | >=65 | I/II | Chemotherapy | carboplatin | CR |
| Page: 1 2 3 4 5 |
Top |
Related drugs of malignant transformation related genes |
| Identification of chemicals and drugs interact with genes involved in malignant transfromation |
| (DGIdb 4.0) |
| Entrez ID | Symbol | Category | Interaction Types | Drug Claim Name | Drug Name | PMIDs |
| Page: 1 |

Copyright 2023-Present -The University of Texas Health Science Center at Houston |