
|
|||||
|
 | |
| |
| |
| |
| |
| |
|
Gene: LMNB1 |
Gene summary for LMNB1 |
| Gene information | Species | Human | Gene symbol | LMNB1 | Gene ID | 4001 |
| Gene name | lamin B1 | |
| Gene Alias | ADLD | |
| Cytomap | 5q23.2 | |
| Gene Type | protein-coding | GO ID | GO:0005575 | UniProtAcc | B4DZT3 |
Top |
Malignant transformation analysis |
| Identification of the aberrant gene expression in precancerous and cancerous lesions by comparing the gene expression of stem-like cells in diseased tissues with normal stem cells |
| Entrez ID | Symbol | Replicates | Species | Organ | Tissue | Adj P-value | Log2FC | Malignancy |
| 4001 | LMNB1 | LZE2T | Human | Esophagus | ESCC | 1.86e-05 | 8.01e-01 | 0.082 |
| 4001 | LMNB1 | LZE24T | Human | Esophagus | ESCC | 3.13e-03 | 2.05e-01 | 0.0596 |
| 4001 | LMNB1 | LZE21T | Human | Esophagus | ESCC | 2.93e-02 | 1.99e-01 | 0.0655 |
| 4001 | LMNB1 | P2T-E | Human | Esophagus | ESCC | 4.99e-32 | 1.01e+00 | 0.1177 |
| 4001 | LMNB1 | P4T-E | Human | Esophagus | ESCC | 5.55e-17 | 6.51e-01 | 0.1323 |
| 4001 | LMNB1 | P5T-E | Human | Esophagus | ESCC | 4.18e-07 | 3.02e-01 | 0.1327 |
| 4001 | LMNB1 | P8T-E | Human | Esophagus | ESCC | 2.18e-04 | 2.11e-01 | 0.0889 |
| 4001 | LMNB1 | P9T-E | Human | Esophagus | ESCC | 3.03e-06 | 3.01e-01 | 0.1131 |
| 4001 | LMNB1 | P10T-E | Human | Esophagus | ESCC | 4.46e-09 | 3.23e-01 | 0.116 |
| 4001 | LMNB1 | P12T-E | Human | Esophagus | ESCC | 1.02e-14 | 3.73e-01 | 0.1122 |
| 4001 | LMNB1 | P15T-E | Human | Esophagus | ESCC | 1.20e-11 | 5.45e-01 | 0.1149 |
| 4001 | LMNB1 | P16T-E | Human | Esophagus | ESCC | 2.53e-11 | 4.68e-01 | 0.1153 |
| 4001 | LMNB1 | P17T-E | Human | Esophagus | ESCC | 3.77e-02 | 4.28e-01 | 0.1278 |
| 4001 | LMNB1 | P20T-E | Human | Esophagus | ESCC | 1.17e-07 | 4.24e-01 | 0.1124 |
| 4001 | LMNB1 | P21T-E | Human | Esophagus | ESCC | 6.87e-10 | 3.61e-01 | 0.1617 |
| 4001 | LMNB1 | P22T-E | Human | Esophagus | ESCC | 3.57e-03 | 2.06e-01 | 0.1236 |
| 4001 | LMNB1 | P23T-E | Human | Esophagus | ESCC | 2.97e-05 | 3.34e-01 | 0.108 |
| 4001 | LMNB1 | P24T-E | Human | Esophagus | ESCC | 1.14e-06 | 3.21e-01 | 0.1287 |
| 4001 | LMNB1 | P26T-E | Human | Esophagus | ESCC | 2.26e-07 | 3.10e-01 | 0.1276 |
| 4001 | LMNB1 | P27T-E | Human | Esophagus | ESCC | 6.75e-25 | 5.72e-01 | 0.1055 |
| Page: 1 2 3 4 |
| Tissue | Expression Dynamics | Abbreviation |
| Esophagus |  | ESCC: Esophageal squamous cell carcinoma |
| HGIN: High-grade intraepithelial neoplasias | ||
| LGIN: Low-grade intraepithelial neoplasias | ||
| Liver |  | HCC: Hepatocellular carcinoma |
| NAFLD: Non-alcoholic fatty liver disease | ||
| Oral Cavity | 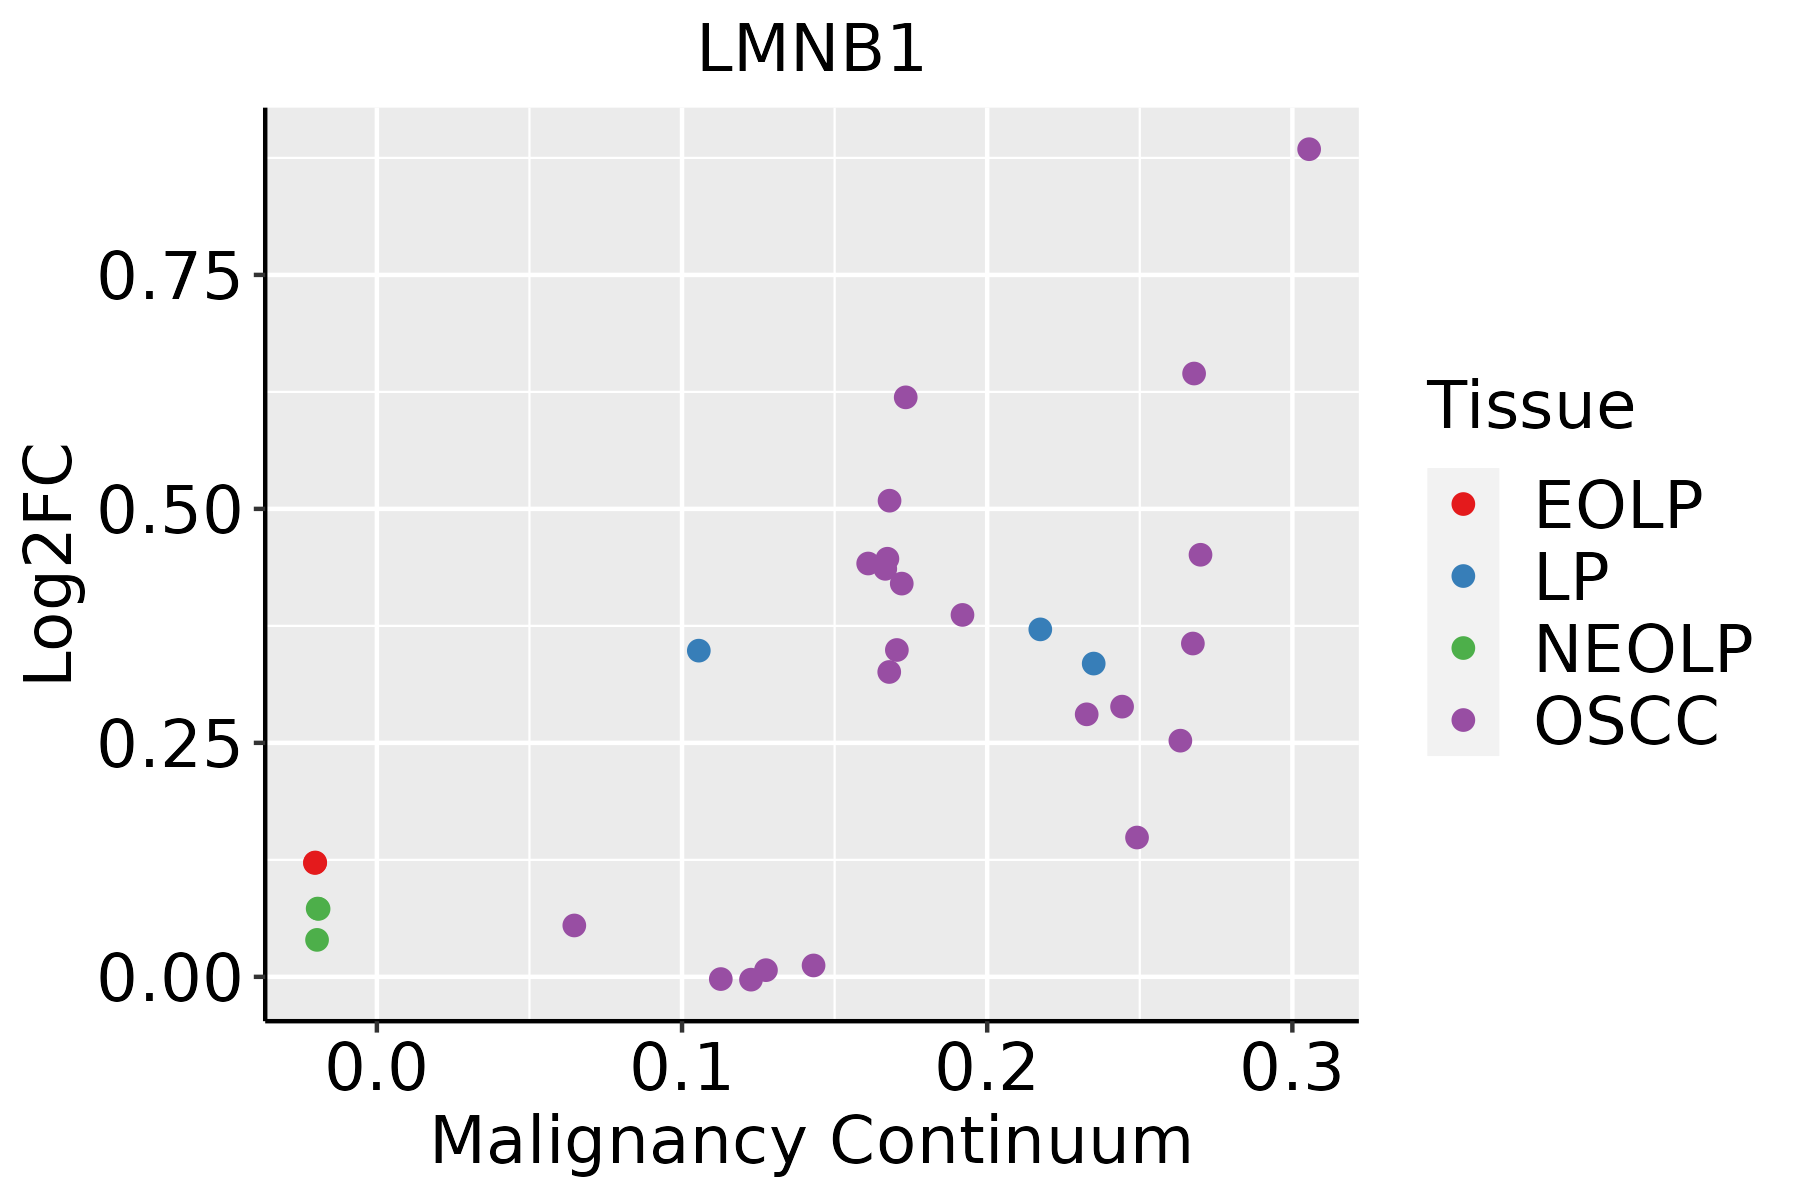 | EOLP: Erosive Oral lichen planus |
| LP: leukoplakia | ||
| NEOLP: Non-erosive oral lichen planus | ||
| OSCC: Oral squamous cell carcinoma | ||
| Skin | 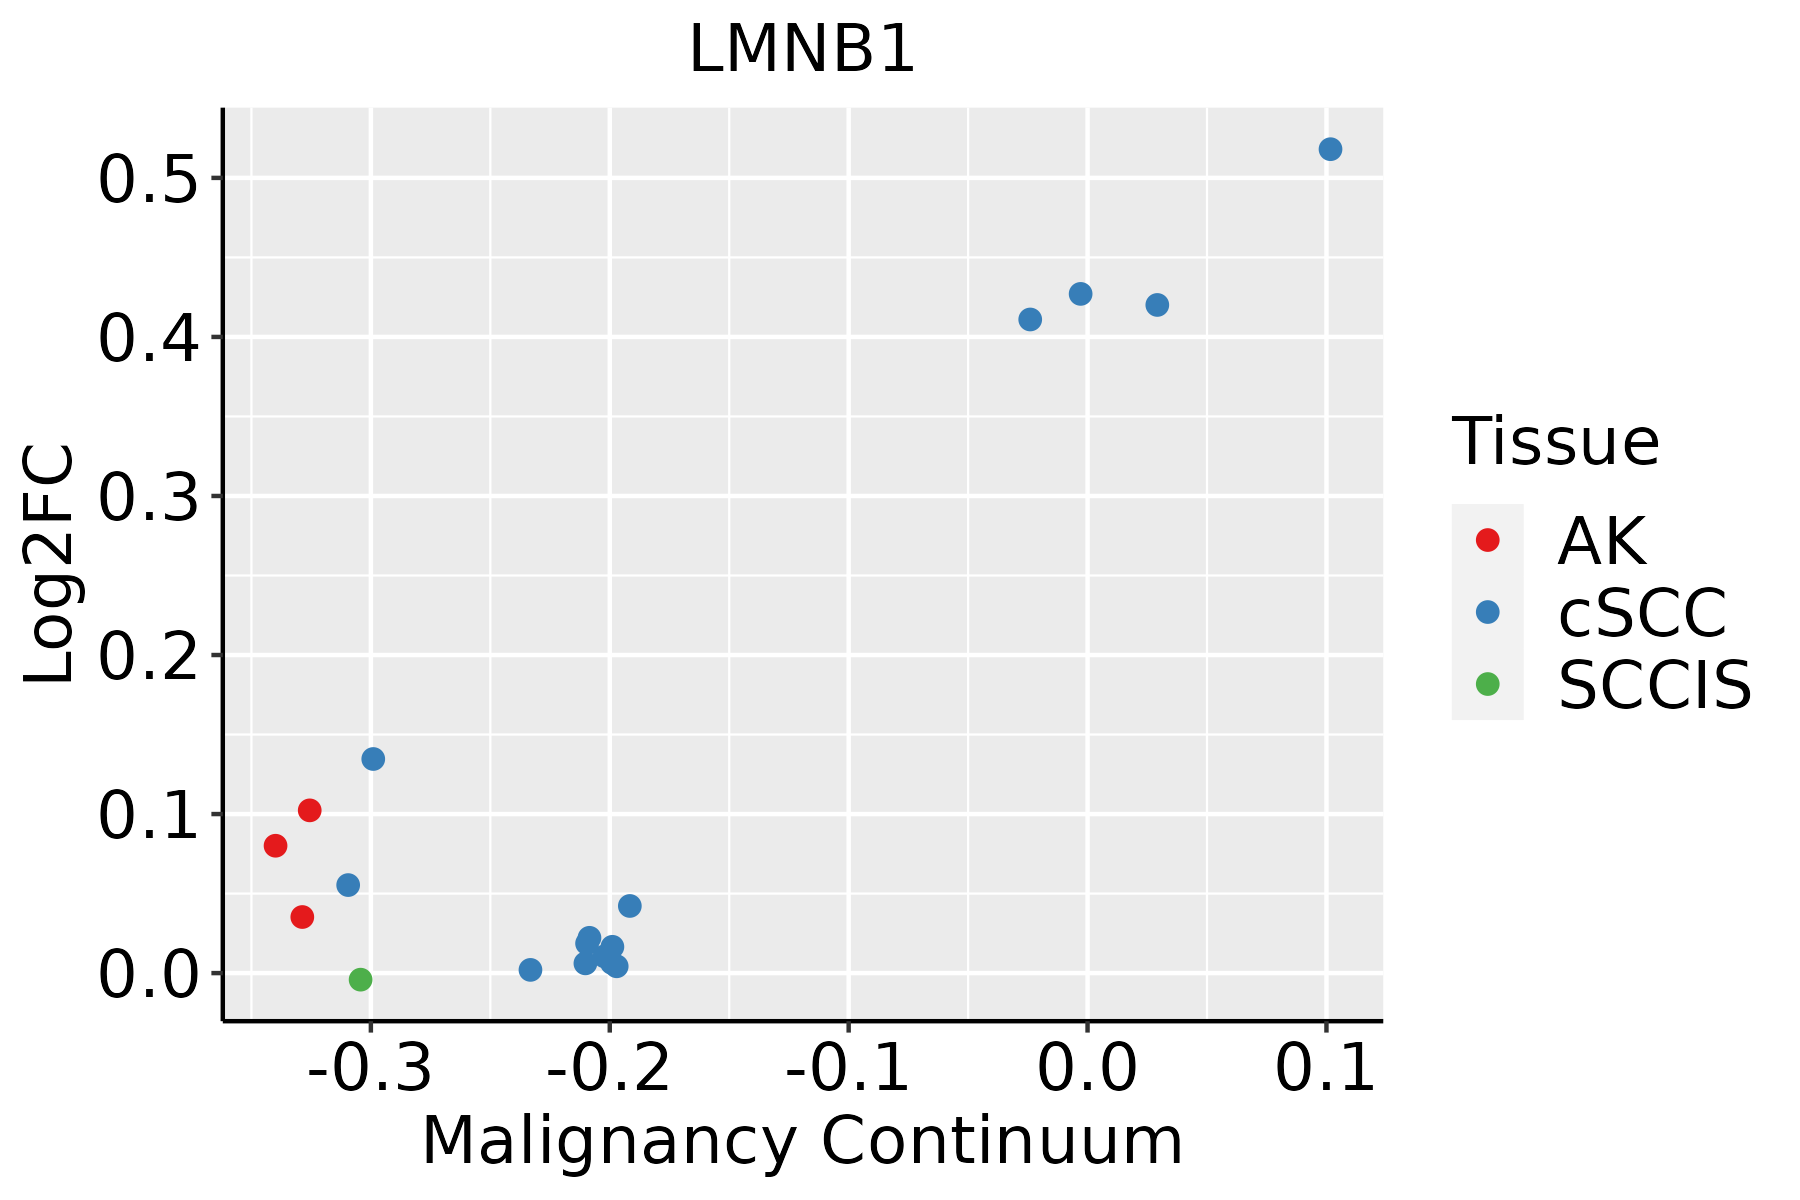 | AK: Actinic keratosis |
| cSCC: Cutaneous squamous cell carcinoma | ||
| SCCIS:squamous cell carcinoma in situ | ||
| Thyroid | 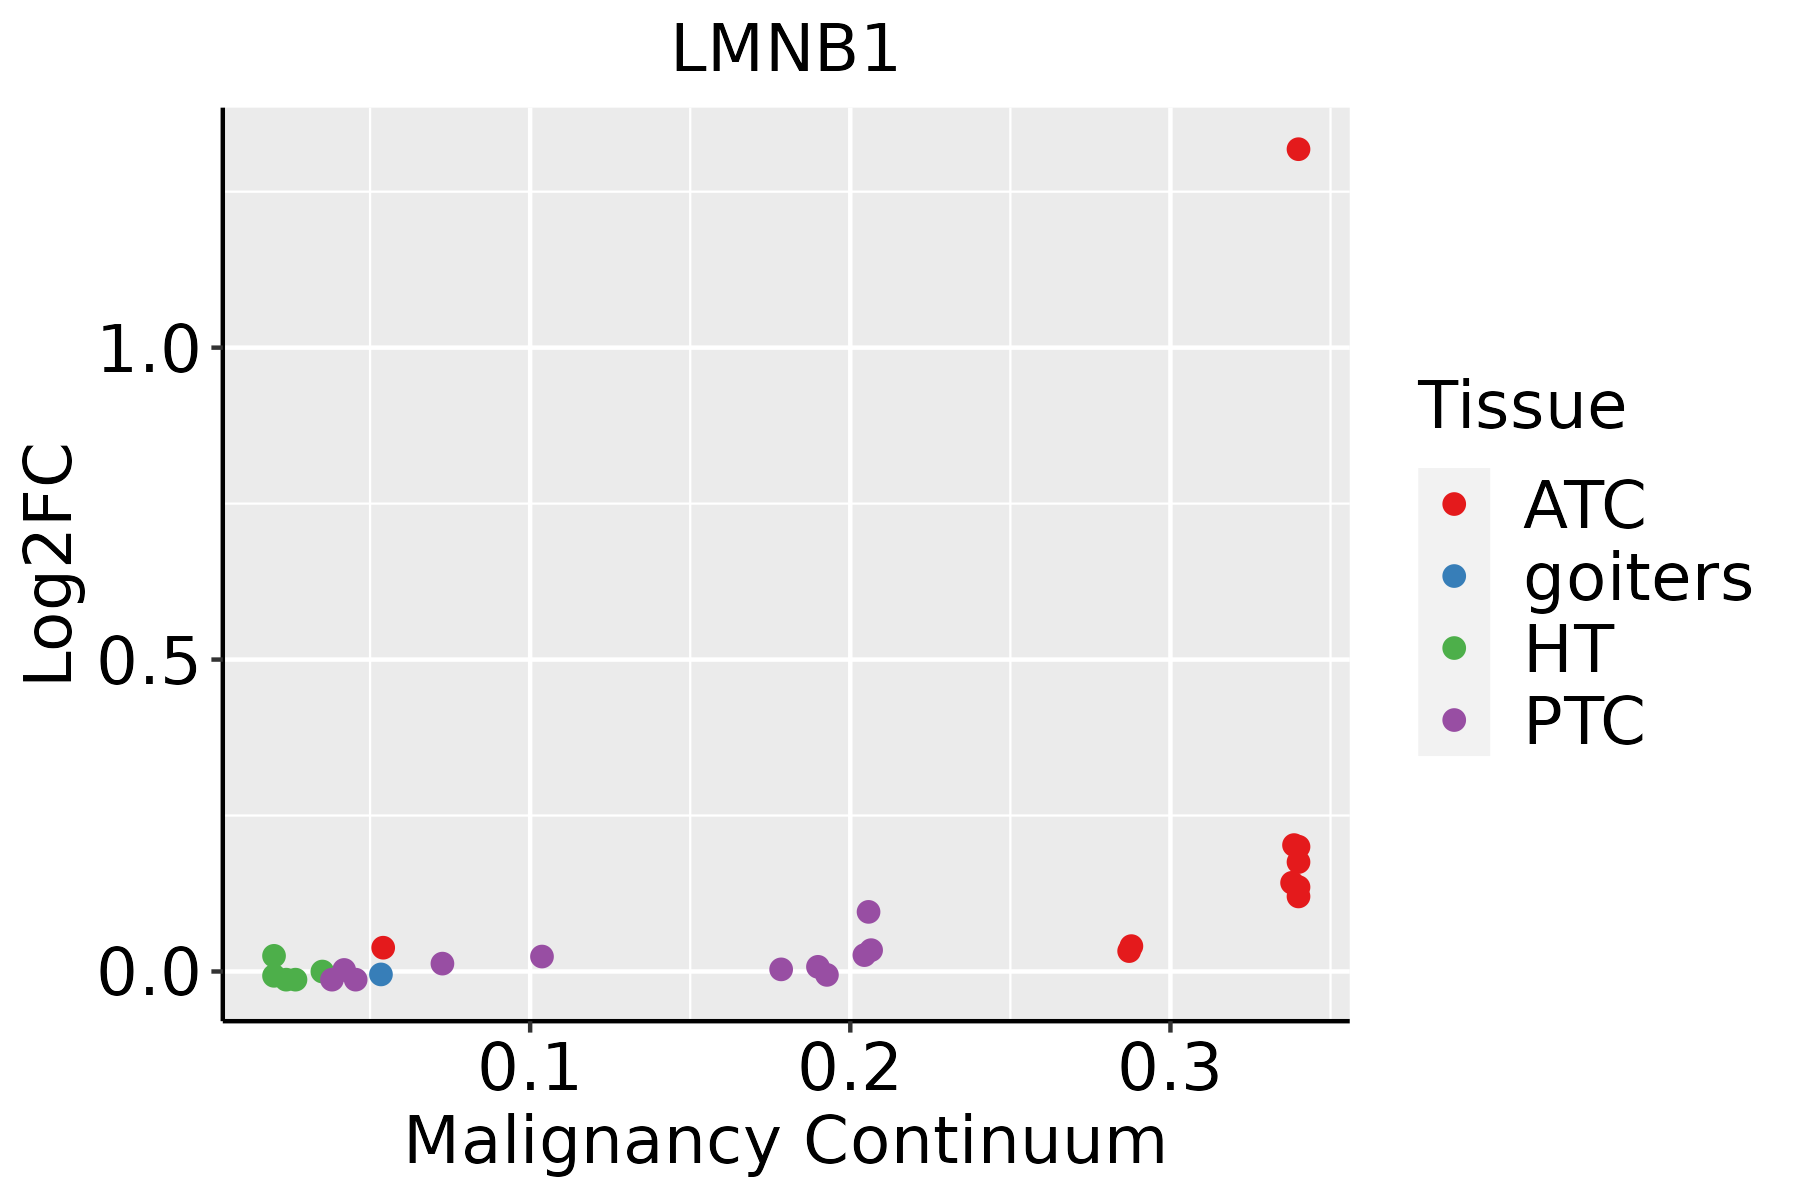 | ATC: Anaplastic thyroid cancer |
| HT: Hashimoto's thyroiditis | ||
| PTC: Papillary thyroid cancer |
| ∗log2FC in expression of this searched gene in stem-like cells from each diseased tissue sample relative to stem-like cells in normal samples in each tissue plotted against the malignancy continuum. Samples are colored based on if they are from different disease stage. |
Top |
Malignant transformation related pathway analysis |
| Find out the enriched GO biological processes and KEGG pathways involved in transition from healthy to precancer to cancer |
| Tissue | Disease Stage | Enriched GO biological Processes |
| Colorectum | AD |  |
| Colorectum | SER |  |
| Colorectum | MSS |  |
| Colorectum | MSI-H |  |
| Colorectum | FAP |  |
| ∗Top 15 enriched GO BP terms are showed in the bar plot of each disease state in each tissue. Each row represents a significant GO biological process which is colored according to the -log10(p.adjust). |
| Page: 1 2 3 4 5 6 7 8 9 |
| GO ID | Tissue | Disease Stage | Description | Gene Ratio | Bg Ratio | pvalue | p.adjust | Count |
| Page: 1 |
| Pathway ID | Tissue | Disease Stage | Description | Gene Ratio | Bg Ratio | pvalue | p.adjust | qvalue | Count |
| hsa0421027 | Esophagus | ESCC | Apoptosis | 102/4205 | 136/8465 | 1.05e-09 | 1.21e-08 | 6.21e-09 | 102 |
| hsa0421037 | Esophagus | ESCC | Apoptosis | 102/4205 | 136/8465 | 1.05e-09 | 1.21e-08 | 6.21e-09 | 102 |
| hsa042102 | Liver | HCC | Apoptosis | 83/4020 | 136/8465 | 9.51e-04 | 3.58e-03 | 1.99e-03 | 83 |
| hsa042103 | Liver | HCC | Apoptosis | 83/4020 | 136/8465 | 9.51e-04 | 3.58e-03 | 1.99e-03 | 83 |
| hsa0421018 | Oral cavity | OSCC | Apoptosis | 101/3704 | 136/8465 | 3.34e-13 | 7.00e-12 | 3.56e-12 | 101 |
| hsa0421019 | Oral cavity | OSCC | Apoptosis | 101/3704 | 136/8465 | 3.34e-13 | 7.00e-12 | 3.56e-12 | 101 |
| Page: 1 |
Top |
Cell-cell communication analysis |
| Identification of potential cell-cell interactions between two cell types and their ligand-receptor pairs for different disease states |
| Ligand | Receptor | LRpair | Pathway | Tissue | Disease Stage |
| Page: 1 |
Top |
Single-cell gene regulatory network inference analysis |
| Find out the significant the regulons (TFs) and the target genes of each regulon across cell types for different disease states |
| TF | Cell Type | Tissue | Disease Stage | Target Gene | RSS | Regulon Activity |
| ∗The dot plots of a searched regulon are shown for all cell subpopulations in each disease state of each tissue based on the regulon specific score inferred using pySCENIC and by calculating the average expression. |
| Page: 1 |
Top |
Somatic mutation of malignant transformation related genes |
| Annotation of somatic variants for genes involved in malignant transformation |
| Hugo Symbol | Variant Class | Variant Classification | dbSNP RS | HGVSc | HGVSp | HGVSp Short | SWISSPROT | BIOTYPE | SIFT | PolyPhen | Tumor Sample Barcode | Tissue | Histology | Sex | Age | Stage | Therapy Types | Drugs | Outcome |
| LMNB1 | SNV | Missense_Mutation | novel | c.1562N>T | p.Trp521Leu | p.W521L | P20700 | protein_coding | deleterious(0) | possibly_damaging(0.73) | TCGA-A7-A0DB-01 | Breast | breast invasive carcinoma | Female | <65 | I/II | Hormone Therapy | arimidex | SD |
| LMNB1 | SNV | Missense_Mutation | c.786N>C | p.Glu262Asp | p.E262D | P20700 | protein_coding | tolerated(0.39) | benign(0.034) | TCGA-BH-A18Q-01 | Breast | breast invasive carcinoma | Female | <65 | I/II | Unknown | Unknown | SD | |
| LMNB1 | insertion | Nonsense_Mutation | novel | c.1141_1142insAACTCAC | p.Leu381Ter | p.L381* | P20700 | protein_coding | TCGA-A8-A09N-01 | Breast | breast invasive carcinoma | Female | <65 | III/IV | Unknown | Unknown | SD | ||
| LMNB1 | SNV | Missense_Mutation | novel | c.887G>A | p.Ser296Asn | p.S296N | P20700 | protein_coding | deleterious(0.03) | possibly_damaging(0.474) | TCGA-2W-A8YY-01 | Cervix | cervical & endocervical cancer | Female | <65 | I/II | Chemotherapy | cisplatin | CR |
| LMNB1 | SNV | Missense_Mutation | c.269G>A | p.Arg90Gln | p.R90Q | P20700 | protein_coding | deleterious(0) | probably_damaging(0.997) | TCGA-DG-A2KK-01 | Cervix | cervical & endocervical cancer | Female | <65 | III/IV | Chemotherapy | cisplatin | SD | |
| LMNB1 | SNV | Missense_Mutation | novel | c.743A>T | p.Glu248Val | p.E248V | P20700 | protein_coding | deleterious(0) | probably_damaging(0.962) | TCGA-EA-A410-01 | Cervix | cervical & endocervical cancer | Female | <65 | I/II | Unknown | Unknown | SD |
| LMNB1 | SNV | Missense_Mutation | novel | c.67N>G | p.Ser23Gly | p.S23G | P20700 | protein_coding | deleterious(0) | possibly_damaging(0.508) | TCGA-EK-A2RA-01 | Cervix | cervical & endocervical cancer | Female | >=65 | I/II | Unknown | Unknown | SD |
| LMNB1 | SNV | Missense_Mutation | c.550T>G | p.Leu184Val | p.L184V | P20700 | protein_coding | deleterious(0) | possibly_damaging(0.456) | TCGA-AA-3663-01 | Colorectum | colon adenocarcinoma | Male | <65 | I/II | Unknown | Unknown | SD | |
| LMNB1 | SNV | Missense_Mutation | novel | c.1601N>A | p.Ser534Tyr | p.S534Y | P20700 | protein_coding | deleterious(0) | possibly_damaging(0.455) | TCGA-AA-3984-01 | Colorectum | colon adenocarcinoma | Female | <65 | I/II | Unknown | Unknown | SD |
| LMNB1 | SNV | Missense_Mutation | c.1036N>C | p.Met346Leu | p.M346L | P20700 | protein_coding | tolerated(0.07) | benign(0.001) | TCGA-AA-A010-01 | Colorectum | colon adenocarcinoma | Female | <65 | I/II | Chemotherapy | folinic | CR |
| Page: 1 2 3 4 5 |
Top |
Related drugs of malignant transformation related genes |
| Identification of chemicals and drugs interact with genes involved in malignant transfromation |
| (DGIdb 4.0) |
| Entrez ID | Symbol | Category | Interaction Types | Drug Claim Name | Drug Name | PMIDs |
| Page: 1 |

Copyright 2023-Present -The University of Texas Health Science Center at Houston |