
|
|||||
|
 | |
| |
| |
| |
| |
| |
|
Gene: LMNA |
Gene summary for LMNA |
| Gene information | Species | Human | Gene symbol | LMNA | Gene ID | 4000 |
| Gene name | lamin A/C | |
| Gene Alias | CDCD1 | |
| Cytomap | 1q22 | |
| Gene Type | protein-coding | GO ID | GO:0000226 | UniProtAcc | P02545 |
Top |
Malignant transformation analysis |
| Identification of the aberrant gene expression in precancerous and cancerous lesions by comparing the gene expression of stem-like cells in diseased tissues with normal stem cells |
| Entrez ID | Symbol | Replicates | Species | Organ | Tissue | Adj P-value | Log2FC | Malignancy |
| 4000 | LMNA | GSM4909282 | Human | Breast | IDC | 2.01e-11 | 3.94e-01 | -0.0288 |
| 4000 | LMNA | GSM4909287 | Human | Breast | IDC | 3.68e-05 | 2.31e-01 | 0.2057 |
| 4000 | LMNA | GSM4909288 | Human | Breast | IDC | 8.50e-03 | -9.63e-02 | 0.0988 |
| 4000 | LMNA | GSM4909291 | Human | Breast | IDC | 3.37e-07 | 3.98e-01 | 0.1753 |
| 4000 | LMNA | GSM4909294 | Human | Breast | IDC | 1.18e-08 | -5.17e-01 | 0.2022 |
| 4000 | LMNA | GSM4909295 | Human | Breast | IDC | 4.43e-20 | 6.19e-01 | 0.0898 |
| 4000 | LMNA | GSM4909296 | Human | Breast | IDC | 1.15e-11 | -4.52e-01 | 0.1524 |
| 4000 | LMNA | GSM4909297 | Human | Breast | IDC | 1.62e-16 | -1.18e-01 | 0.1517 |
| 4000 | LMNA | GSM4909299 | Human | Breast | IDC | 1.01e-08 | 3.54e-01 | 0.035 |
| 4000 | LMNA | GSM4909300 | Human | Breast | IDC | 3.16e-14 | 5.43e-01 | 0.0334 |
| 4000 | LMNA | GSM4909301 | Human | Breast | IDC | 4.05e-13 | -5.63e-01 | 0.1577 |
| 4000 | LMNA | GSM4909302 | Human | Breast | IDC | 1.13e-03 | -3.31e-01 | 0.1545 |
| 4000 | LMNA | GSM4909304 | Human | Breast | IDC | 1.14e-06 | -4.23e-01 | 0.1636 |
| 4000 | LMNA | GSM4909308 | Human | Breast | IDC | 2.04e-05 | 3.45e-01 | 0.158 |
| 4000 | LMNA | GSM4909309 | Human | Breast | IDC | 2.93e-03 | 8.91e-02 | 0.0483 |
| 4000 | LMNA | GSM4909311 | Human | Breast | IDC | 2.12e-42 | -4.36e-01 | 0.1534 |
| 4000 | LMNA | GSM4909312 | Human | Breast | IDC | 1.23e-07 | -6.33e-02 | 0.1552 |
| 4000 | LMNA | GSM4909313 | Human | Breast | IDC | 2.02e-29 | 5.57e-01 | 0.0391 |
| 4000 | LMNA | GSM4909317 | Human | Breast | IDC | 1.82e-11 | 4.35e-01 | 0.1355 |
| 4000 | LMNA | GSM4909319 | Human | Breast | IDC | 3.08e-54 | -1.04e-01 | 0.1563 |
| Page: 1 2 3 4 5 6 7 8 9 10 11 12 13 14 15 16 17 |
| Tissue | Expression Dynamics | Abbreviation |
| Breast |  | IDC: Invasive ductal carcinoma |
| DCIS: Ductal carcinoma in situ | ||
| Precancer(BRCA1-mut): Precancerous lesion from BRCA1 mutation carriers | ||
| Cervix | 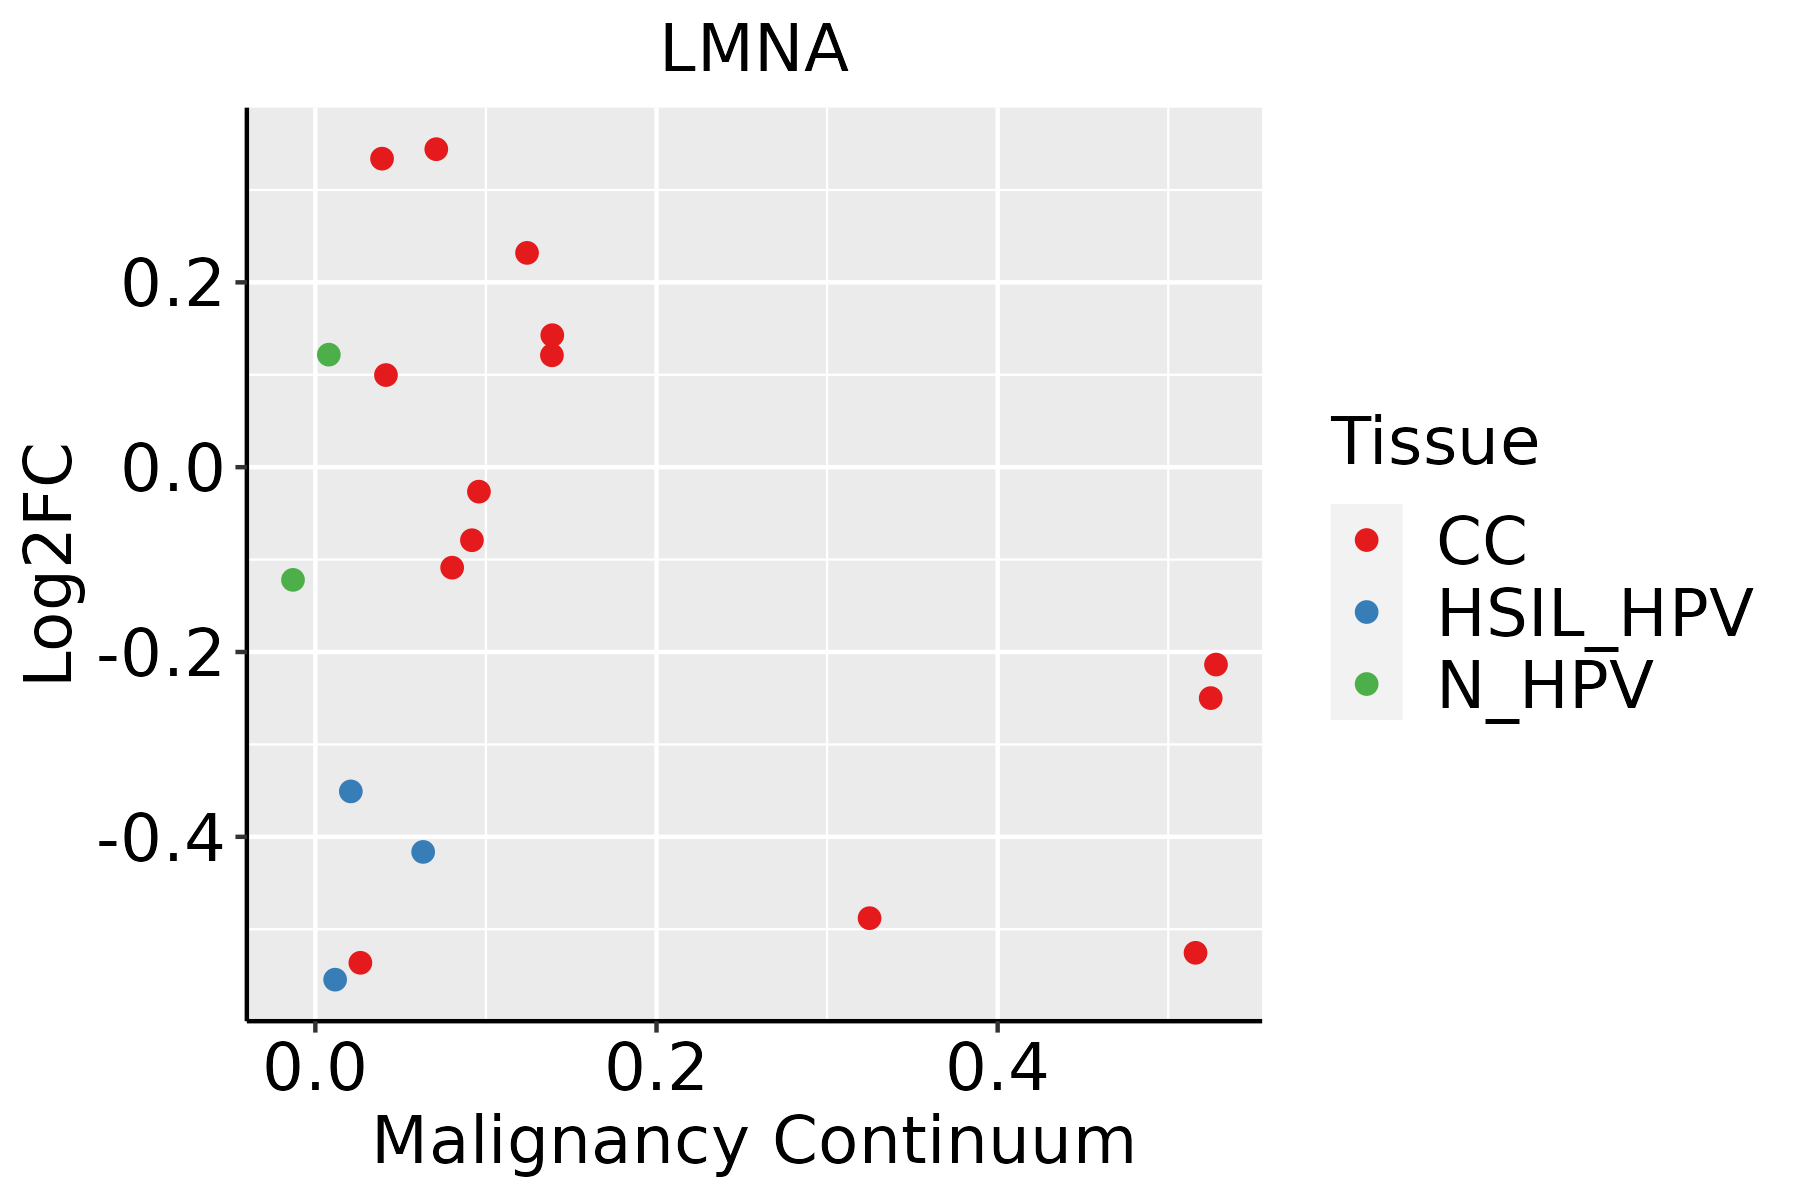 | CC: Cervix cancer |
| HSIL_HPV: HPV-infected high-grade squamous intraepithelial lesions | ||
| N_HPV: HPV-infected normal cervix | ||
| Colorectum (GSE201348) |  | FAP: Familial adenomatous polyposis |
| CRC: Colorectal cancer | ||
| Colorectum (HTA11) |  | AD: Adenomas |
| SER: Sessile serrated lesions | ||
| MSI-H: Microsatellite-high colorectal cancer | ||
| MSS: Microsatellite stable colorectal cancer | ||
| Esophagus | 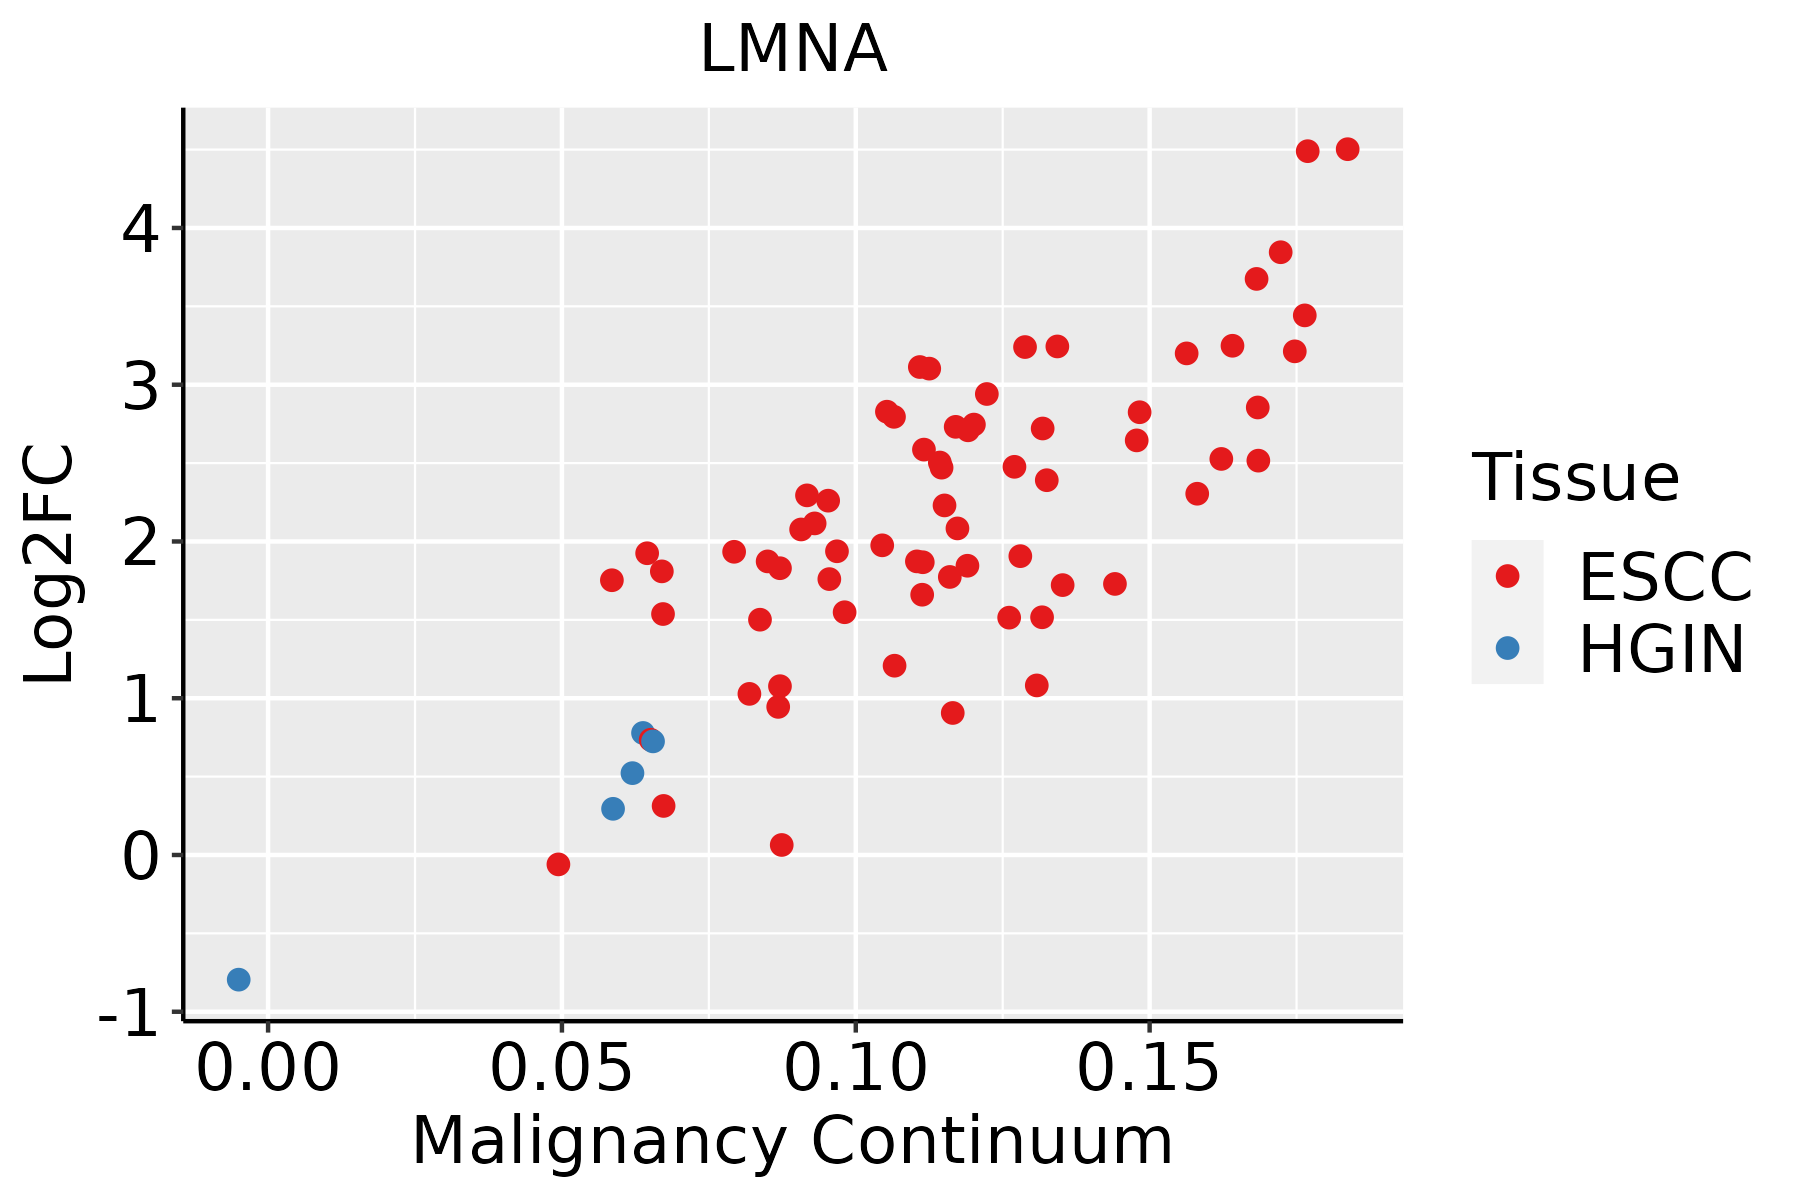 | ESCC: Esophageal squamous cell carcinoma |
| HGIN: High-grade intraepithelial neoplasias | ||
| LGIN: Low-grade intraepithelial neoplasias | ||
| GC | 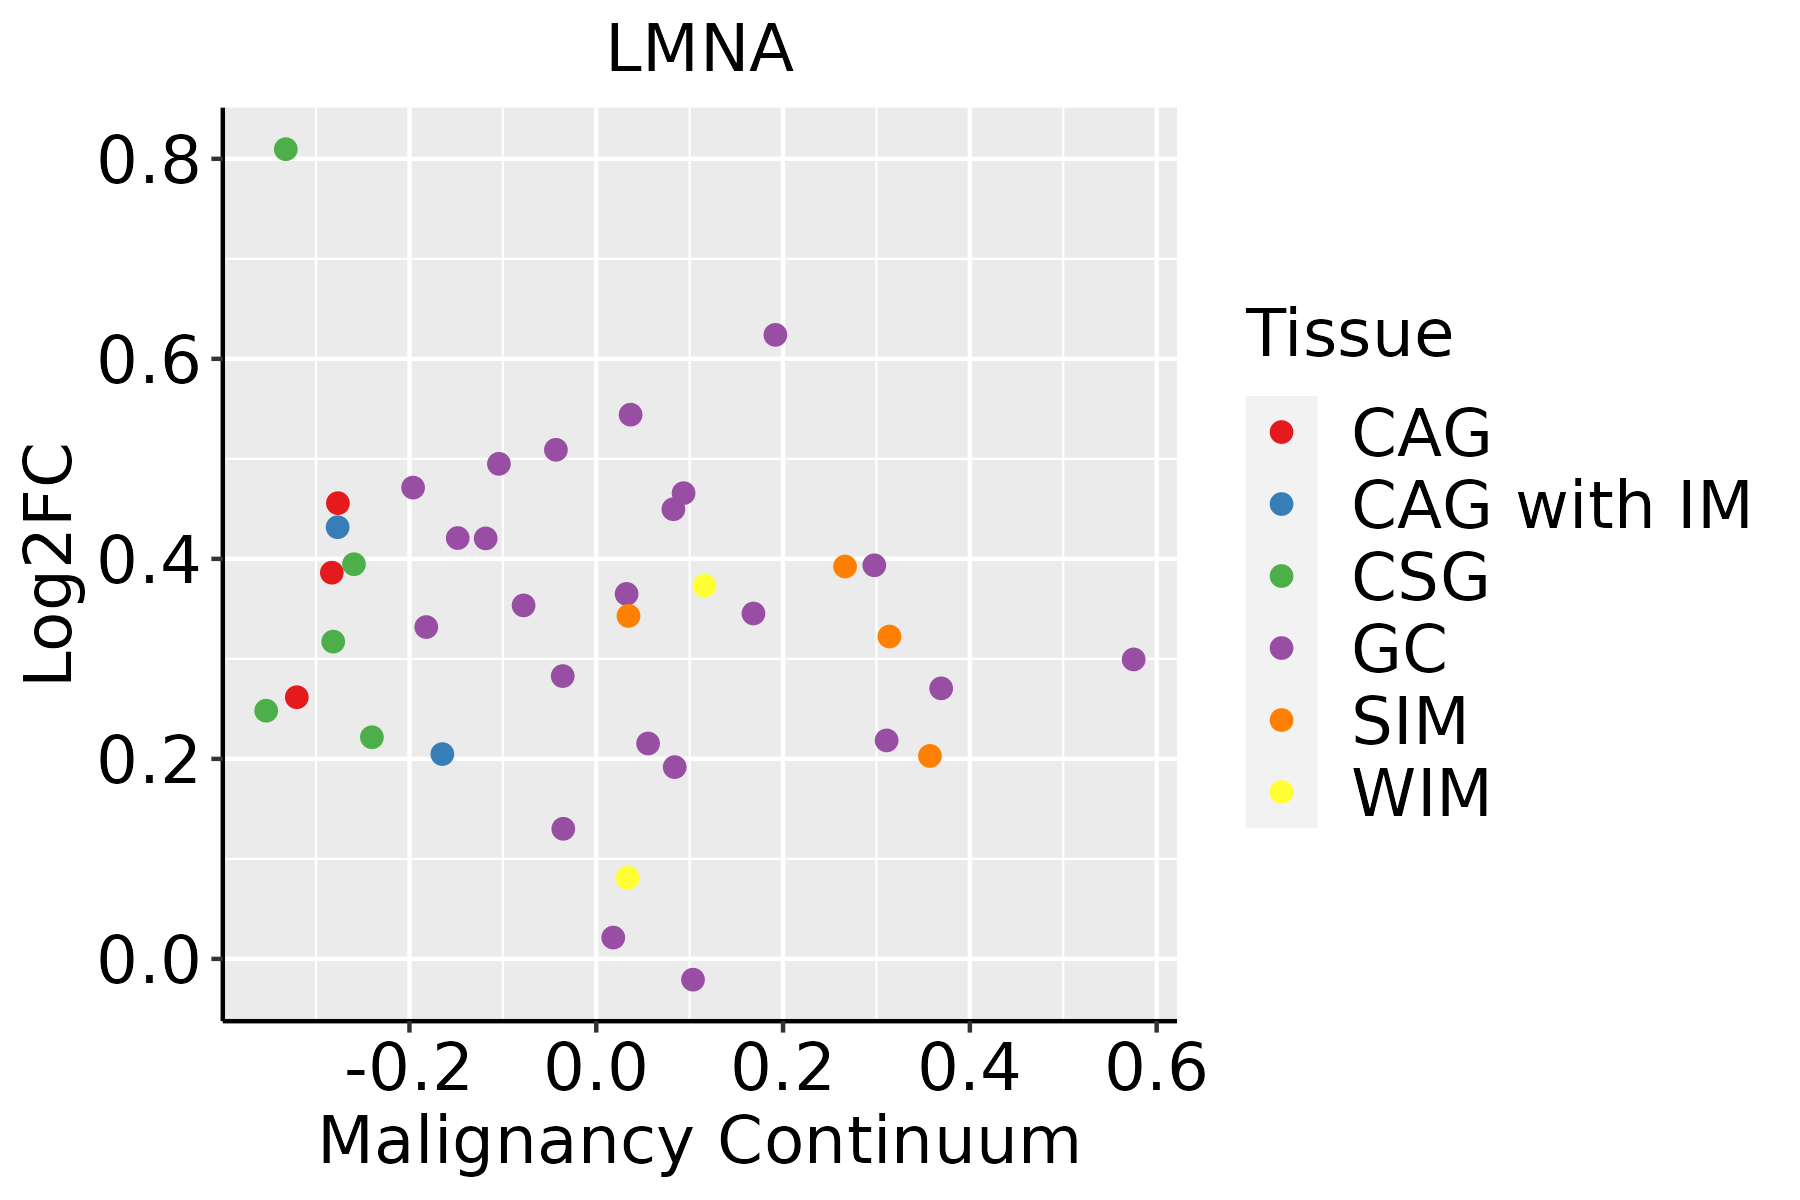 | CAG: Chronic atrophic gastritis |
| CAG with IM: Chronic atrophic gastritis with intestinal metaplasia | ||
| CSG: Chronic superficial gastritis | ||
| GC: Gastric cancer | ||
| SIM: Severe intestinal metaplasia | ||
| WIM: Wild intestinal metaplasia | ||
| Liver |  | HCC: Hepatocellular carcinoma |
| NAFLD: Non-alcoholic fatty liver disease | ||
| Lung |  | AAH: Atypical adenomatous hyperplasia |
| AIS: Adenocarcinoma in situ | ||
| IAC: Invasive lung adenocarcinoma | ||
| MIA: Minimally invasive adenocarcinoma | ||
| Oral Cavity | 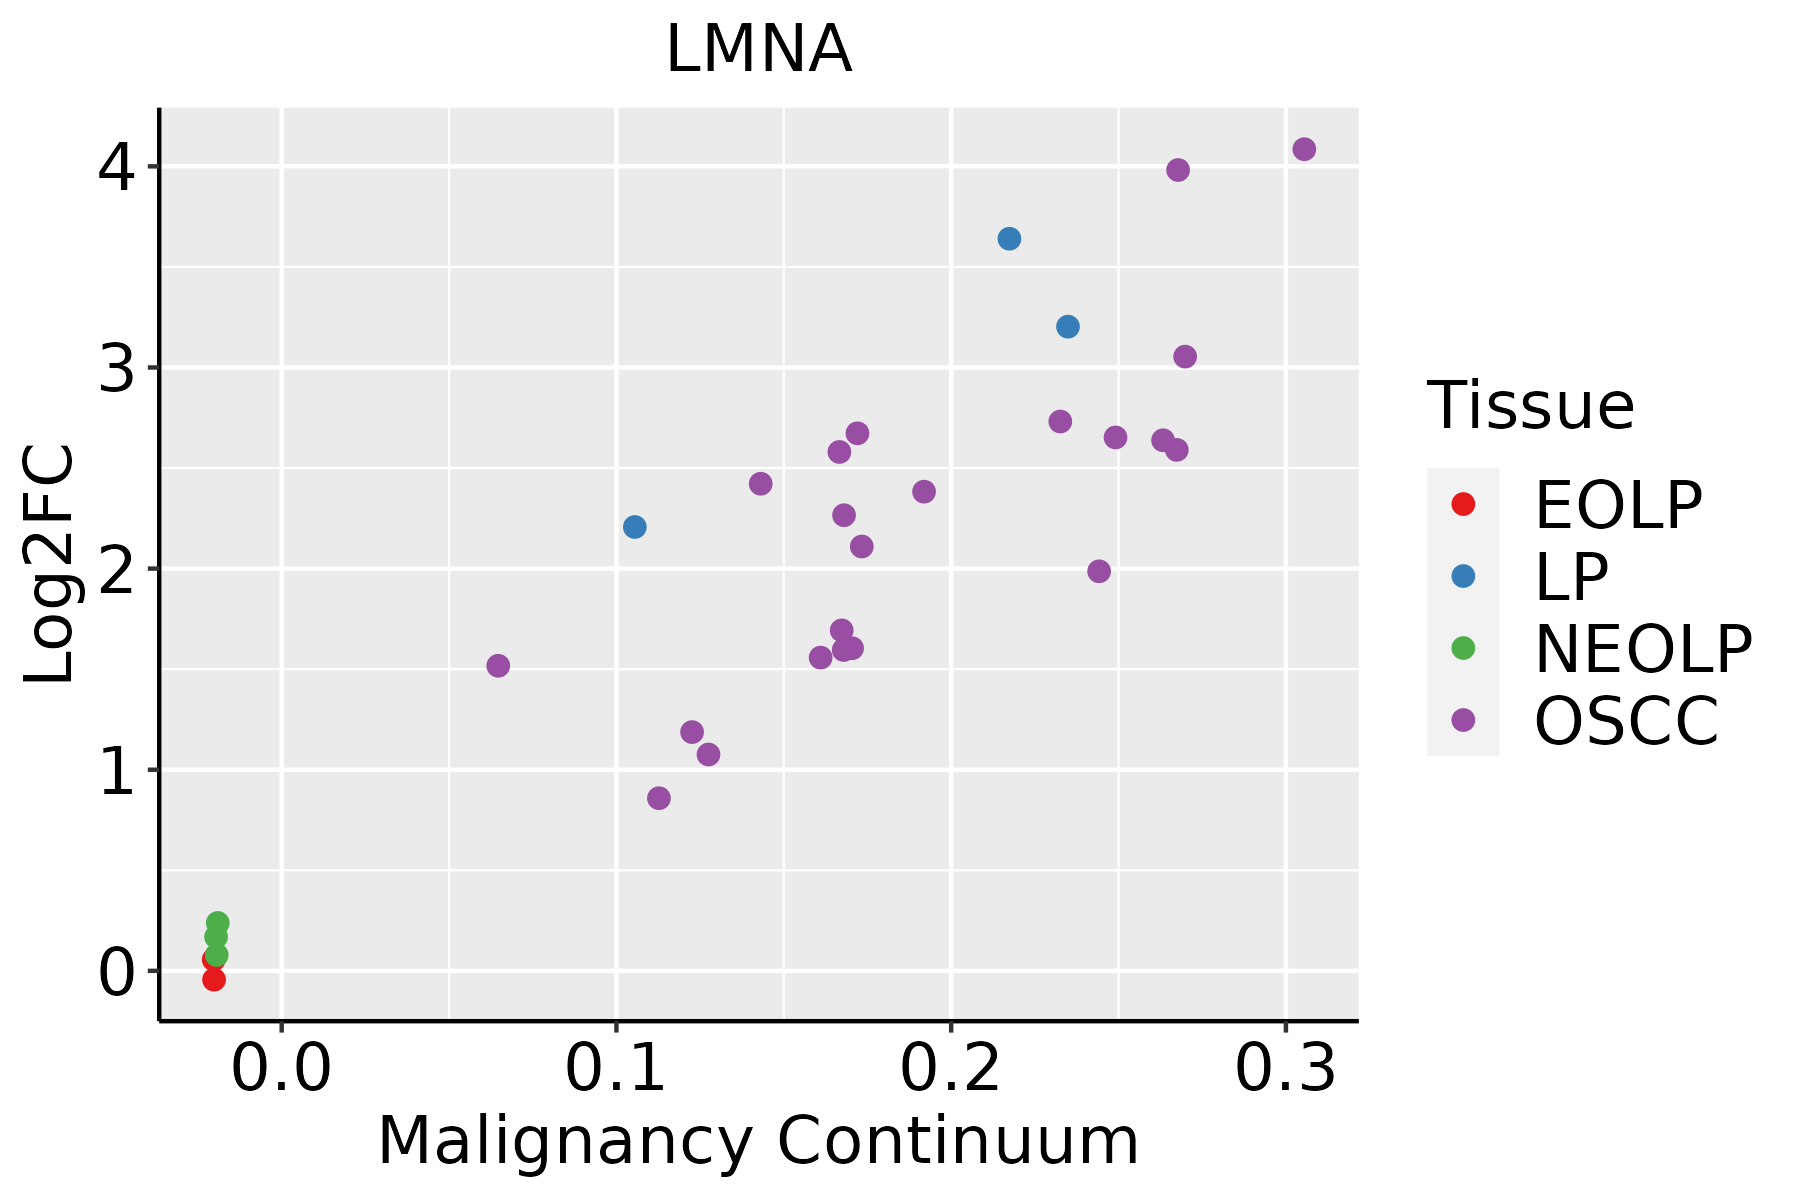 | EOLP: Erosive Oral lichen planus |
| LP: leukoplakia | ||
| NEOLP: Non-erosive oral lichen planus | ||
| OSCC: Oral squamous cell carcinoma | ||
| Prostate | 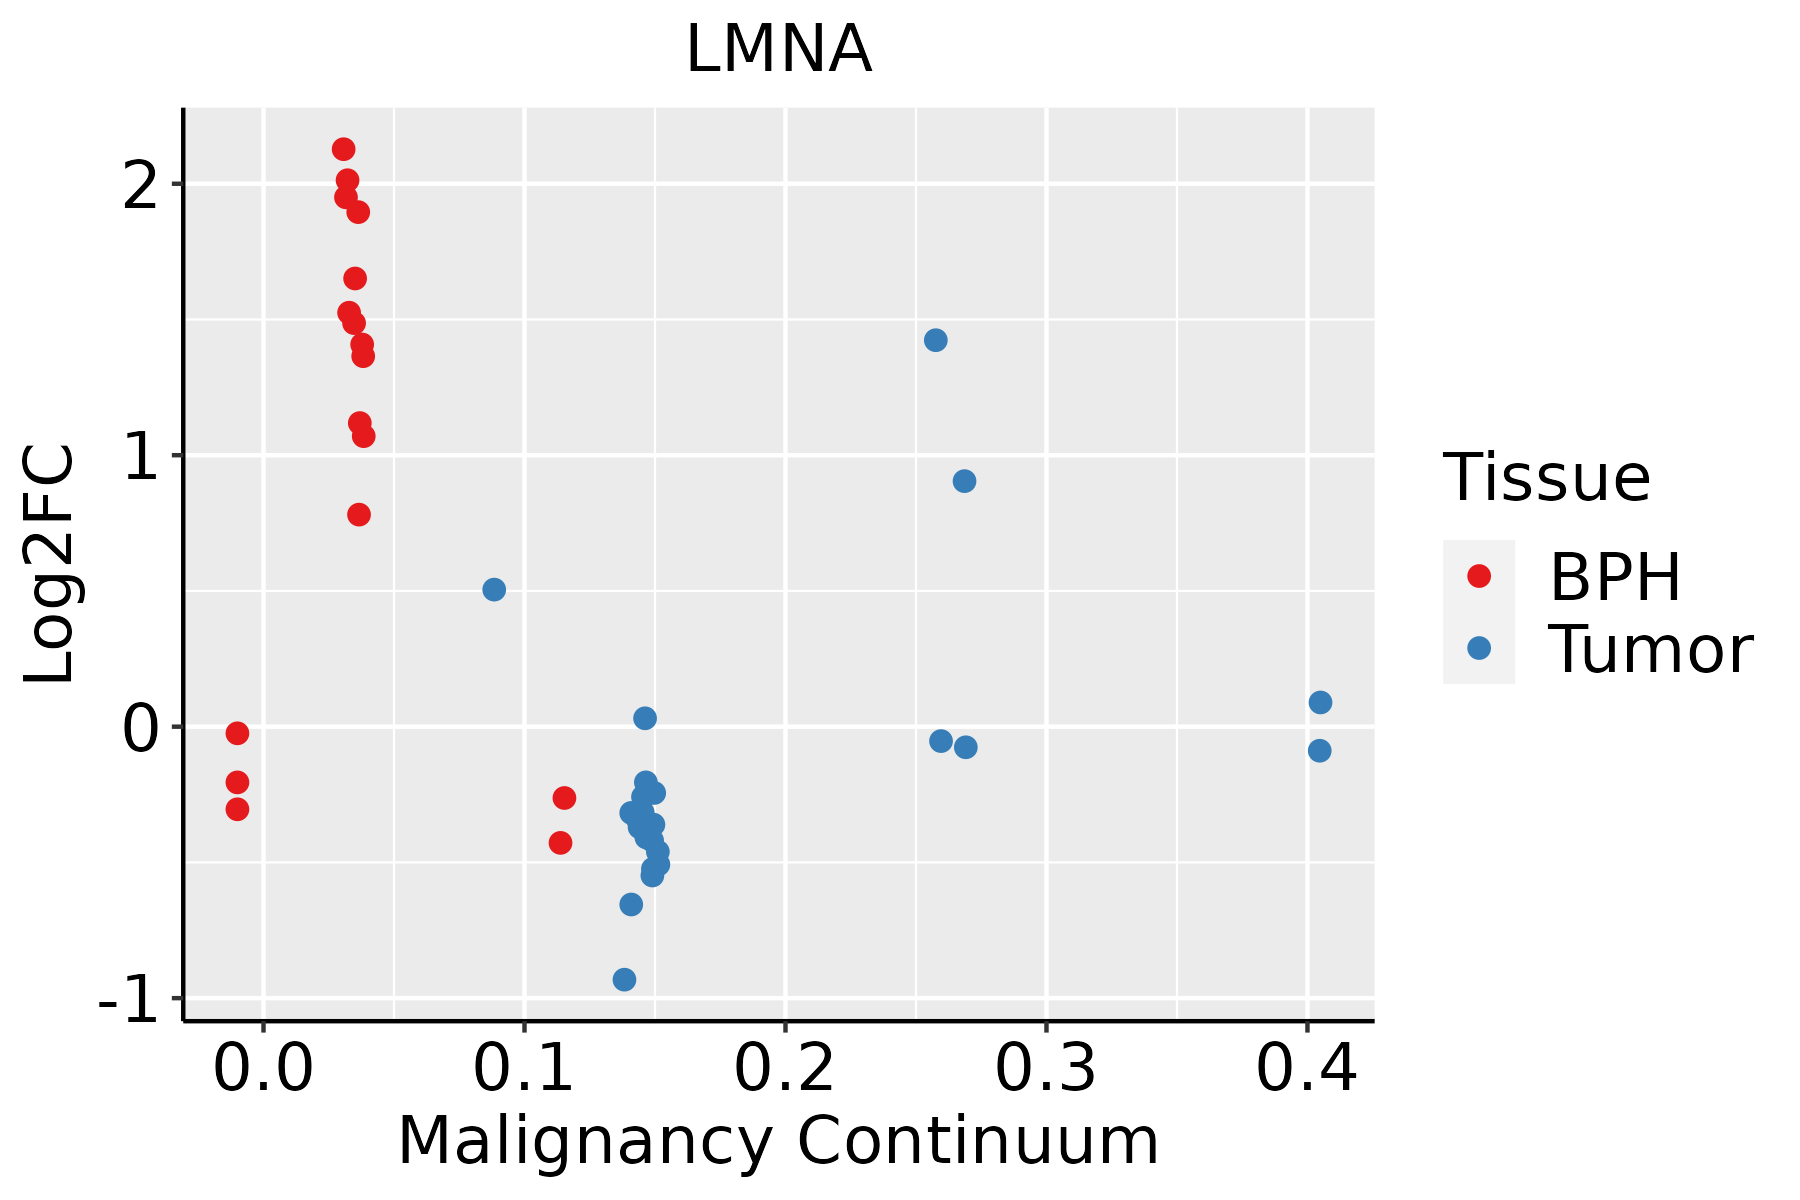 | BPH: Benign Prostatic Hyperplasia |
| Skin | 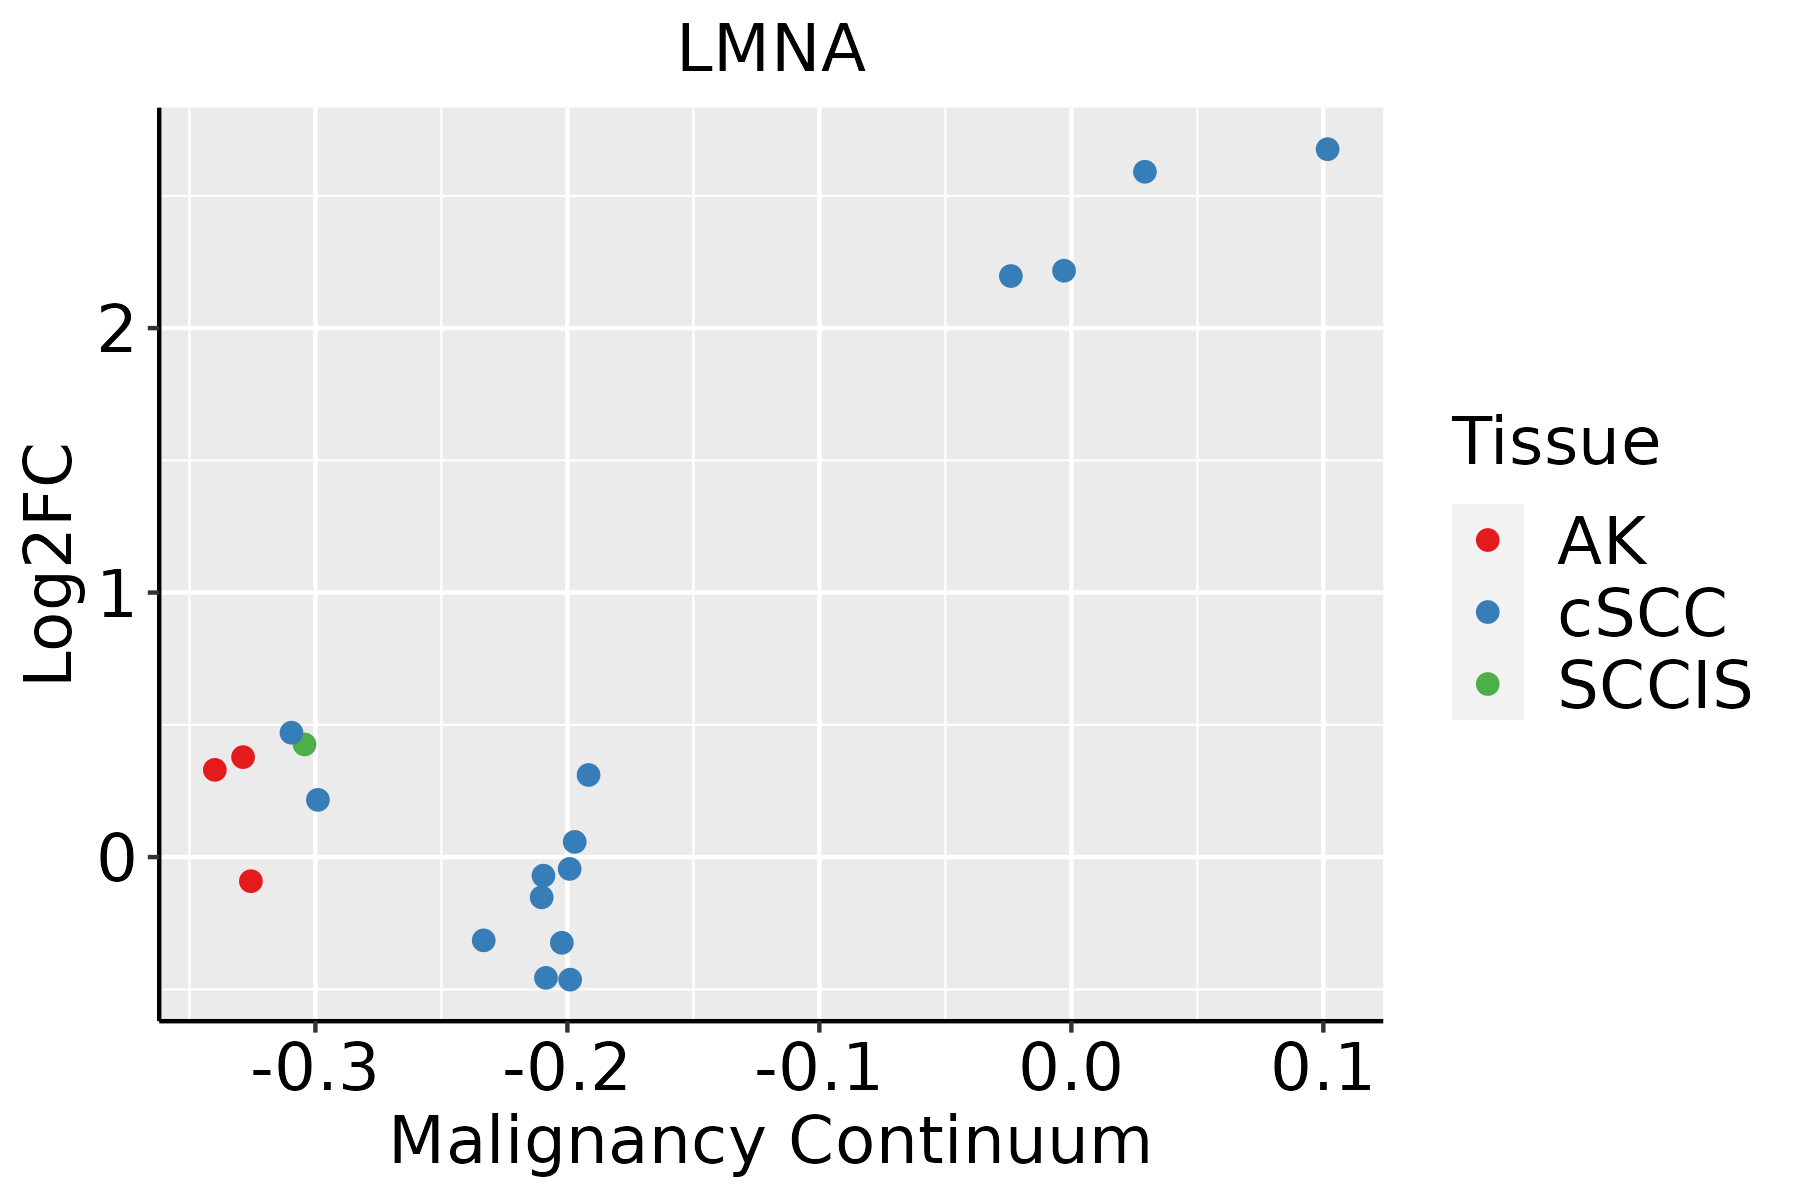 | AK: Actinic keratosis |
| cSCC: Cutaneous squamous cell carcinoma | ||
| SCCIS:squamous cell carcinoma in situ | ||
| Thyroid | 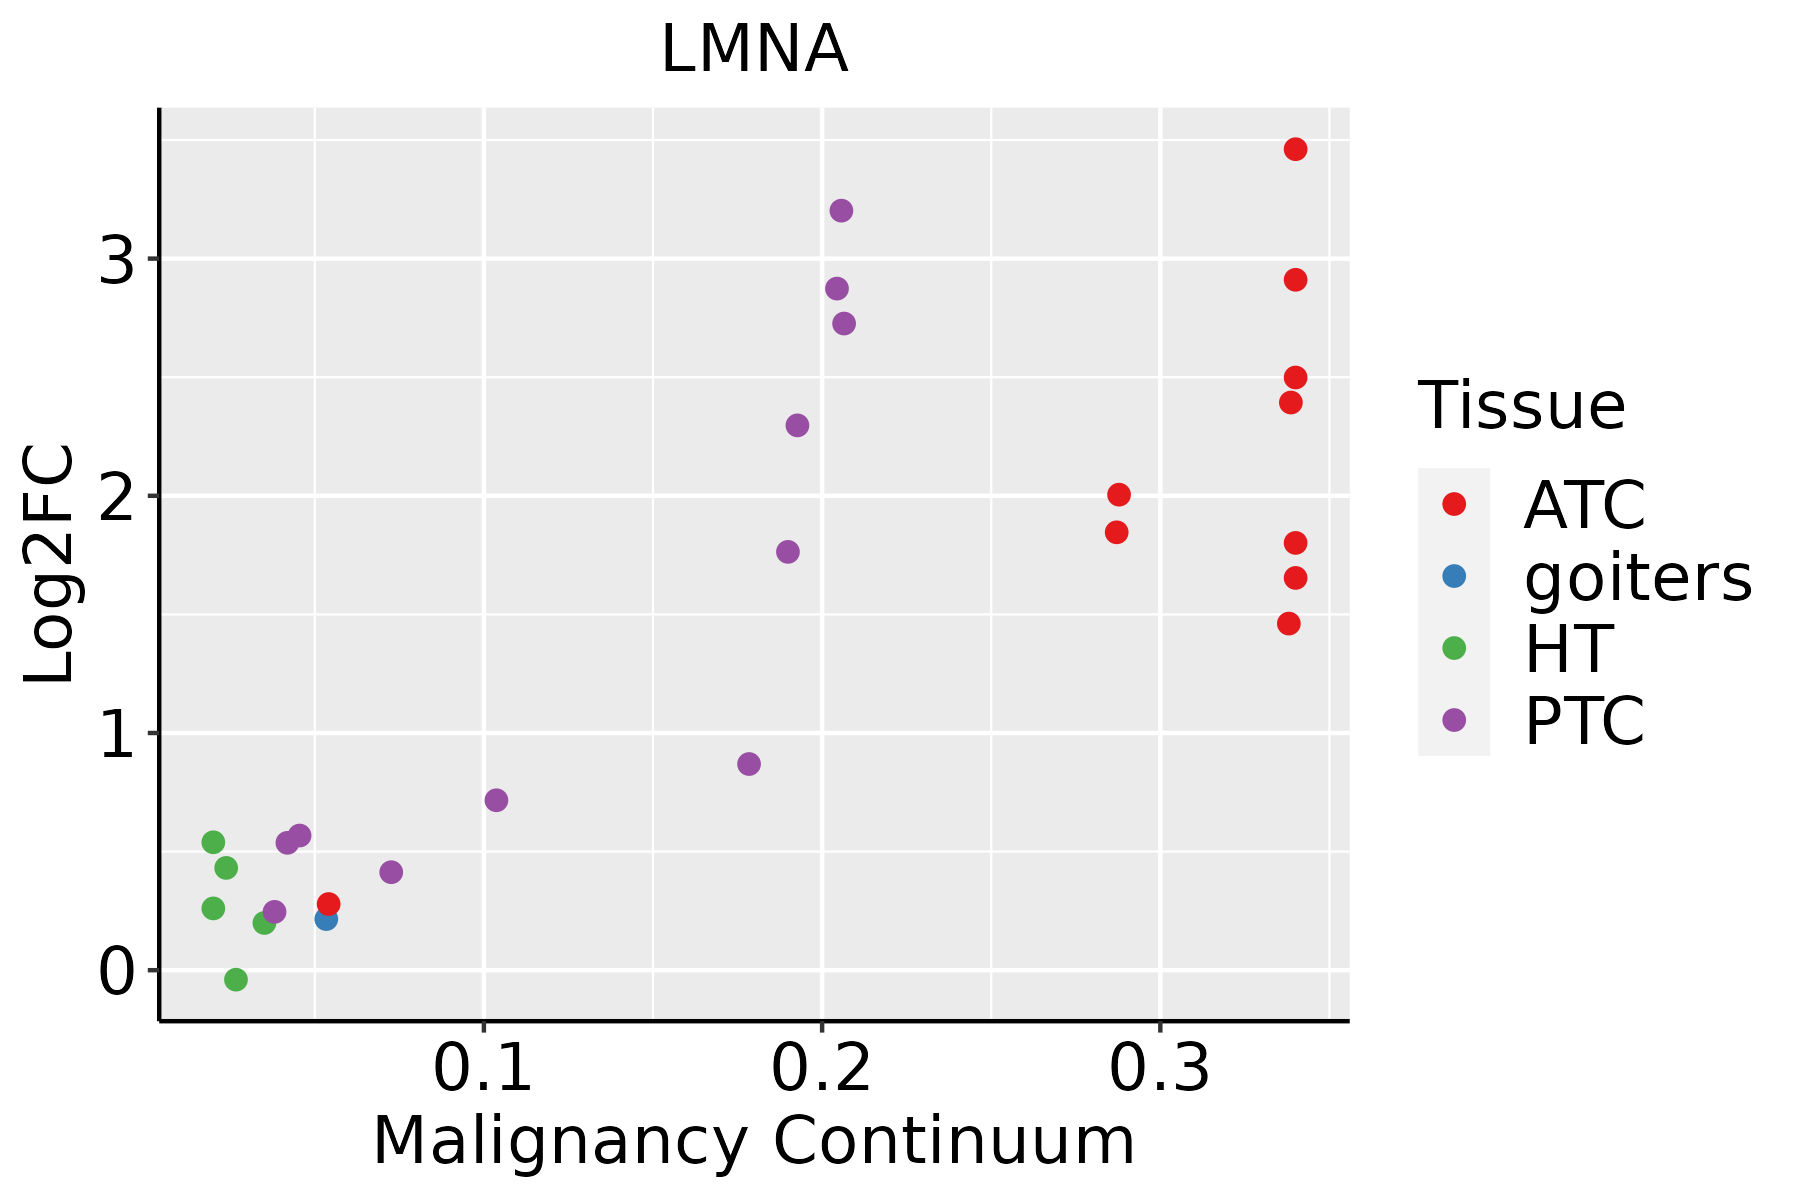 | ATC: Anaplastic thyroid cancer |
| HT: Hashimoto's thyroiditis | ||
| PTC: Papillary thyroid cancer |
| ∗log2FC in expression of this searched gene in stem-like cells from each diseased tissue sample relative to stem-like cells in normal samples in each tissue plotted against the malignancy continuum. Samples are colored based on if they are from different disease stage. |
Top |
Malignant transformation related pathway analysis |
| Find out the enriched GO biological processes and KEGG pathways involved in transition from healthy to precancer to cancer |
| Tissue | Disease Stage | Enriched GO biological Processes |
| Colorectum | AD |  |
| Colorectum | SER |  |
| Colorectum | MSS |  |
| Colorectum | MSI-H |  |
| Colorectum | FAP |  |
| ∗Top 15 enriched GO BP terms are showed in the bar plot of each disease state in each tissue. Each row represents a significant GO biological process which is colored according to the -log10(p.adjust). |
| Page: 1 2 3 4 5 6 7 8 9 |
| GO ID | Tissue | Disease Stage | Description | Gene Ratio | Bg Ratio | pvalue | p.adjust | Count |
| GO:20012339 | Breast | Precancer | regulation of apoptotic signaling pathway | 65/1080 | 356/18723 | 7.70e-17 | 3.17e-14 | 65 |
| GO:00362939 | Breast | Precancer | response to decreased oxygen levels | 53/1080 | 322/18723 | 4.09e-12 | 6.84e-10 | 53 |
| GO:00016669 | Breast | Precancer | response to hypoxia | 51/1080 | 307/18723 | 7.33e-12 | 1.11e-09 | 51 |
| GO:00704829 | Breast | Precancer | response to oxygen levels | 55/1080 | 347/18723 | 7.47e-12 | 1.11e-09 | 55 |
| GO:20012349 | Breast | Precancer | negative regulation of apoptotic signaling pathway | 39/1080 | 224/18723 | 5.35e-10 | 4.77e-08 | 39 |
| GO:00362948 | Breast | Precancer | cellular response to decreased oxygen levels | 31/1080 | 161/18723 | 2.61e-09 | 2.11e-07 | 31 |
| GO:00714538 | Breast | Precancer | cellular response to oxygen levels | 32/1080 | 177/18723 | 7.32e-09 | 5.52e-07 | 32 |
| GO:00714565 | Breast | Precancer | cellular response to hypoxia | 29/1080 | 151/18723 | 8.98e-09 | 6.50e-07 | 29 |
| GO:00086378 | Breast | Precancer | apoptotic mitochondrial changes | 23/1080 | 107/18723 | 3.44e-08 | 2.12e-06 | 23 |
| GO:00316479 | Breast | Precancer | regulation of protein stability | 38/1080 | 298/18723 | 3.73e-06 | 1.19e-04 | 38 |
| GO:00018367 | Breast | Precancer | release of cytochrome c from mitochondria | 14/1080 | 59/18723 | 4.80e-06 | 1.47e-04 | 14 |
| GO:20012369 | Breast | Precancer | regulation of extrinsic apoptotic signaling pathway | 24/1080 | 151/18723 | 5.78e-06 | 1.70e-04 | 24 |
| GO:00075688 | Breast | Precancer | aging | 41/1080 | 339/18723 | 5.95e-06 | 1.71e-04 | 41 |
| GO:00971919 | Breast | Precancer | extrinsic apoptotic signaling pathway | 30/1080 | 219/18723 | 9.42e-06 | 2.50e-04 | 30 |
| GO:20012379 | Breast | Precancer | negative regulation of extrinsic apoptotic signaling pathway | 16/1080 | 97/18723 | 1.29e-04 | 2.24e-03 | 16 |
| GO:00901996 | Breast | Precancer | regulation of release of cytochrome c from mitochondria | 10/1080 | 48/18723 | 3.43e-04 | 4.81e-03 | 10 |
| GO:00108217 | Breast | Precancer | regulation of mitochondrion organization | 19/1080 | 144/18723 | 6.26e-04 | 7.78e-03 | 19 |
| GO:00725948 | Breast | Precancer | establishment of protein localization to organelle | 41/1080 | 422/18723 | 7.75e-04 | 9.20e-03 | 41 |
| GO:00075694 | Breast | Precancer | cell aging | 17/1080 | 132/18723 | 1.55e-03 | 1.59e-02 | 17 |
| GO:00108237 | Breast | Precancer | negative regulation of mitochondrion organization | 9/1080 | 49/18723 | 1.74e-03 | 1.74e-02 | 9 |
| Page: 1 2 3 4 5 6 7 8 9 10 11 12 13 14 15 16 17 18 19 20 21 22 23 24 25 26 27 28 29 30 31 32 33 34 35 36 37 38 39 40 41 42 43 44 45 46 47 48 49 50 51 52 53 54 55 56 57 58 |
| Pathway ID | Tissue | Disease Stage | Description | Gene Ratio | Bg Ratio | pvalue | p.adjust | qvalue | Count |
| hsa042108 | Breast | Precancer | Apoptosis | 25/684 | 136/8465 | 7.61e-05 | 6.87e-04 | 5.26e-04 | 25 |
| hsa0421013 | Breast | Precancer | Apoptosis | 25/684 | 136/8465 | 7.61e-05 | 6.87e-04 | 5.26e-04 | 25 |
| hsa0421022 | Breast | IDC | Apoptosis | 31/867 | 136/8465 | 1.34e-05 | 1.61e-04 | 1.20e-04 | 31 |
| hsa0421032 | Breast | IDC | Apoptosis | 31/867 | 136/8465 | 1.34e-05 | 1.61e-04 | 1.20e-04 | 31 |
| hsa0421041 | Breast | DCIS | Apoptosis | 29/846 | 136/8465 | 5.92e-05 | 5.97e-04 | 4.40e-04 | 29 |
| hsa0421051 | Breast | DCIS | Apoptosis | 29/846 | 136/8465 | 5.92e-05 | 5.97e-04 | 4.40e-04 | 29 |
| hsa042109 | Cervix | CC | Apoptosis | 36/1267 | 136/8465 | 3.21e-04 | 1.68e-03 | 9.91e-04 | 36 |
| hsa0421014 | Cervix | CC | Apoptosis | 36/1267 | 136/8465 | 3.21e-04 | 1.68e-03 | 9.91e-04 | 36 |
| hsa0421023 | Cervix | HSIL_HPV | Apoptosis | 16/459 | 136/8465 | 2.74e-03 | 1.78e-02 | 1.44e-02 | 16 |
| hsa054127 | Cervix | HSIL_HPV | Arrhythmogenic right ventricular cardiomyopathy | 10/459 | 77/8465 | 8.34e-03 | 4.70e-02 | 3.80e-02 | 10 |
| hsa0421033 | Cervix | HSIL_HPV | Apoptosis | 16/459 | 136/8465 | 2.74e-03 | 1.78e-02 | 1.44e-02 | 16 |
| hsa0541212 | Cervix | HSIL_HPV | Arrhythmogenic right ventricular cardiomyopathy | 10/459 | 77/8465 | 8.34e-03 | 4.70e-02 | 3.80e-02 | 10 |
| hsa04210 | Colorectum | MSS | Apoptosis | 44/1875 | 136/8465 | 3.66e-03 | 1.66e-02 | 1.01e-02 | 44 |
| hsa042101 | Colorectum | MSS | Apoptosis | 44/1875 | 136/8465 | 3.66e-03 | 1.66e-02 | 1.01e-02 | 44 |
| hsa05412 | Colorectum | FAP | Arrhythmogenic right ventricular cardiomyopathy | 23/1404 | 77/8465 | 2.58e-03 | 1.19e-02 | 7.23e-03 | 23 |
| hsa054121 | Colorectum | FAP | Arrhythmogenic right ventricular cardiomyopathy | 23/1404 | 77/8465 | 2.58e-03 | 1.19e-02 | 7.23e-03 | 23 |
| hsa0421020 | Esophagus | HGIN | Apoptosis | 36/1383 | 136/8465 | 1.67e-03 | 1.52e-02 | 1.20e-02 | 36 |
| hsa04210110 | Esophagus | HGIN | Apoptosis | 36/1383 | 136/8465 | 1.67e-03 | 1.52e-02 | 1.20e-02 | 36 |
| hsa0421027 | Esophagus | ESCC | Apoptosis | 102/4205 | 136/8465 | 1.05e-09 | 1.21e-08 | 6.21e-09 | 102 |
| hsa0421037 | Esophagus | ESCC | Apoptosis | 102/4205 | 136/8465 | 1.05e-09 | 1.21e-08 | 6.21e-09 | 102 |
| Page: 1 2 3 |
Top |
Cell-cell communication analysis |
| Identification of potential cell-cell interactions between two cell types and their ligand-receptor pairs for different disease states |
| Ligand | Receptor | LRpair | Pathway | Tissue | Disease Stage |
| Page: 1 |
Top |
Single-cell gene regulatory network inference analysis |
| Find out the significant the regulons (TFs) and the target genes of each regulon across cell types for different disease states |
| TF | Cell Type | Tissue | Disease Stage | Target Gene | RSS | Regulon Activity |
| ∗The dot plots of a searched regulon are shown for all cell subpopulations in each disease state of each tissue based on the regulon specific score inferred using pySCENIC and by calculating the average expression. |
| Page: 1 |
Top |
Somatic mutation of malignant transformation related genes |
| Annotation of somatic variants for genes involved in malignant transformation |
| Hugo Symbol | Variant Class | Variant Classification | dbSNP RS | HGVSc | HGVSp | HGVSp Short | SWISSPROT | BIOTYPE | SIFT | PolyPhen | Tumor Sample Barcode | Tissue | Histology | Sex | Age | Stage | Therapy Types | Drugs | Outcome |
| LMNA | SNV | Missense_Mutation | novel | c.1700N>T | p.Gly567Val | p.G567V | P02545 | protein_coding | tolerated(0.28) | benign(0.272) | TCGA-A2-A4RX-01 | Breast | breast invasive carcinoma | Female | >=65 | I/II | Unknown | Unknown | SD |
| LMNA | SNV | Missense_Mutation | novel | c.1660N>A | p.Glu554Lys | p.E554K | P02545 | protein_coding | deleterious(0.01) | benign(0.132) | TCGA-E2-A15P-01 | Breast | breast invasive carcinoma | Female | <65 | I/II | Hormone Therapy | arimidex | SD |
| LMNA | SNV | Missense_Mutation | rs267607571 | c.569N>A | p.Arg190Gln | p.R190Q | P02545 | protein_coding | deleterious(0) | probably_damaging(0.998) | TCGA-E2-A1L8-01 | Breast | breast invasive carcinoma | Female | <65 | I/II | Chemotherapy | cyclophosphamide | SD |
| LMNA | SNV | Missense_Mutation | rs794728602 | c.250N>A | p.Glu84Lys | p.E84K | P02545 | protein_coding | deleterious(0) | probably_damaging(0.981) | TCGA-GM-A2D9-01 | Breast | breast invasive carcinoma | Female | >=65 | I/II | Hormone Therapy | arimidex | SD |
| LMNA | SNV | Missense_Mutation | novel | c.1498N>T | p.Ala500Ser | p.A500S | P02545 | protein_coding | tolerated(0.53) | benign(0.006) | TCGA-PE-A5DD-01 | Breast | breast invasive carcinoma | Female | <65 | I/II | Chemotherapy | CR | |
| LMNA | SNV | Missense_Mutation | rs397517912 | c.868N>A | p.Glu290Lys | p.E290K | P02545 | protein_coding | deleterious(0) | probably_damaging(0.953) | TCGA-VS-A9UD-01 | Cervix | cervical & endocervical cancer | Female | >=65 | III/IV | Chemotherapy | cisplatin | CR |
| LMNA | SNV | Missense_Mutation | rs760743233 | c.466C>T | p.Arg156Cys | p.R156C | P02545 | protein_coding | deleterious(0) | benign(0.381) | TCGA-AA-A00N-01 | Colorectum | colon adenocarcinoma | Male | >=65 | I/II | Unknown | Unknown | PD |
| LMNA | SNV | Missense_Mutation | rs397517913 | c.986N>A | p.Arg329His | p.R329H | P02545 | protein_coding | tolerated(0.13) | benign(0.111) | TCGA-D5-6530-01 | Colorectum | colon adenocarcinoma | Male | <65 | I/II | Unknown | Unknown | SD |
| LMNA | SNV | Missense_Mutation | rs397517895 | c.154N>G | p.Leu52Val | p.L52V | P02545 | protein_coding | deleterious(0) | probably_damaging(0.986) | TCGA-G4-6302-01 | Colorectum | colon adenocarcinoma | Female | >=65 | I/II | Unknown | Unknown | SD |
| LMNA | SNV | Missense_Mutation | rs200466188 | c.1487N>T | p.Thr496Met | p.T496M | P02545 | protein_coding | deleterious(0) | probably_damaging(1) | TCGA-AG-3731-01 | Colorectum | rectum adenocarcinoma | Male | >=65 | III/IV | Chemotherapy | folinic | PR |
| Page: 1 2 3 4 5 6 |
Top |
Related drugs of malignant transformation related genes |
| Identification of chemicals and drugs interact with genes involved in malignant transfromation |
| (DGIdb 4.0) |
| Entrez ID | Symbol | Category | Interaction Types | Drug Claim Name | Drug Name | PMIDs |
| 4000 | LMNA | CLINICALLY ACTIONABLE, DRUGGABLE GENOME | HISTAMINE | HISTAMINE | ||
| 4000 | LMNA | CLINICALLY ACTIONABLE, DRUGGABLE GENOME | SU-4312 | CHEMBL328710 |
| Page: 1 |

Copyright 2023-Present -The University of Texas Health Science Center at Houston |