
|
|||||
|
 | |
| |
| |
| |
| |
| |
|
Gene: LMCD1 |
Gene summary for LMCD1 |
| Gene information | Species | Human | Gene symbol | LMCD1 | Gene ID | 29995 |
| Gene name | LIM and cysteine rich domains 1 | |
| Gene Alias | LMCD1 | |
| Cytomap | 3p25.3 | |
| Gene Type | protein-coding | GO ID | GO:0000122 | UniProtAcc | Q9NZU5 |
Top |
Malignant transformation analysis |
| Identification of the aberrant gene expression in precancerous and cancerous lesions by comparing the gene expression of stem-like cells in diseased tissues with normal stem cells |
| Entrez ID | Symbol | Replicates | Species | Organ | Tissue | Adj P-value | Log2FC | Malignancy |
| 29995 | LMCD1 | P2T-E | Human | Esophagus | ESCC | 2.78e-03 | 6.64e-02 | 0.1177 |
| 29995 | LMCD1 | P4T-E | Human | Esophagus | ESCC | 3.45e-07 | 3.15e-01 | 0.1323 |
| 29995 | LMCD1 | P5T-E | Human | Esophagus | ESCC | 1.14e-05 | 2.61e-01 | 0.1327 |
| 29995 | LMCD1 | P8T-E | Human | Esophagus | ESCC | 5.14e-12 | 2.39e-01 | 0.0889 |
| 29995 | LMCD1 | P9T-E | Human | Esophagus | ESCC | 1.27e-04 | 4.54e-01 | 0.1131 |
| 29995 | LMCD1 | P10T-E | Human | Esophagus | ESCC | 9.92e-28 | 5.14e-01 | 0.116 |
| 29995 | LMCD1 | P15T-E | Human | Esophagus | ESCC | 7.19e-06 | 2.89e-01 | 0.1149 |
| 29995 | LMCD1 | P21T-E | Human | Esophagus | ESCC | 4.72e-02 | 1.06e-01 | 0.1617 |
| 29995 | LMCD1 | P22T-E | Human | Esophagus | ESCC | 3.62e-07 | 2.69e-01 | 0.1236 |
| 29995 | LMCD1 | P23T-E | Human | Esophagus | ESCC | 5.88e-15 | 8.54e-01 | 0.108 |
| 29995 | LMCD1 | P24T-E | Human | Esophagus | ESCC | 8.48e-08 | 3.98e-01 | 0.1287 |
| 29995 | LMCD1 | P31T-E | Human | Esophagus | ESCC | 2.74e-07 | 2.58e-01 | 0.1251 |
| 29995 | LMCD1 | P32T-E | Human | Esophagus | ESCC | 1.96e-03 | 2.38e-01 | 0.1666 |
| 29995 | LMCD1 | P36T-E | Human | Esophagus | ESCC | 3.78e-03 | 3.06e-01 | 0.1187 |
| 29995 | LMCD1 | P37T-E | Human | Esophagus | ESCC | 9.24e-03 | 2.34e-01 | 0.1371 |
| 29995 | LMCD1 | P40T-E | Human | Esophagus | ESCC | 5.02e-11 | 3.08e-01 | 0.109 |
| 29995 | LMCD1 | P42T-E | Human | Esophagus | ESCC | 1.48e-03 | 4.12e-01 | 0.1175 |
| 29995 | LMCD1 | P44T-E | Human | Esophagus | ESCC | 2.76e-07 | 5.87e-01 | 0.1096 |
| 29995 | LMCD1 | P48T-E | Human | Esophagus | ESCC | 4.90e-02 | 1.43e-01 | 0.0959 |
| 29995 | LMCD1 | P52T-E | Human | Esophagus | ESCC | 4.62e-02 | -5.25e-02 | 0.1555 |
| Page: 1 2 3 |
| Tissue | Expression Dynamics | Abbreviation |
| Esophagus | 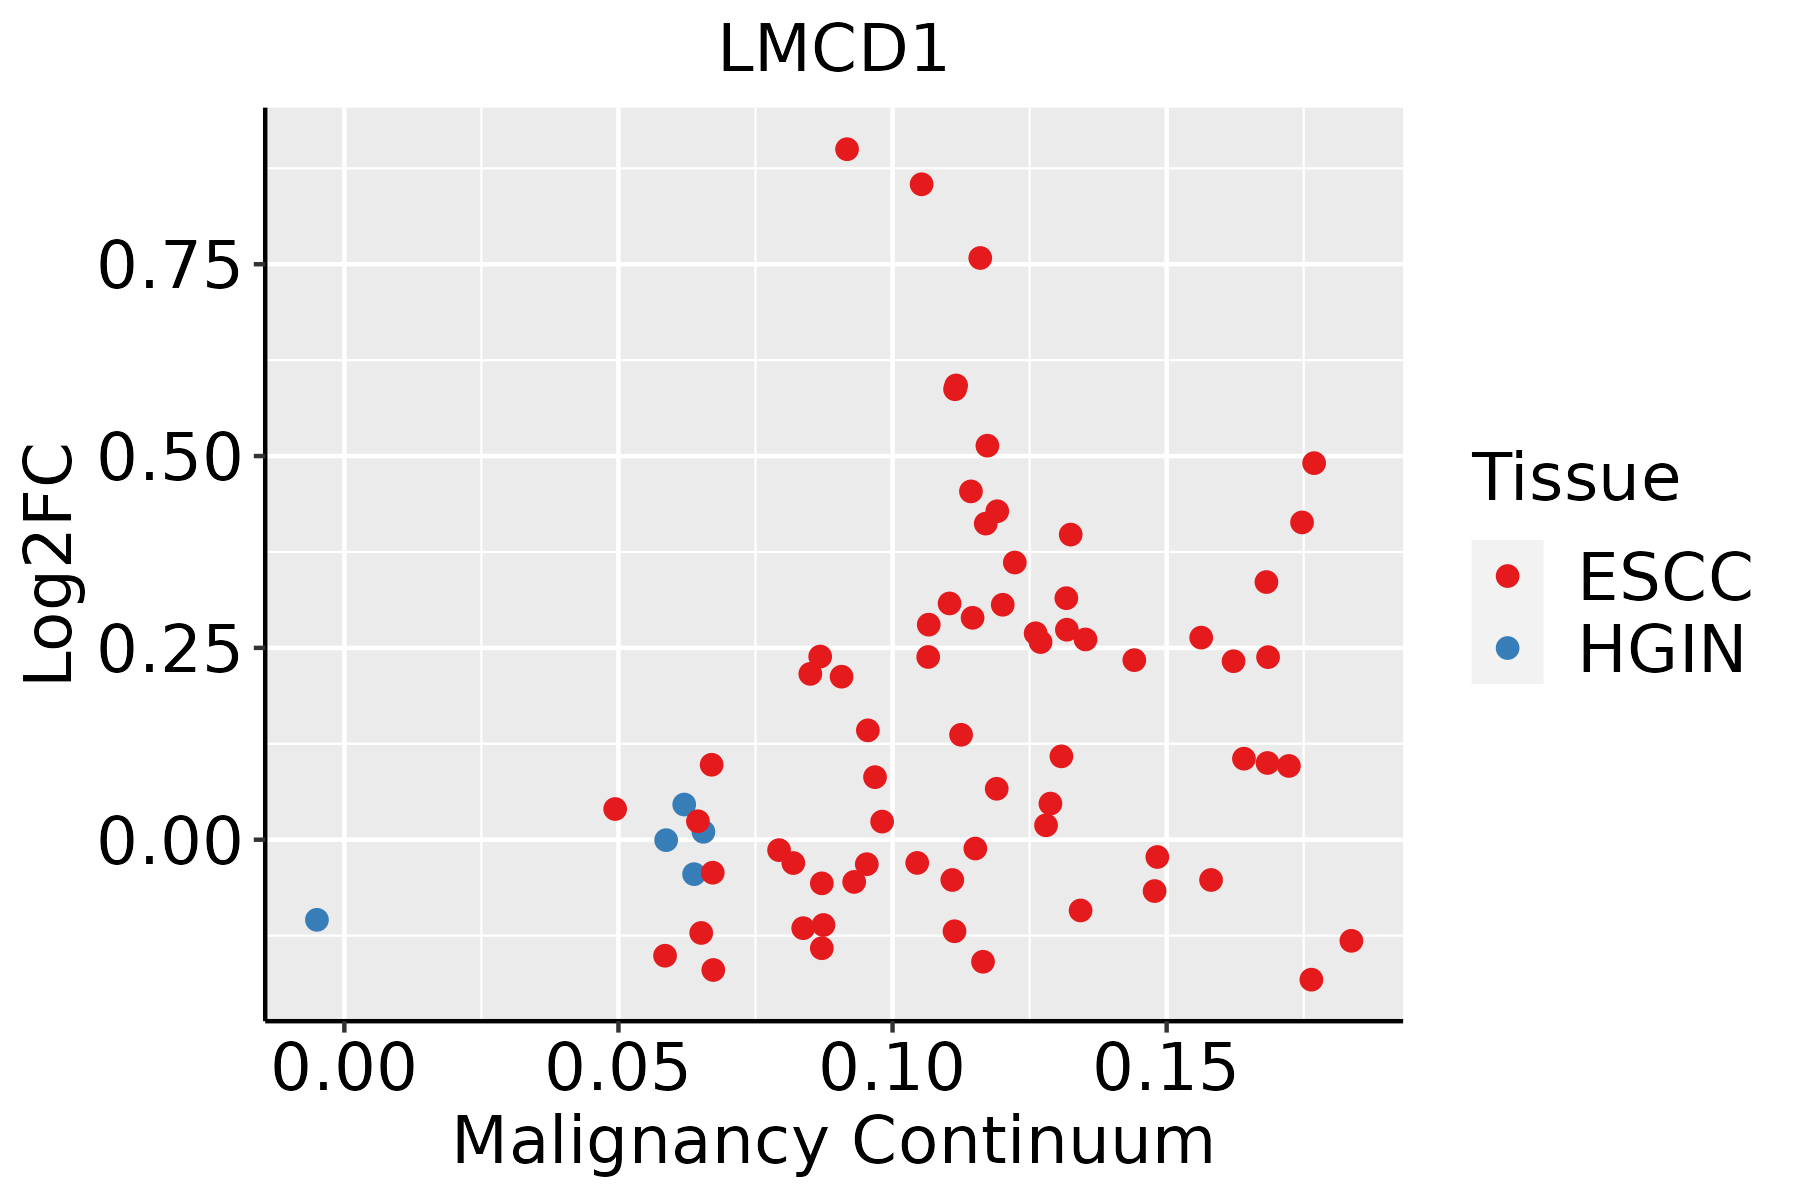 | ESCC: Esophageal squamous cell carcinoma |
| HGIN: High-grade intraepithelial neoplasias | ||
| LGIN: Low-grade intraepithelial neoplasias | ||
| Liver | 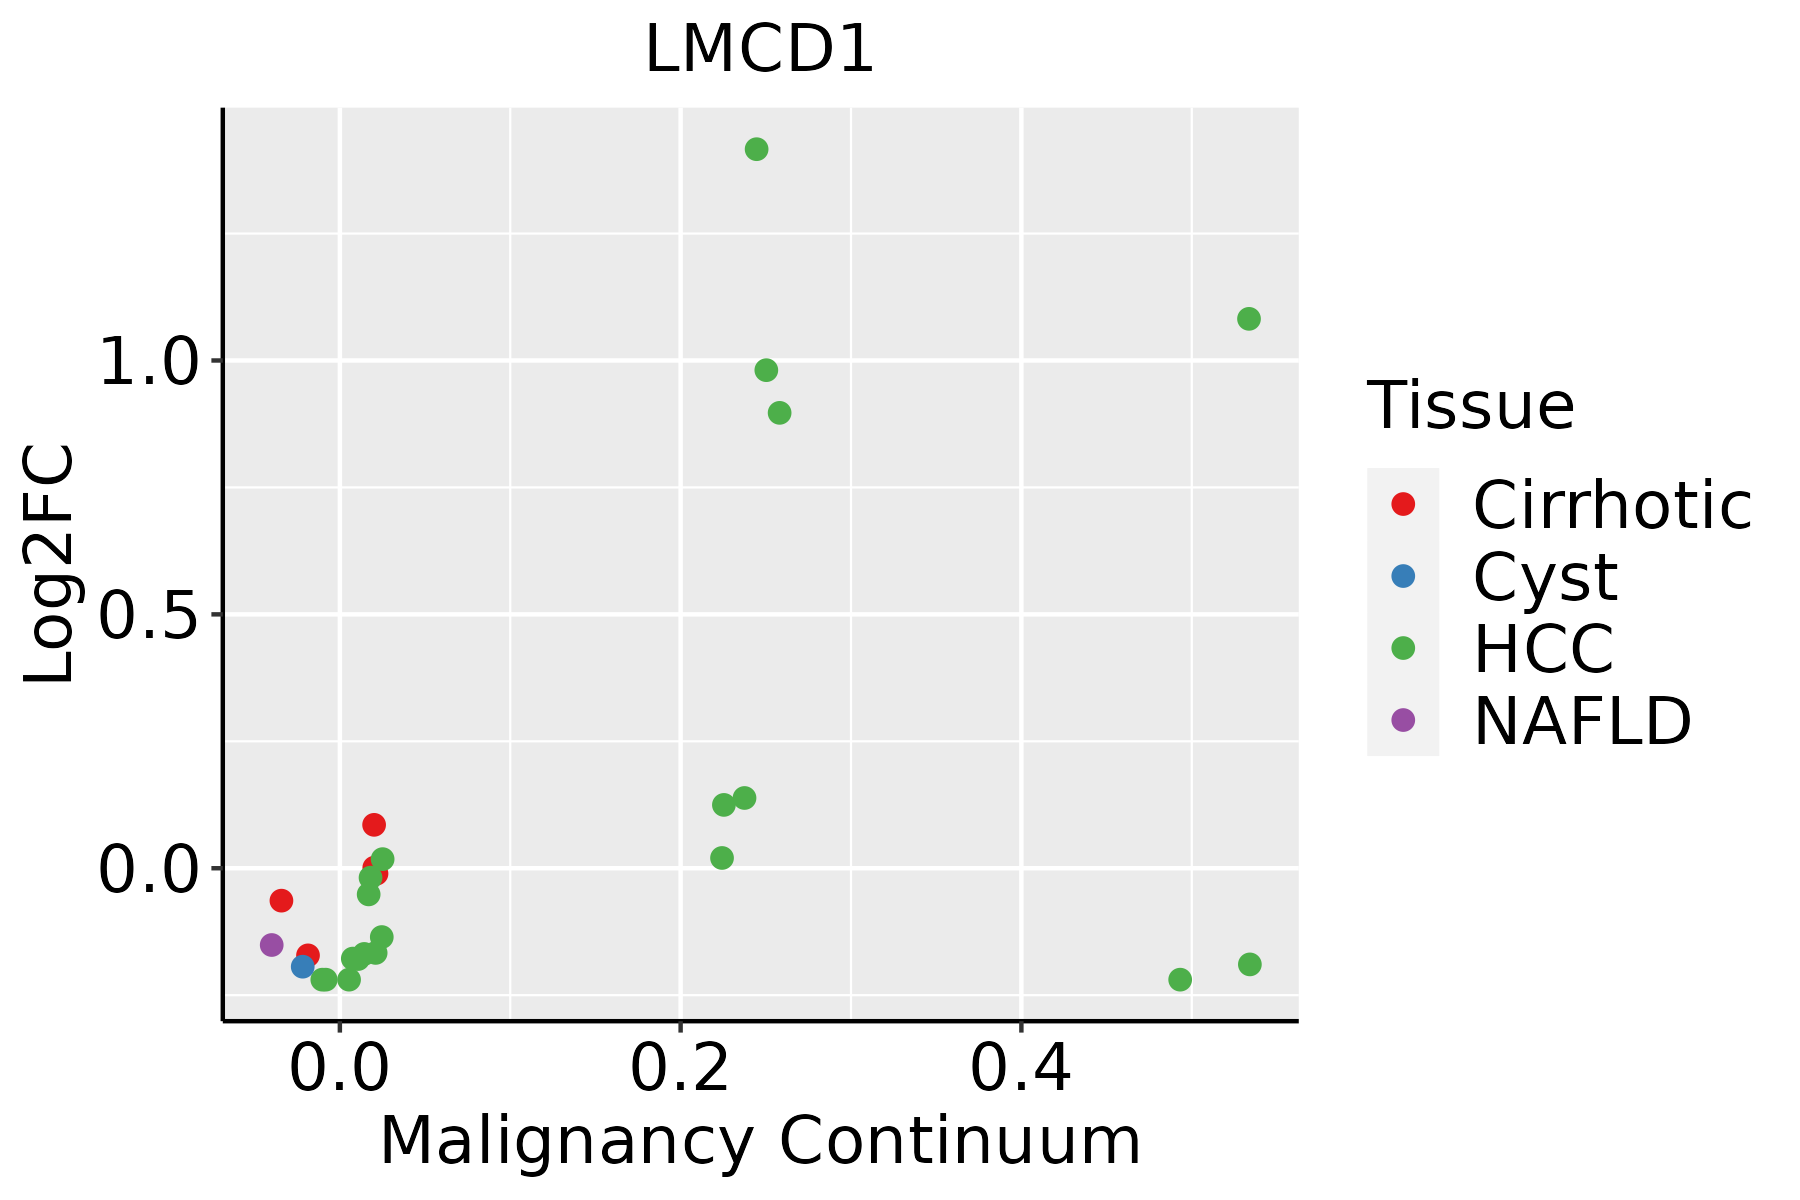 | HCC: Hepatocellular carcinoma |
| NAFLD: Non-alcoholic fatty liver disease | ||
| Skin | 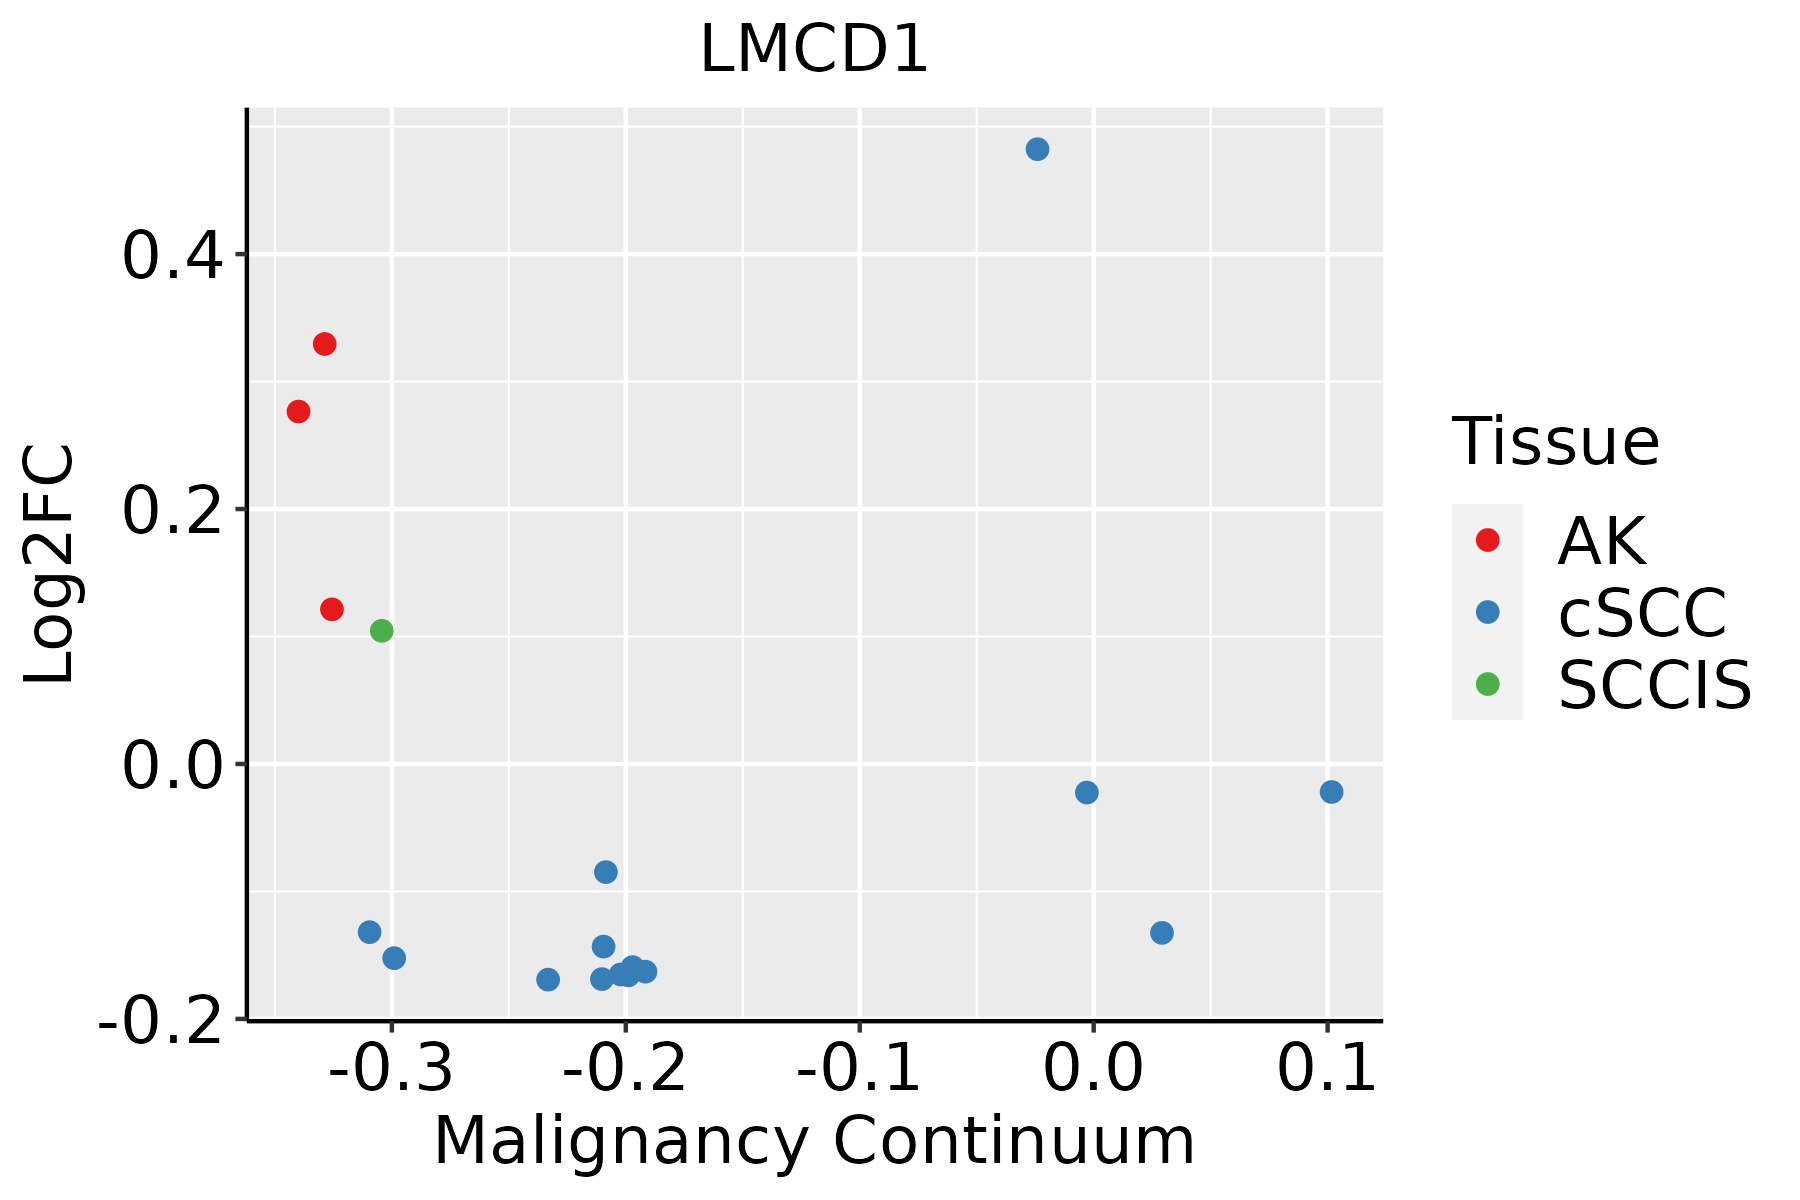 | AK: Actinic keratosis |
| cSCC: Cutaneous squamous cell carcinoma | ||
| SCCIS:squamous cell carcinoma in situ | ||
| Thyroid | 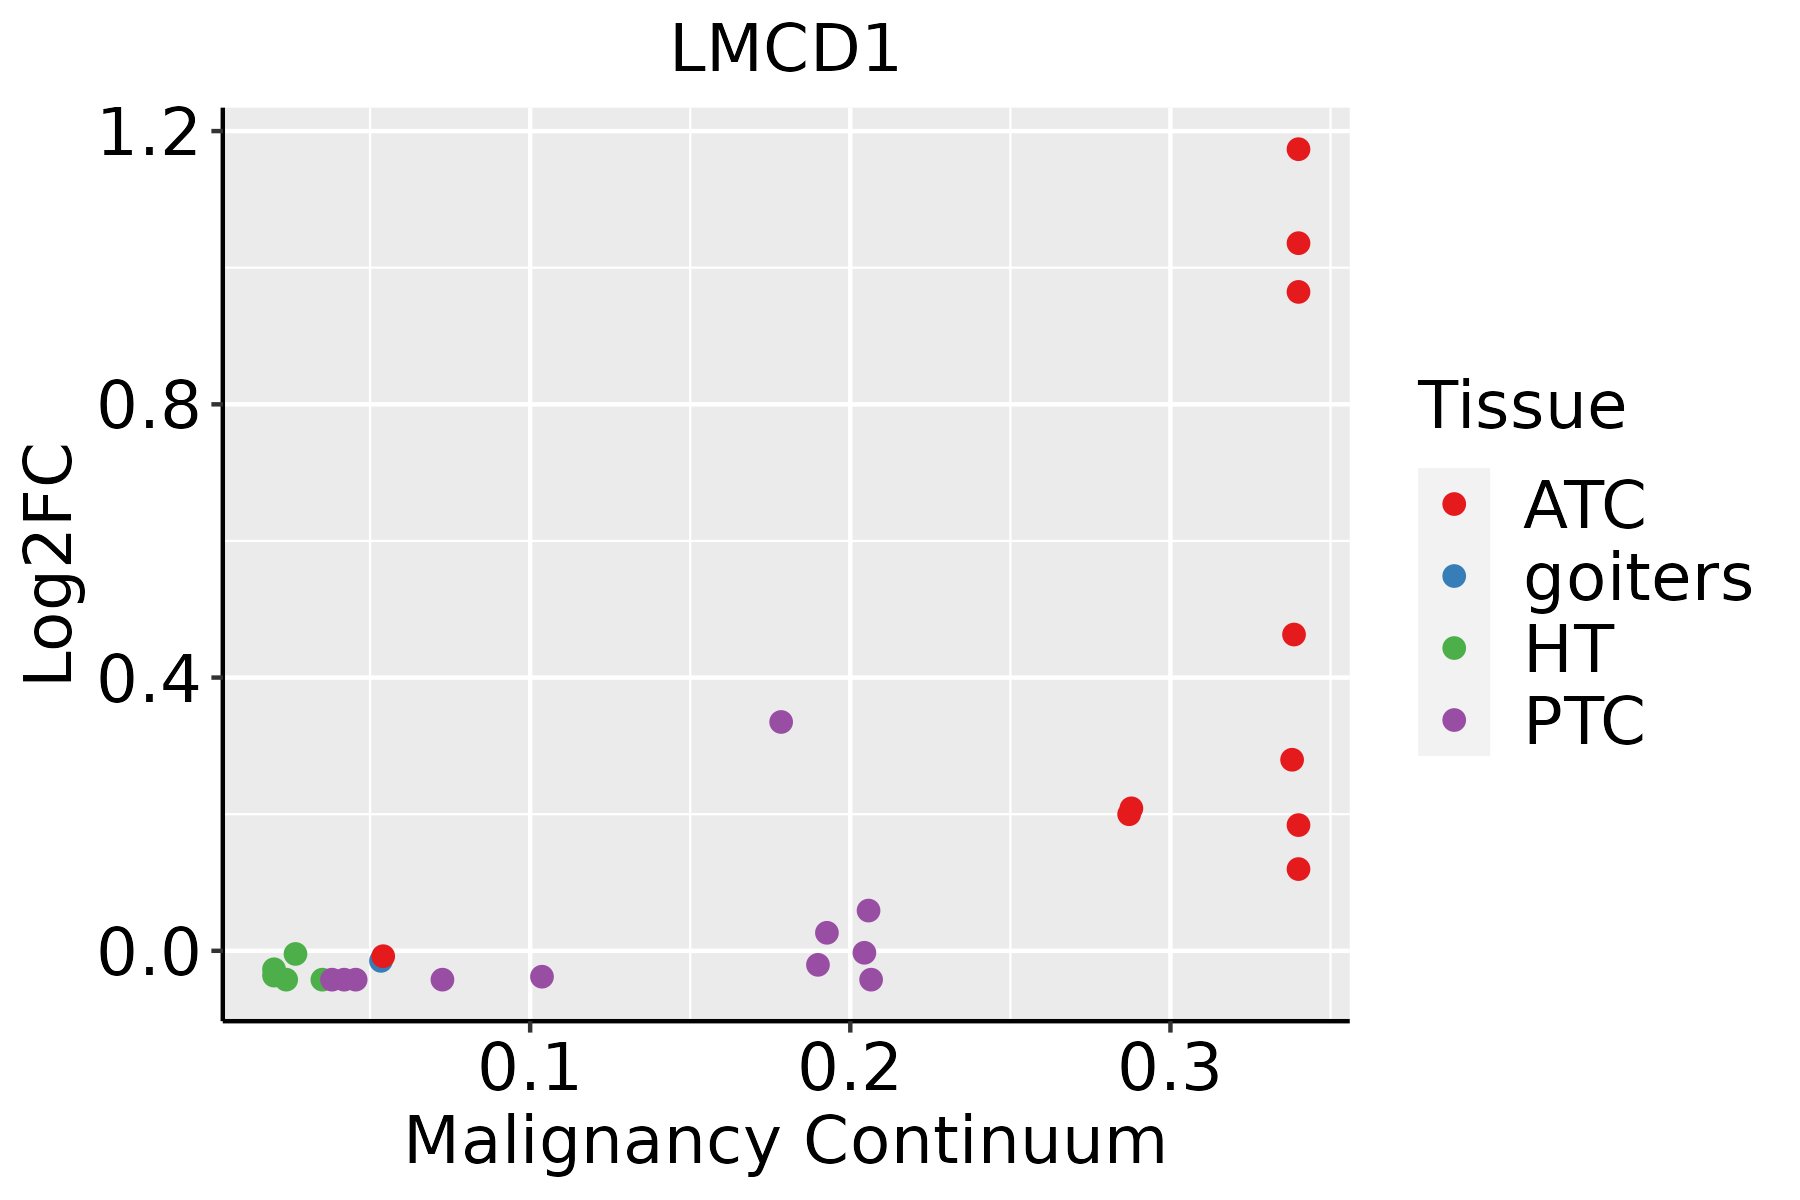 | ATC: Anaplastic thyroid cancer |
| HT: Hashimoto's thyroiditis | ||
| PTC: Papillary thyroid cancer |
| ∗log2FC in expression of this searched gene in stem-like cells from each diseased tissue sample relative to stem-like cells in normal samples in each tissue plotted against the malignancy continuum. Samples are colored based on if they are from different disease stage. |
Top |
Malignant transformation related pathway analysis |
| Find out the enriched GO biological processes and KEGG pathways involved in transition from healthy to precancer to cancer |
| Tissue | Disease Stage | Enriched GO biological Processes |
| Colorectum | AD |  |
| Colorectum | SER |  |
| Colorectum | MSS |  |
| Colorectum | MSI-H |  |
| Colorectum | FAP |  |
| ∗Top 15 enriched GO BP terms are showed in the bar plot of each disease state in each tissue. Each row represents a significant GO biological process which is colored according to the -log10(p.adjust). |
| Page: 1 2 3 4 5 6 7 8 9 |
| GO ID | Tissue | Disease Stage | Description | Gene Ratio | Bg Ratio | pvalue | p.adjust | Count |
| GO:00106111 | Liver | Cirrhotic | regulation of cardiac muscle hypertrophy | 27/4634 | 69/18723 | 5.74e-03 | 2.88e-02 | 27 |
| GO:0014743 | Liver | Cirrhotic | regulation of muscle hypertrophy | 27/4634 | 72/18723 | 1.10e-02 | 4.81e-02 | 27 |
| GO:00148965 | Skin | AK | muscle hypertrophy | 21/1910 | 104/18723 | 1.70e-03 | 1.20e-02 | 21 |
| GO:00148974 | Skin | AK | striated muscle hypertrophy | 20/1910 | 102/18723 | 3.10e-03 | 1.93e-02 | 20 |
| GO:00030129 | Skin | AK | muscle system process | 64/1910 | 452/18723 | 4.32e-03 | 2.52e-02 | 64 |
| GO:00033005 | Skin | AK | cardiac muscle hypertrophy | 19/1910 | 99/18723 | 4.96e-03 | 2.79e-02 | 19 |
| GO:00147433 | Skin | AK | regulation of muscle hypertrophy | 15/1910 | 72/18723 | 5.43e-03 | 3.01e-02 | 15 |
| GO:00106113 | Skin | AK | regulation of cardiac muscle hypertrophy | 14/1910 | 69/18723 | 9.00e-03 | 4.42e-02 | 14 |
| GO:009025714 | Skin | AK | regulation of muscle system process | 38/1910 | 252/18723 | 9.21e-03 | 4.52e-02 | 38 |
| GO:00435026 | Skin | AK | regulation of muscle adaptation | 18/1910 | 98/18723 | 9.72e-03 | 4.72e-02 | 18 |
| GO:001489613 | Skin | SCCIS | muscle hypertrophy | 14/919 | 104/18723 | 5.54e-04 | 8.47e-03 | 14 |
| GO:001489712 | Skin | SCCIS | striated muscle hypertrophy | 13/919 | 102/18723 | 1.44e-03 | 1.63e-02 | 13 |
| GO:000330012 | Skin | SCCIS | cardiac muscle hypertrophy | 12/919 | 99/18723 | 3.31e-03 | 2.97e-02 | 12 |
| GO:00331734 | Skin | SCCIS | calcineurin-NFAT signaling cascade | 7/919 | 43/18723 | 4.60e-03 | 3.82e-02 | 7 |
| GO:00480165 | Skin | SCCIS | inositol phosphate-mediated signaling | 8/919 | 55/18723 | 5.13e-03 | 4.12e-02 | 8 |
| GO:00708844 | Skin | SCCIS | regulation of calcineurin-NFAT signaling cascade | 6/919 | 34/18723 | 5.69e-03 | 4.44e-02 | 6 |
| GO:01060563 | Skin | SCCIS | regulation of calcineurin-mediated signaling | 6/919 | 35/18723 | 6.58e-03 | 4.89e-02 | 6 |
| GO:00508483 | Thyroid | ATC | regulation of calcium-mediated signaling | 36/6293 | 73/18723 | 3.91e-03 | 1.70e-02 | 36 |
| Page: 1 |
| Pathway ID | Tissue | Disease Stage | Description | Gene Ratio | Bg Ratio | pvalue | p.adjust | qvalue | Count |
| Page: 1 |
Top |
Cell-cell communication analysis |
| Identification of potential cell-cell interactions between two cell types and their ligand-receptor pairs for different disease states |
| Ligand | Receptor | LRpair | Pathway | Tissue | Disease Stage |
| Page: 1 |
Top |
Single-cell gene regulatory network inference analysis |
| Find out the significant the regulons (TFs) and the target genes of each regulon across cell types for different disease states |
| TF | Cell Type | Tissue | Disease Stage | Target Gene | RSS | Regulon Activity |
| ∗The dot plots of a searched regulon are shown for all cell subpopulations in each disease state of each tissue based on the regulon specific score inferred using pySCENIC and by calculating the average expression. |
| Page: 1 |
Top |
Somatic mutation of malignant transformation related genes |
| Annotation of somatic variants for genes involved in malignant transformation |
| Hugo Symbol | Variant Class | Variant Classification | dbSNP RS | HGVSc | HGVSp | HGVSp Short | SWISSPROT | BIOTYPE | SIFT | PolyPhen | Tumor Sample Barcode | Tissue | Histology | Sex | Age | Stage | Therapy Types | Drugs | Outcome |
| LMCD1 | SNV | Missense_Mutation | novel | c.1046T>C | p.Val349Ala | p.V349A | Q9NZU5 | protein_coding | deleterious(0.01) | benign(0.055) | TCGA-A2-A3KD-01 | Breast | breast invasive carcinoma | Female | <65 | III/IV | Chemotherapy | taxotere | SD |
| LMCD1 | SNV | Missense_Mutation | c.232N>C | p.Tyr78His | p.Y78H | Q9NZU5 | protein_coding | tolerated(0.05) | possibly_damaging(0.641) | TCGA-A7-A4SF-01 | Breast | breast invasive carcinoma | Female | <65 | I/II | Chemotherapy | carboplatin | CR | |
| LMCD1 | SNV | Missense_Mutation | rs772016331 | c.1040N>G | p.Tyr347Cys | p.Y347C | Q9NZU5 | protein_coding | deleterious(0) | probably_damaging(0.977) | TCGA-BH-A18G-01 | Breast | breast invasive carcinoma | Female | >=65 | I/II | Unknown | Unknown | SD |
| LMCD1 | insertion | Frame_Shift_Ins | novel | c.714_715insACTAT | p.Val239ThrfsTer78 | p.V239Tfs*78 | Q9NZU5 | protein_coding | TCGA-AR-A0U0-01 | Breast | breast invasive carcinoma | Female | >=65 | I/II | Unknown | Unknown | SD | ||
| LMCD1 | deletion | Frame_Shift_Del | novel | c.836delN | p.Glu280SerfsTer35 | p.E280Sfs*35 | Q9NZU5 | protein_coding | TCGA-D8-A27V-01 | Breast | breast invasive carcinoma | Female | <65 | I/II | Hormone Therapy | tamoxiphen | SD | ||
| LMCD1 | SNV | Missense_Mutation | c.532N>C | p.Glu178Gln | p.E178Q | Q9NZU5 | protein_coding | deleterious(0) | probably_damaging(0.999) | TCGA-IR-A3LH-01 | Cervix | cervical & endocervical cancer | Female | <65 | I/II | Chemotherapy | cisplatin | CR | |
| LMCD1 | SNV | Missense_Mutation | c.689N>A | p.Gly230Asp | p.G230D | Q9NZU5 | protein_coding | deleterious(0.01) | probably_damaging(0.999) | TCGA-AA-3864-01 | Colorectum | colon adenocarcinoma | Male | >=65 | I/II | Unknown | Unknown | SD | |
| LMCD1 | SNV | Missense_Mutation | rs752204449 | c.746C>T | p.Ala249Val | p.A249V | Q9NZU5 | protein_coding | tolerated(0.33) | benign(0) | TCGA-AA-3949-01 | Colorectum | colon adenocarcinoma | Female | >=65 | III/IV | Unknown | Unknown | SD |
| LMCD1 | SNV | Missense_Mutation | c.122N>C | p.His41Pro | p.H41P | Q9NZU5 | protein_coding | deleterious(0) | probably_damaging(0.998) | TCGA-AA-A00N-01 | Colorectum | colon adenocarcinoma | Male | >=65 | I/II | Unknown | Unknown | PD | |
| LMCD1 | SNV | Missense_Mutation | rs750515160 | c.464N>A | p.Arg155His | p.R155H | Q9NZU5 | protein_coding | deleterious(0.03) | probably_damaging(0.989) | TCGA-AZ-4315-01 | Colorectum | colon adenocarcinoma | Male | <65 | I/II | Unknown | Unknown | SD |
| Page: 1 2 3 4 5 |
Top |
Related drugs of malignant transformation related genes |
| Identification of chemicals and drugs interact with genes involved in malignant transfromation |
| (DGIdb 4.0) |
| Entrez ID | Symbol | Category | Interaction Types | Drug Claim Name | Drug Name | PMIDs |
| Page: 1 |

Copyright 2023-Present -The University of Texas Health Science Center at Houston |