
|
|||||
|
 | |
| |
| |
| |
| |
| |
|
Gene: LMBRD1 |
Gene summary for LMBRD1 |
| Gene information | Species | Human | Gene symbol | LMBRD1 | Gene ID | 55788 |
| Gene name | LMBR1 domain containing 1 | |
| Gene Alias | C6orf209 | |
| Cytomap | 6q13 | |
| Gene Type | protein-coding | GO ID | GO:0006725 | UniProtAcc | Q9NUN5 |
Top |
Malignant transformation analysis |
| Identification of the aberrant gene expression in precancerous and cancerous lesions by comparing the gene expression of stem-like cells in diseased tissues with normal stem cells |
| Entrez ID | Symbol | Replicates | Species | Organ | Tissue | Adj P-value | Log2FC | Malignancy |
| 55788 | LMBRD1 | HTA11_3410_2000001011 | Human | Colorectum | AD | 1.26e-08 | -4.68e-01 | 0.0155 |
| 55788 | LMBRD1 | HTA11_696_2000001011 | Human | Colorectum | AD | 8.19e-06 | -3.41e-01 | -0.1464 |
| 55788 | LMBRD1 | HTA11_866_3004761011 | Human | Colorectum | AD | 1.15e-03 | -3.75e-01 | 0.096 |
| 55788 | LMBRD1 | HTA11_7696_3000711011 | Human | Colorectum | AD | 6.52e-05 | -3.71e-01 | 0.0674 |
| 55788 | LMBRD1 | HTA11_99999974143_84620 | Human | Colorectum | MSS | 3.18e-08 | -3.87e-01 | 0.3005 |
| 55788 | LMBRD1 | A002-C-010 | Human | Colorectum | FAP | 5.84e-06 | -2.36e-01 | 0.242 |
| 55788 | LMBRD1 | A001-C-207 | Human | Colorectum | FAP | 3.84e-05 | -3.98e-01 | 0.1278 |
| 55788 | LMBRD1 | A015-C-203 | Human | Colorectum | FAP | 1.98e-23 | -4.71e-01 | -0.1294 |
| 55788 | LMBRD1 | A015-C-204 | Human | Colorectum | FAP | 3.51e-06 | -4.04e-01 | -0.0228 |
| 55788 | LMBRD1 | A014-C-040 | Human | Colorectum | FAP | 7.46e-03 | -4.29e-01 | -0.1184 |
| 55788 | LMBRD1 | A002-C-201 | Human | Colorectum | FAP | 2.18e-10 | -3.91e-01 | 0.0324 |
| 55788 | LMBRD1 | A002-C-203 | Human | Colorectum | FAP | 3.39e-04 | -2.14e-01 | 0.2786 |
| 55788 | LMBRD1 | A001-C-119 | Human | Colorectum | FAP | 1.18e-11 | -5.46e-01 | -0.1557 |
| 55788 | LMBRD1 | A001-C-108 | Human | Colorectum | FAP | 5.01e-20 | -4.17e-01 | -0.0272 |
| 55788 | LMBRD1 | A002-C-205 | Human | Colorectum | FAP | 5.09e-17 | -4.93e-01 | -0.1236 |
| 55788 | LMBRD1 | A001-C-104 | Human | Colorectum | FAP | 1.81e-09 | -3.98e-01 | 0.0184 |
| 55788 | LMBRD1 | A015-C-005 | Human | Colorectum | FAP | 8.81e-07 | -3.63e-01 | -0.0336 |
| 55788 | LMBRD1 | A015-C-006 | Human | Colorectum | FAP | 5.65e-12 | -5.00e-01 | -0.0994 |
| 55788 | LMBRD1 | A015-C-106 | Human | Colorectum | FAP | 5.41e-13 | -3.61e-01 | -0.0511 |
| 55788 | LMBRD1 | A002-C-114 | Human | Colorectum | FAP | 9.39e-15 | -4.77e-01 | -0.1561 |
| Page: 1 2 3 4 5 6 7 8 |
| Tissue | Expression Dynamics | Abbreviation |
| Colorectum (GSE201348) |  | FAP: Familial adenomatous polyposis |
| CRC: Colorectal cancer | ||
| Colorectum (HTA11) | 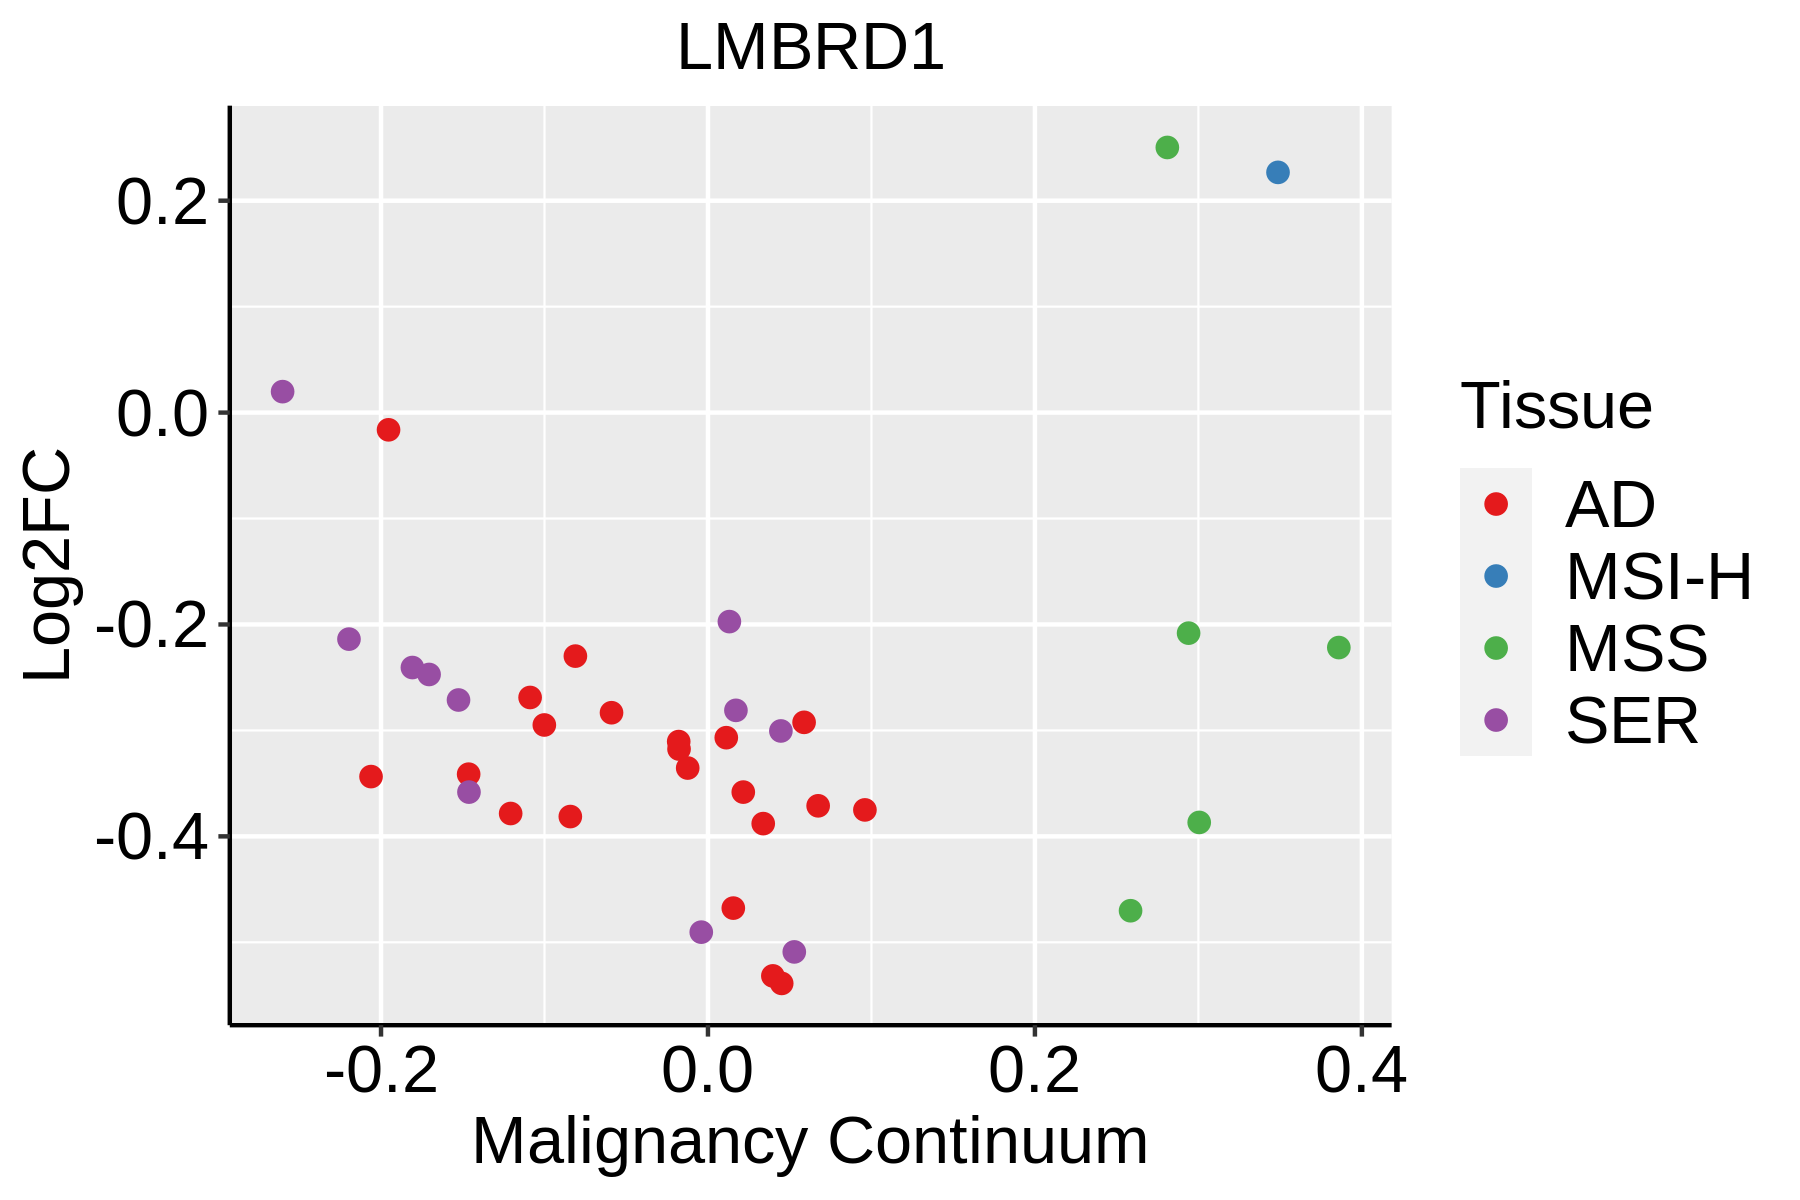 | AD: Adenomas |
| SER: Sessile serrated lesions | ||
| MSI-H: Microsatellite-high colorectal cancer | ||
| MSS: Microsatellite stable colorectal cancer | ||
| Esophagus | 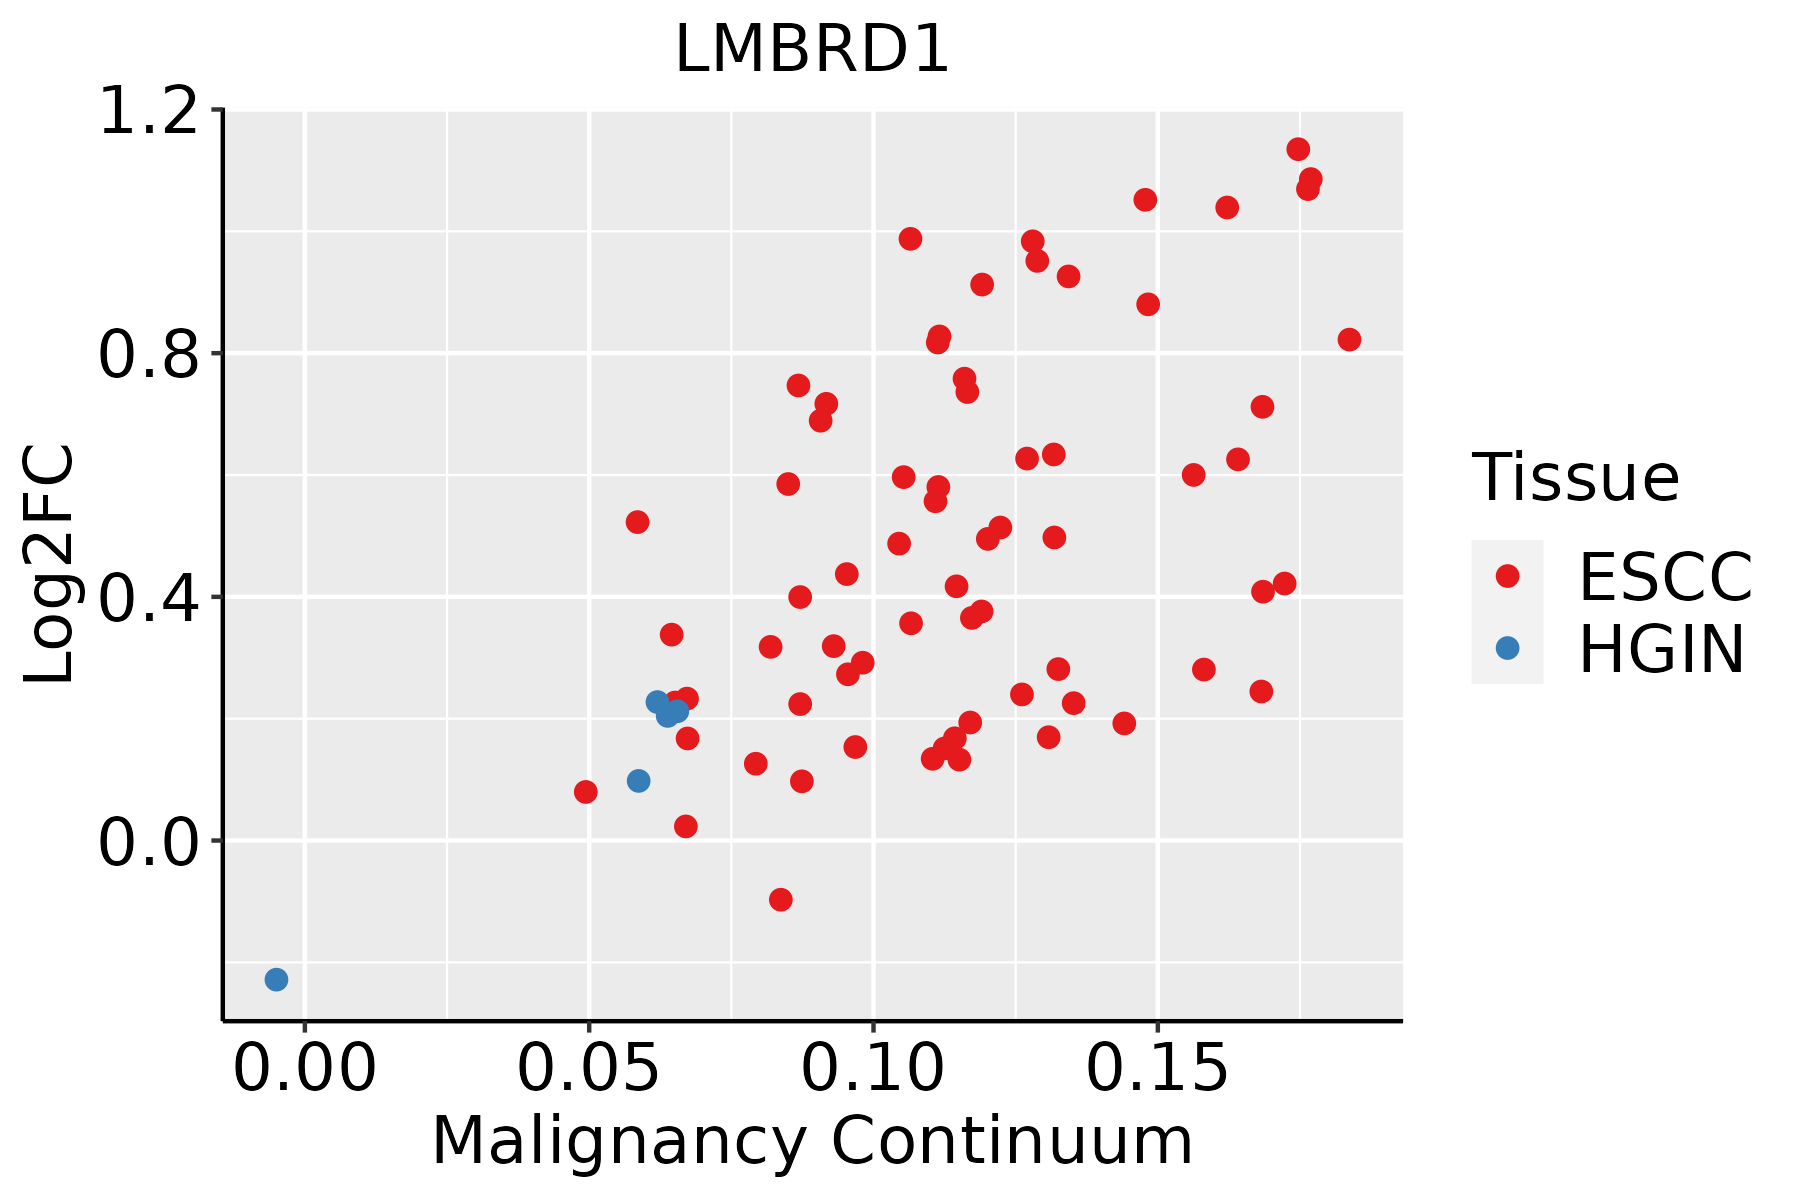 | ESCC: Esophageal squamous cell carcinoma |
| HGIN: High-grade intraepithelial neoplasias | ||
| LGIN: Low-grade intraepithelial neoplasias | ||
| Liver | 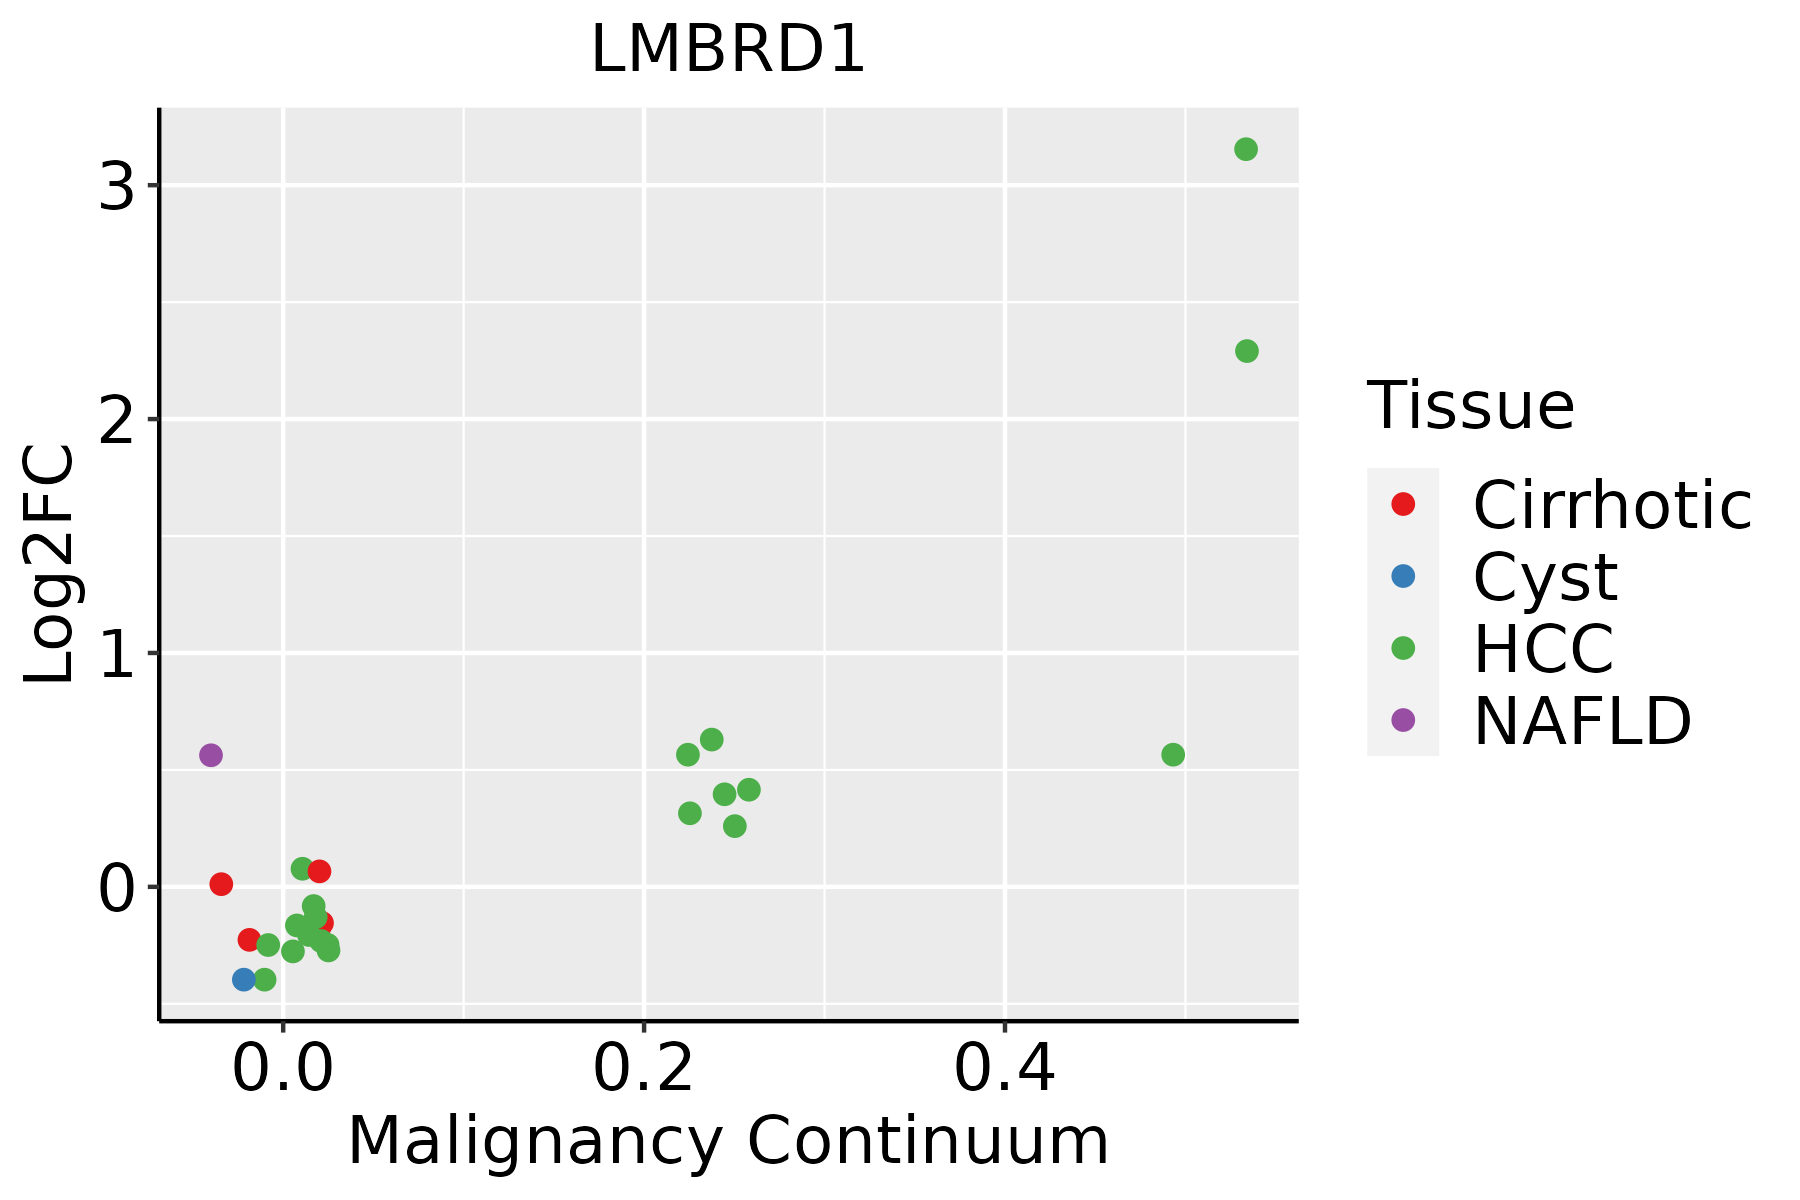 | HCC: Hepatocellular carcinoma |
| NAFLD: Non-alcoholic fatty liver disease | ||
| Oral Cavity | 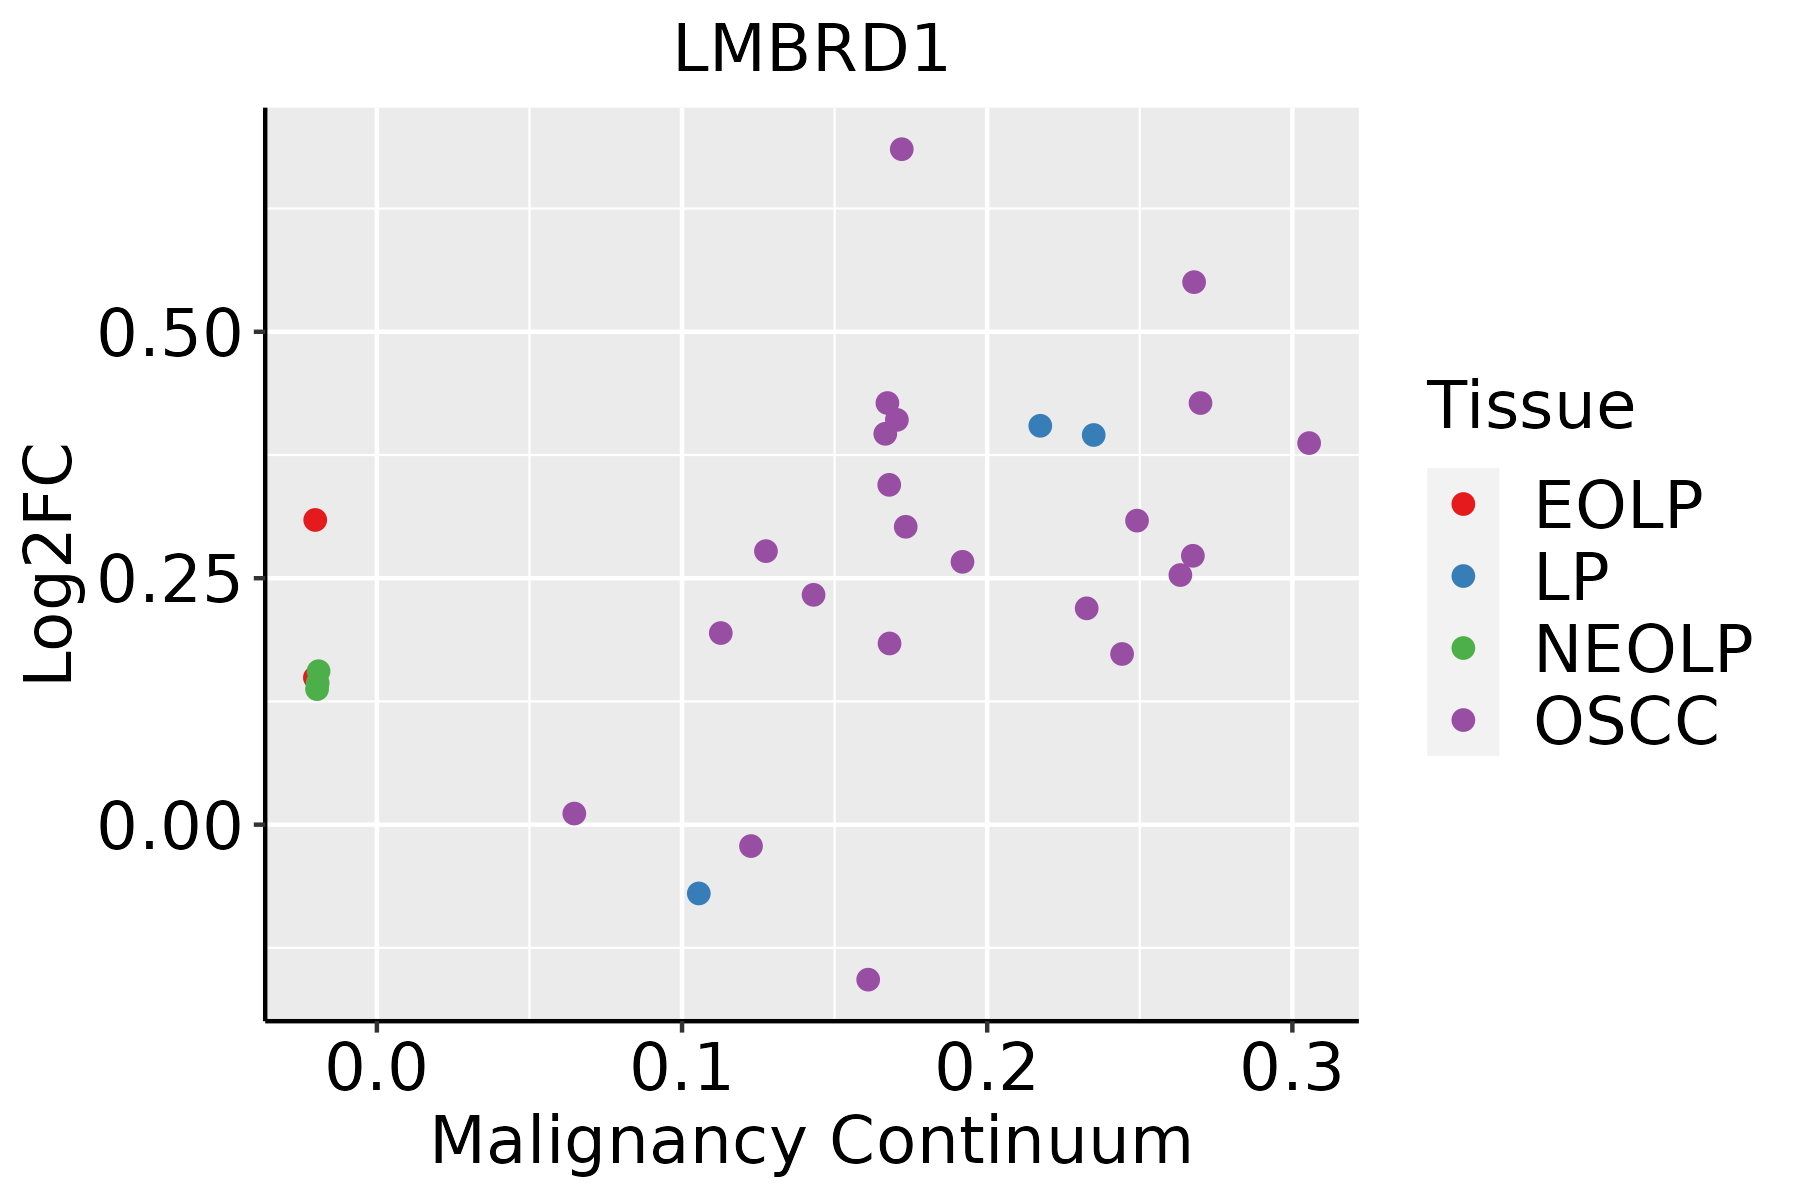 | EOLP: Erosive Oral lichen planus |
| LP: leukoplakia | ||
| NEOLP: Non-erosive oral lichen planus | ||
| OSCC: Oral squamous cell carcinoma | ||
| Thyroid | 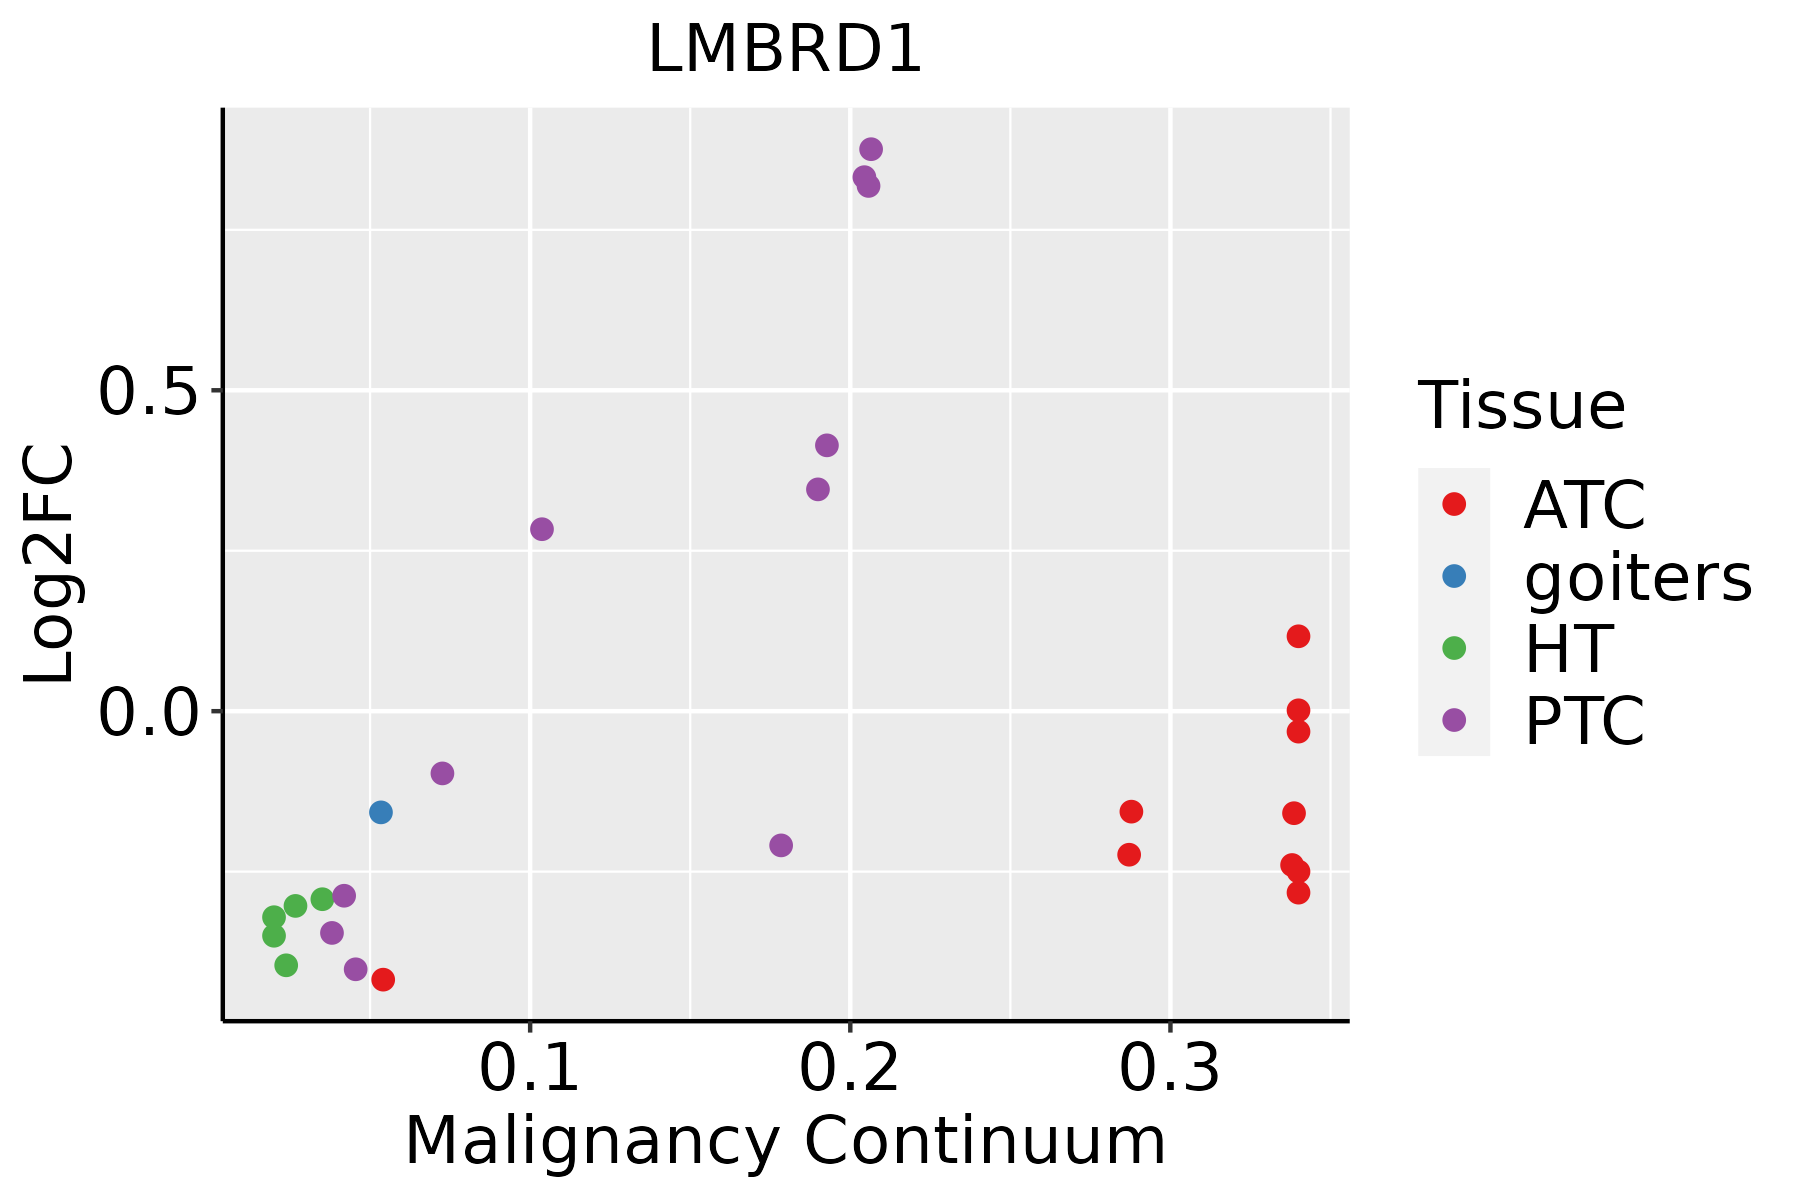 | ATC: Anaplastic thyroid cancer |
| HT: Hashimoto's thyroiditis | ||
| PTC: Papillary thyroid cancer |
| ∗log2FC in expression of this searched gene in stem-like cells from each diseased tissue sample relative to stem-like cells in normal samples in each tissue plotted against the malignancy continuum. Samples are colored based on if they are from different disease stage. |
Top |
Malignant transformation related pathway analysis |
| Find out the enriched GO biological processes and KEGG pathways involved in transition from healthy to precancer to cancer |
| Tissue | Disease Stage | Enriched GO biological Processes |
| Colorectum | AD |  |
| Colorectum | SER |  |
| Colorectum | MSS |  |
| Colorectum | MSI-H |  |
| Colorectum | FAP |  |
| ∗Top 15 enriched GO BP terms are showed in the bar plot of each disease state in each tissue. Each row represents a significant GO biological process which is colored according to the -log10(p.adjust). |
| Page: 1 2 3 4 5 6 7 8 9 |
| GO ID | Tissue | Disease Stage | Description | Gene Ratio | Bg Ratio | pvalue | p.adjust | Count |
| GO:0043112 | Colorectum | AD | receptor metabolic process | 62/3918 | 166/18723 | 8.18e-07 | 2.85e-05 | 62 |
| GO:0072583 | Colorectum | AD | clathrin-dependent endocytosis | 24/3918 | 47/18723 | 4.60e-06 | 1.22e-04 | 24 |
| GO:0006898 | Colorectum | AD | receptor-mediated endocytosis | 76/3918 | 244/18723 | 1.07e-04 | 1.59e-03 | 76 |
| GO:0072665 | Colorectum | AD | protein localization to vacuole | 27/3918 | 67/18723 | 2.40e-04 | 3.04e-03 | 27 |
| GO:0061462 | Colorectum | AD | protein localization to lysosome | 19/3918 | 46/18723 | 1.36e-03 | 1.19e-02 | 19 |
| GO:0007369 | Colorectum | AD | gastrulation | 53/3918 | 185/18723 | 7.60e-03 | 4.60e-02 | 53 |
| GO:0031623 | Colorectum | AD | receptor internalization | 35/3918 | 113/18723 | 7.72e-03 | 4.66e-02 | 35 |
| GO:00431121 | Colorectum | MSS | receptor metabolic process | 57/3467 | 166/18723 | 8.47e-07 | 2.97e-05 | 57 |
| GO:00725831 | Colorectum | MSS | clathrin-dependent endocytosis | 22/3467 | 47/18723 | 8.74e-06 | 2.16e-04 | 22 |
| GO:00068981 | Colorectum | MSS | receptor-mediated endocytosis | 69/3467 | 244/18723 | 1.18e-04 | 1.82e-03 | 69 |
| GO:00726652 | Colorectum | MSS | protein localization to vacuole | 23/3467 | 67/18723 | 1.51e-03 | 1.39e-02 | 23 |
| GO:00316231 | Colorectum | MSS | receptor internalization | 32/3467 | 113/18723 | 7.02e-03 | 4.50e-02 | 32 |
| GO:00725832 | Colorectum | FAP | clathrin-dependent endocytosis | 21/2622 | 47/18723 | 3.45e-07 | 1.87e-05 | 21 |
| GO:00068982 | Colorectum | FAP | receptor-mediated endocytosis | 62/2622 | 244/18723 | 1.47e-06 | 6.39e-05 | 62 |
| GO:00431122 | Colorectum | FAP | receptor metabolic process | 46/2622 | 166/18723 | 2.70e-06 | 1.02e-04 | 46 |
| GO:00073692 | Colorectum | FAP | gastrulation | 42/2622 | 185/18723 | 8.97e-04 | 9.10e-03 | 42 |
| GO:00316232 | Colorectum | FAP | receptor internalization | 28/2622 | 113/18723 | 1.56e-03 | 1.39e-02 | 28 |
| GO:00725833 | Colorectum | CRC | clathrin-dependent endocytosis | 18/2078 | 47/18723 | 1.16e-06 | 6.75e-05 | 18 |
| GO:00068983 | Colorectum | CRC | receptor-mediated endocytosis | 50/2078 | 244/18723 | 1.27e-05 | 4.08e-04 | 50 |
| GO:00431123 | Colorectum | CRC | receptor metabolic process | 36/2078 | 166/18723 | 5.86e-05 | 1.31e-03 | 36 |
| Page: 1 2 3 4 5 |
| Pathway ID | Tissue | Disease Stage | Description | Gene Ratio | Bg Ratio | pvalue | p.adjust | qvalue | Count |
| Page: 1 |
Top |
Cell-cell communication analysis |
| Identification of potential cell-cell interactions between two cell types and their ligand-receptor pairs for different disease states |
| Ligand | Receptor | LRpair | Pathway | Tissue | Disease Stage |
| Page: 1 |
Top |
Single-cell gene regulatory network inference analysis |
| Find out the significant the regulons (TFs) and the target genes of each regulon across cell types for different disease states |
| TF | Cell Type | Tissue | Disease Stage | Target Gene | RSS | Regulon Activity |
| ∗The dot plots of a searched regulon are shown for all cell subpopulations in each disease state of each tissue based on the regulon specific score inferred using pySCENIC and by calculating the average expression. |
| Page: 1 |
Top |
Somatic mutation of malignant transformation related genes |
| Annotation of somatic variants for genes involved in malignant transformation |
| Hugo Symbol | Variant Class | Variant Classification | dbSNP RS | HGVSc | HGVSp | HGVSp Short | SWISSPROT | BIOTYPE | SIFT | PolyPhen | Tumor Sample Barcode | Tissue | Histology | Sex | Age | Stage | Therapy Types | Drugs | Outcome |
| LMBRD1 | SNV | Missense_Mutation | c.1300N>A | p.Gln434Lys | p.Q434K | Q9NUN5 | protein_coding | deleterious(0.01) | possibly_damaging(0.8) | TCGA-A7-A0DB-01 | Breast | breast invasive carcinoma | Female | <65 | I/II | Hormone Therapy | arimidex | SD | |
| LMBRD1 | SNV | Missense_Mutation | c.686N>A | p.Ser229Asn | p.S229N | Q9NUN5 | protein_coding | tolerated(0.21) | benign(0.005) | TCGA-B6-A0IB-01 | Breast | breast invasive carcinoma | Female | <65 | III/IV | Unknown | Unknown | PD | |
| LMBRD1 | SNV | Missense_Mutation | c.160C>G | p.Leu54Val | p.L54V | Q9NUN5 | protein_coding | deleterious(0.01) | possibly_damaging(0.832) | TCGA-BH-A0H5-01 | Breast | breast invasive carcinoma | Female | <65 | I/II | Chemotherapy | cytoxan | CR | |
| LMBRD1 | SNV | Missense_Mutation | c.370N>A | p.Glu124Lys | p.E124K | Q9NUN5 | protein_coding | deleterious(0) | benign(0.276) | TCGA-EW-A1J5-01 | Breast | breast invasive carcinoma | Female | <65 | I/II | Chemotherapy | adriamycin | SD | |
| LMBRD1 | SNV | Missense_Mutation | c.1382N>T | p.Ser461Phe | p.S461F | Q9NUN5 | protein_coding | tolerated(0.7) | benign(0) | TCGA-DG-A2KK-01 | Cervix | cervical & endocervical cancer | Female | <65 | III/IV | Chemotherapy | cisplatin | SD | |
| LMBRD1 | SNV | Missense_Mutation | c.177C>G | p.Ile59Met | p.I59M | Q9NUN5 | protein_coding | tolerated(0.23) | benign(0.159) | TCGA-DR-A0ZM-01 | Cervix | cervical & endocervical cancer | Female | <65 | III/IV | Unspecific | Cisplatin | SD | |
| LMBRD1 | SNV | Missense_Mutation | c.379N>T | p.Asp127Tyr | p.D127Y | Q9NUN5 | protein_coding | deleterious(0) | probably_damaging(0.975) | TCGA-JW-A5VI-01 | Cervix | cervical & endocervical cancer | Female | <65 | I/II | Chemotherapy | topotecan | PD | |
| LMBRD1 | insertion | Frame_Shift_Ins | novel | c.1236dupT | p.Leu413SerfsTer13 | p.L413Sfs*13 | Q9NUN5 | protein_coding | TCGA-2W-A8YY-01 | Cervix | cervical & endocervical cancer | Female | <65 | I/II | Chemotherapy | cisplatin | CR | ||
| LMBRD1 | SNV | Missense_Mutation | c.1264N>A | p.Leu422Ile | p.L422I | Q9NUN5 | protein_coding | tolerated(0.12) | possibly_damaging(0.817) | TCGA-AA-3672-01 | Colorectum | colon adenocarcinoma | Female | >=65 | III/IV | Unknown | Unknown | SD | |
| LMBRD1 | SNV | Missense_Mutation | c.143N>C | p.Ile48Thr | p.I48T | Q9NUN5 | protein_coding | tolerated(0.07) | benign(0.048) | TCGA-AA-3821-01 | Colorectum | colon adenocarcinoma | Female | >=65 | I/II | Unknown | Unknown | SD |
| Page: 1 2 3 4 5 6 7 8 9 |
Top |
Related drugs of malignant transformation related genes |
| Identification of chemicals and drugs interact with genes involved in malignant transfromation |
| (DGIdb 4.0) |
| Entrez ID | Symbol | Category | Interaction Types | Drug Claim Name | Drug Name | PMIDs |
| Page: 1 |

Copyright 2023-Present -The University of Texas Health Science Center at Houston |