
|
|||||
|
 | |
| |
| |
| |
| |
| |
|
Gene: LMBR1L |
Gene summary for LMBR1L |
| Gene information | Species | Human | Gene symbol | LMBR1L | Gene ID | 55716 |
| Gene name | limb development membrane protein 1 like | |
| Gene Alias | LIMR | |
| Cytomap | 12q13.12 | |
| Gene Type | protein-coding | GO ID | GO:0001775 | UniProtAcc | A0A024R0Z6 |
Top |
Malignant transformation analysis |
| Identification of the aberrant gene expression in precancerous and cancerous lesions by comparing the gene expression of stem-like cells in diseased tissues with normal stem cells |
| Entrez ID | Symbol | Replicates | Species | Organ | Tissue | Adj P-value | Log2FC | Malignancy |
| 55716 | LMBR1L | LZE7T | Human | Esophagus | ESCC | 3.24e-02 | 1.64e-01 | 0.0667 |
| 55716 | LMBR1L | LZE8T | Human | Esophagus | ESCC | 9.75e-03 | 1.18e-01 | 0.067 |
| 55716 | LMBR1L | LZE24T | Human | Esophagus | ESCC | 7.24e-17 | 3.12e-01 | 0.0596 |
| 55716 | LMBR1L | P1T-E | Human | Esophagus | ESCC | 7.02e-12 | 4.30e-01 | 0.0875 |
| 55716 | LMBR1L | P2T-E | Human | Esophagus | ESCC | 9.56e-28 | 4.06e-01 | 0.1177 |
| 55716 | LMBR1L | P4T-E | Human | Esophagus | ESCC | 1.32e-05 | 2.36e-01 | 0.1323 |
| 55716 | LMBR1L | P8T-E | Human | Esophagus | ESCC | 1.91e-12 | 2.44e-01 | 0.0889 |
| 55716 | LMBR1L | P9T-E | Human | Esophagus | ESCC | 6.71e-04 | 1.13e-01 | 0.1131 |
| 55716 | LMBR1L | P10T-E | Human | Esophagus | ESCC | 1.31e-12 | 2.48e-01 | 0.116 |
| 55716 | LMBR1L | P11T-E | Human | Esophagus | ESCC | 5.01e-07 | 3.66e-01 | 0.1426 |
| 55716 | LMBR1L | P12T-E | Human | Esophagus | ESCC | 1.58e-18 | 2.79e-01 | 0.1122 |
| 55716 | LMBR1L | P15T-E | Human | Esophagus | ESCC | 1.04e-07 | 2.14e-01 | 0.1149 |
| 55716 | LMBR1L | P16T-E | Human | Esophagus | ESCC | 6.96e-14 | 2.88e-01 | 0.1153 |
| 55716 | LMBR1L | P20T-E | Human | Esophagus | ESCC | 4.06e-08 | 1.16e-01 | 0.1124 |
| 55716 | LMBR1L | P21T-E | Human | Esophagus | ESCC | 2.84e-04 | 1.07e-01 | 0.1617 |
| 55716 | LMBR1L | P22T-E | Human | Esophagus | ESCC | 9.90e-08 | 1.45e-01 | 0.1236 |
| 55716 | LMBR1L | P23T-E | Human | Esophagus | ESCC | 3.14e-12 | 2.21e-01 | 0.108 |
| 55716 | LMBR1L | P24T-E | Human | Esophagus | ESCC | 1.52e-06 | 1.49e-01 | 0.1287 |
| 55716 | LMBR1L | P26T-E | Human | Esophagus | ESCC | 4.22e-15 | 2.17e-01 | 0.1276 |
| 55716 | LMBR1L | P27T-E | Human | Esophagus | ESCC | 2.11e-17 | 3.05e-01 | 0.1055 |
| Page: 1 2 3 4 |
| Tissue | Expression Dynamics | Abbreviation |
| Esophagus | 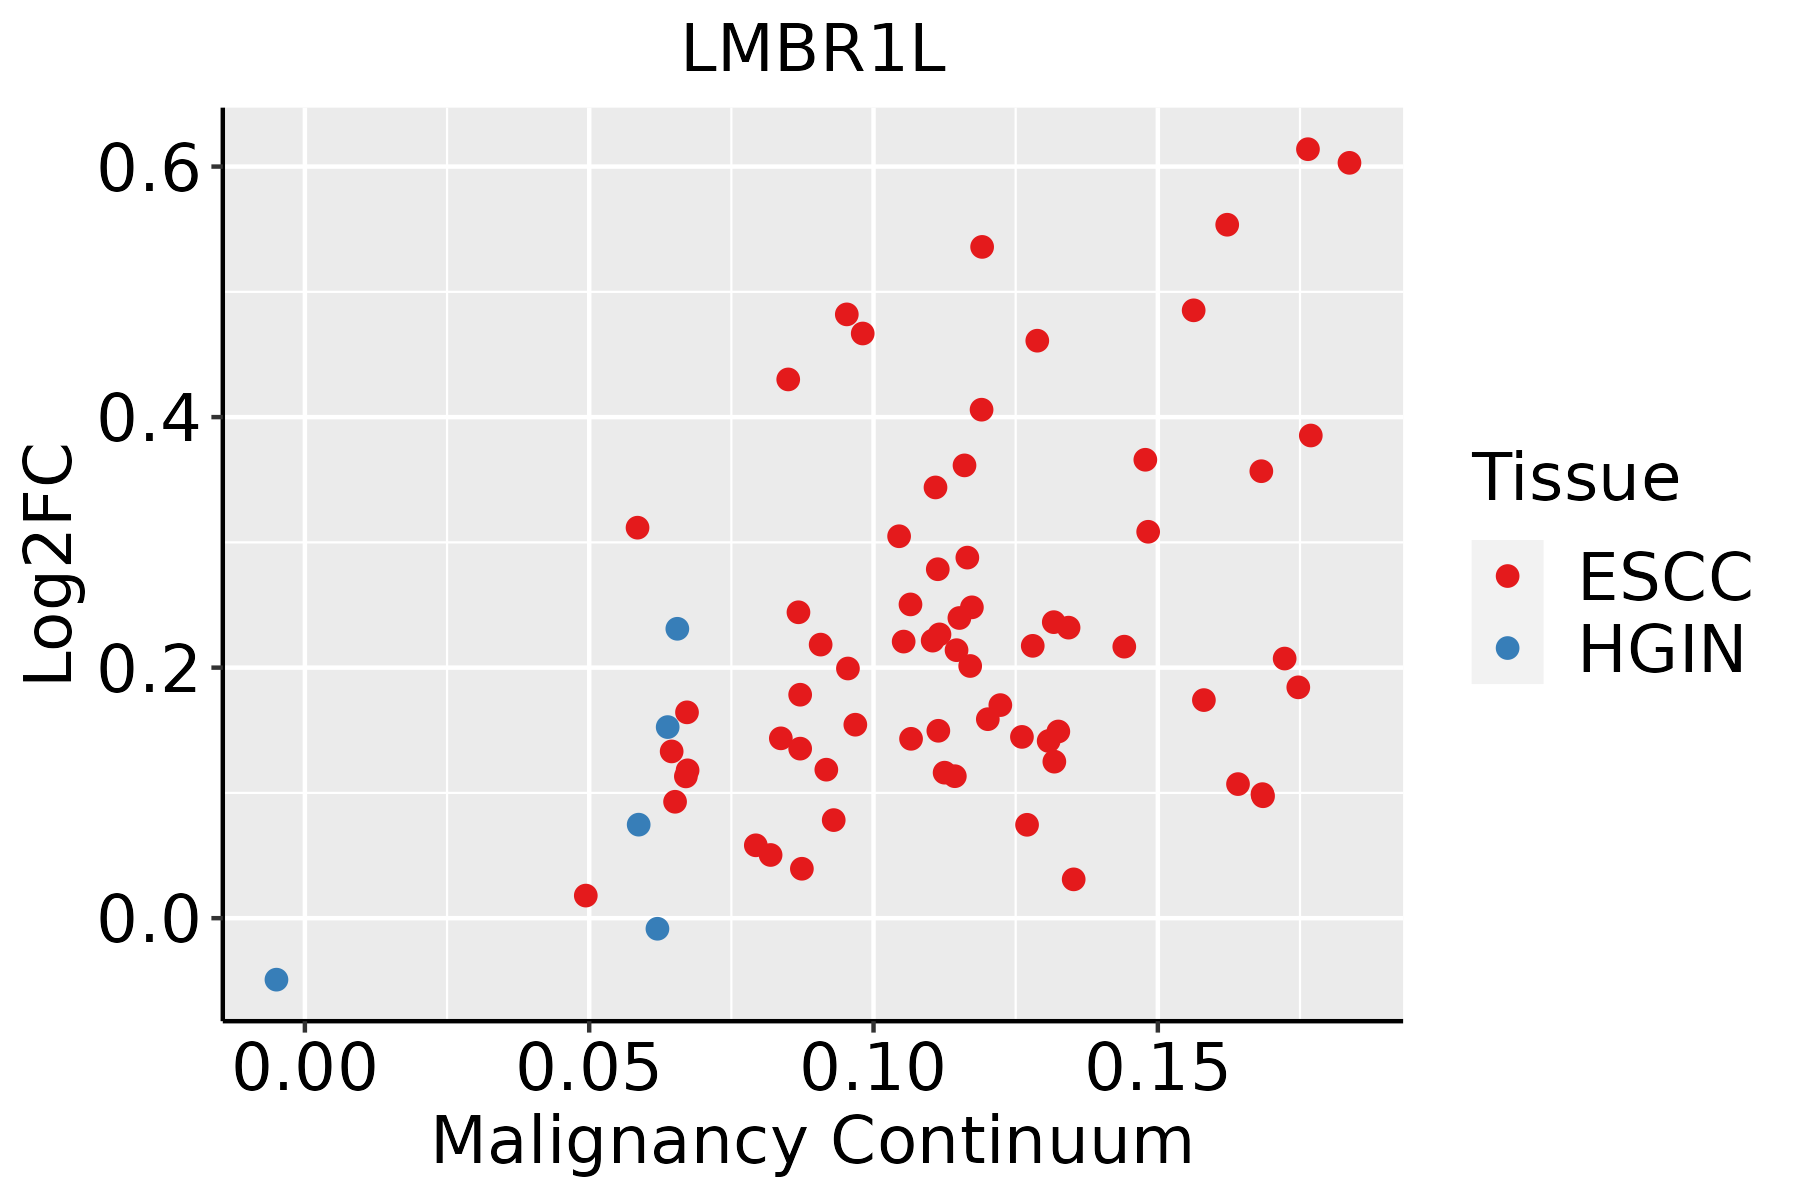 | ESCC: Esophageal squamous cell carcinoma |
| HGIN: High-grade intraepithelial neoplasias | ||
| LGIN: Low-grade intraepithelial neoplasias | ||
| Thyroid |  | ATC: Anaplastic thyroid cancer |
| HT: Hashimoto's thyroiditis | ||
| PTC: Papillary thyroid cancer |
| ∗log2FC in expression of this searched gene in stem-like cells from each diseased tissue sample relative to stem-like cells in normal samples in each tissue plotted against the malignancy continuum. Samples are colored based on if they are from different disease stage. |
Top |
Malignant transformation related pathway analysis |
| Find out the enriched GO biological processes and KEGG pathways involved in transition from healthy to precancer to cancer |
| Tissue | Disease Stage | Enriched GO biological Processes |
| Colorectum | AD |  |
| Colorectum | SER |  |
| Colorectum | MSS |  |
| Colorectum | MSI-H |  |
| Colorectum | FAP |  |
| ∗Top 15 enriched GO BP terms are showed in the bar plot of each disease state in each tissue. Each row represents a significant GO biological process which is colored according to the -log10(p.adjust). |
| Page: 1 2 3 4 5 6 7 8 9 |
| GO ID | Tissue | Disease Stage | Description | Gene Ratio | Bg Ratio | pvalue | p.adjust | Count |
| GO:001605517 | Esophagus | ESCC | Wnt signaling pathway | 268/8552 | 444/18723 | 2.32e-10 | 6.58e-09 | 268 |
| GO:019873817 | Esophagus | ESCC | cell-cell signaling by wnt | 269/8552 | 446/18723 | 2.41e-10 | 6.79e-09 | 269 |
| GO:003011117 | Esophagus | ESCC | regulation of Wnt signaling pathway | 194/8552 | 328/18723 | 5.39e-07 | 7.14e-06 | 194 |
| GO:006007016 | Esophagus | ESCC | canonical Wnt signaling pathway | 180/8552 | 303/18723 | 9.15e-07 | 1.17e-05 | 180 |
| GO:006082817 | Esophagus | ESCC | regulation of canonical Wnt signaling pathway | 153/8552 | 253/18723 | 1.38e-06 | 1.67e-05 | 153 |
| GO:000689818 | Esophagus | ESCC | receptor-mediated endocytosis | 142/8552 | 244/18723 | 5.22e-05 | 4.05e-04 | 142 |
| GO:00488638 | Esophagus | ESCC | stem cell differentiation | 122/8552 | 206/18723 | 5.95e-05 | 4.59e-04 | 122 |
| GO:00718871 | Esophagus | ESCC | leukocyte apoptotic process | 65/8552 | 106/18723 | 8.39e-04 | 4.32e-03 | 65 |
| GO:004211018 | Esophagus | ESCC | T cell activation | 256/8552 | 487/18723 | 1.18e-03 | 5.87e-03 | 256 |
| GO:19031317 | Esophagus | ESCC | mononuclear cell differentiation | 226/8552 | 426/18723 | 1.20e-03 | 5.88e-03 | 226 |
| GO:00702271 | Esophagus | ESCC | lymphocyte apoptotic process | 46/8552 | 72/18723 | 1.39e-03 | 6.62e-03 | 46 |
| GO:00301788 | Esophagus | ESCC | negative regulation of Wnt signaling pathway | 97/8552 | 170/18723 | 1.81e-03 | 8.31e-03 | 97 |
| GO:00602185 | Esophagus | ESCC | hematopoietic stem cell differentiation | 22/8552 | 30/18723 | 1.98e-03 | 8.90e-03 | 22 |
| GO:00900905 | Esophagus | ESCC | negative regulation of canonical Wnt signaling pathway | 78/8552 | 137/18723 | 5.17e-03 | 1.95e-02 | 78 |
| GO:00022446 | Esophagus | ESCC | hematopoietic progenitor cell differentiation | 66/8552 | 114/18723 | 5.74e-03 | 2.13e-02 | 66 |
| GO:00302176 | Esophagus | ESCC | T cell differentiation | 137/8552 | 257/18723 | 8.09e-03 | 2.87e-02 | 137 |
| GO:0070231 | Esophagus | ESCC | T cell apoptotic process | 31/8552 | 50/18723 | 1.48e-02 | 4.79e-02 | 31 |
| GO:00300984 | Esophagus | ESCC | lymphocyte differentiation | 192/8552 | 374/18723 | 1.52e-02 | 4.93e-02 | 192 |
| GO:0016055110 | Thyroid | PTC | Wnt signaling pathway | 217/5968 | 444/18723 | 3.71e-14 | 2.30e-12 | 217 |
| GO:0198738110 | Thyroid | PTC | cell-cell signaling by wnt | 217/5968 | 446/18723 | 6.68e-14 | 3.73e-12 | 217 |
| Page: 1 2 3 |
| Pathway ID | Tissue | Disease Stage | Description | Gene Ratio | Bg Ratio | pvalue | p.adjust | qvalue | Count |
| Page: 1 |
Top |
Cell-cell communication analysis |
| Identification of potential cell-cell interactions between two cell types and their ligand-receptor pairs for different disease states |
| Ligand | Receptor | LRpair | Pathway | Tissue | Disease Stage |
| Page: 1 |
Top |
Single-cell gene regulatory network inference analysis |
| Find out the significant the regulons (TFs) and the target genes of each regulon across cell types for different disease states |
| TF | Cell Type | Tissue | Disease Stage | Target Gene | RSS | Regulon Activity |
| ∗The dot plots of a searched regulon are shown for all cell subpopulations in each disease state of each tissue based on the regulon specific score inferred using pySCENIC and by calculating the average expression. |
| Page: 1 |
Top |
Somatic mutation of malignant transformation related genes |
| Annotation of somatic variants for genes involved in malignant transformation |
| Hugo Symbol | Variant Class | Variant Classification | dbSNP RS | HGVSc | HGVSp | HGVSp Short | SWISSPROT | BIOTYPE | SIFT | PolyPhen | Tumor Sample Barcode | Tissue | Histology | Sex | Age | Stage | Therapy Types | Drugs | Outcome |
| LMBR1L | SNV | Missense_Mutation | novel | c.176N>T | p.Thr59Ile | p.T59I | Q6UX01 | protein_coding | tolerated(0.61) | benign(0.001) | TCGA-AN-A046-01 | Breast | breast invasive carcinoma | Female | >=65 | I/II | Unknown | Unknown | SD |
| LMBR1L | SNV | Missense_Mutation | novel | c.770N>T | p.Asn257Ile | p.N257I | Q6UX01 | protein_coding | deleterious(0.04) | benign(0.04) | TCGA-BH-A0H6-01 | Breast | breast invasive carcinoma | Female | >=65 | I/II | Unknown | Unknown | SD |
| LMBR1L | SNV | Missense_Mutation | c.1448N>A | p.Ser483Tyr | p.S483Y | Q6UX01 | protein_coding | tolerated(0.07) | benign(0.011) | TCGA-E2-A156-01 | Breast | breast invasive carcinoma | Female | <65 | I/II | Hormone Therapy | arimidex | SD | |
| LMBR1L | SNV | Missense_Mutation | c.181N>G | p.Asn61Asp | p.N61D | Q6UX01 | protein_coding | tolerated(0.47) | possibly_damaging(0.721) | TCGA-E2-A15S-01 | Breast | breast invasive carcinoma | Female | <65 | I/II | Chemotherapy | doxorubicin | SD | |
| LMBR1L | insertion | Frame_Shift_Ins | novel | c.612_613insACAAAAA | p.Gly205ThrfsTer45 | p.G205Tfs*45 | Q6UX01 | protein_coding | TCGA-A8-A08T-01 | Breast | breast invasive carcinoma | Female | <65 | III/IV | Unknown | Unknown | PD | ||
| LMBR1L | insertion | Frame_Shift_Ins | novel | c.611_612insGAGCAACATGGTGAAACCCGGCCTC | p.Gly205SerfsTer51 | p.G205Sfs*51 | Q6UX01 | protein_coding | TCGA-A8-A08T-01 | Breast | breast invasive carcinoma | Female | <65 | III/IV | Unknown | Unknown | PD | ||
| LMBR1L | insertion | Frame_Shift_Ins | novel | c.374_375insGCAGGGAC | p.Ile125MetfsTer35 | p.I125Mfs*35 | Q6UX01 | protein_coding | TCGA-A8-A0A4-01 | Breast | breast invasive carcinoma | Female | >=65 | I/II | Hormone Therapy | tamoxiphen | CR | ||
| LMBR1L | insertion | Frame_Shift_Ins | novel | c.373_374insGGGAGAGGGGAGGCAA | p.Ile125ArgfsTer17 | p.I125Rfs*17 | Q6UX01 | protein_coding | TCGA-A8-A0A4-01 | Breast | breast invasive carcinoma | Female | >=65 | I/II | Hormone Therapy | tamoxiphen | CR | ||
| LMBR1L | insertion | Nonsense_Mutation | novel | c.1341_1342insTATGAGTACTAGCCATAGAGTGTGGTGAGGGGA | p.Thr447_Thr448insTyrGluTyrTerProTerSerValValArgGly | p.T447_T448insYEY*P*SVVRG | Q6UX01 | protein_coding | TCGA-BH-A0H7-01 | Breast | breast invasive carcinoma | Female | >=65 | III/IV | Chemotherapy | doxorubicin | SD | ||
| LMBR1L | SNV | Missense_Mutation | rs371228926 | c.1378N>T | p.Arg460Trp | p.R460W | Q6UX01 | protein_coding | deleterious(0) | possibly_damaging(0.548) | TCGA-2W-A8YY-01 | Cervix | cervical & endocervical cancer | Female | <65 | I/II | Chemotherapy | cisplatin | CR |
| Page: 1 2 3 4 5 6 |
Top |
Related drugs of malignant transformation related genes |
| Identification of chemicals and drugs interact with genes involved in malignant transfromation |
| (DGIdb 4.0) |
| Entrez ID | Symbol | Category | Interaction Types | Drug Claim Name | Drug Name | PMIDs |
| Page: 1 |

Copyright 2023-Present -The University of Texas Health Science Center at Houston |