
|
|||||
|
 | |
| |
| |
| |
| |
| |
|
Gene: LMBR1 |
Gene summary for LMBR1 |
| Gene information | Species | Human | Gene symbol | LMBR1 | Gene ID | 64327 |
| Gene name | limb development membrane protein 1 | |
| Gene Alias | ACHP | |
| Cytomap | 7q36.3 | |
| Gene Type | protein-coding | GO ID | GO:0007154 | UniProtAcc | Q8WVP7 |
Top |
Malignant transformation analysis |
| Identification of the aberrant gene expression in precancerous and cancerous lesions by comparing the gene expression of stem-like cells in diseased tissues with normal stem cells |
| Entrez ID | Symbol | Replicates | Species | Organ | Tissue | Adj P-value | Log2FC | Malignancy |
| 64327 | LMBR1 | CCI_1 | Human | Cervix | CC | 2.33e-02 | 5.41e-01 | 0.528 |
| 64327 | LMBR1 | CCI_2 | Human | Cervix | CC | 1.14e-07 | 9.35e-01 | 0.5249 |
| 64327 | LMBR1 | HTA11_3410_2000001011 | Human | Colorectum | AD | 8.53e-07 | -4.15e-01 | 0.0155 |
| 64327 | LMBR1 | HTA11_866_2000001011 | Human | Colorectum | AD | 5.46e-07 | -3.34e-01 | -0.1001 |
| 64327 | LMBR1 | HTA11_866_3004761011 | Human | Colorectum | AD | 8.89e-07 | -3.75e-01 | 0.096 |
| 64327 | LMBR1 | A015-C-203 | Human | Colorectum | FAP | 1.33e-24 | -4.89e-01 | -0.1294 |
| 64327 | LMBR1 | A015-C-204 | Human | Colorectum | FAP | 3.81e-04 | -3.10e-01 | -0.0228 |
| 64327 | LMBR1 | A014-C-040 | Human | Colorectum | FAP | 1.28e-02 | -4.29e-01 | -0.1184 |
| 64327 | LMBR1 | A002-C-201 | Human | Colorectum | FAP | 7.63e-13 | -3.98e-01 | 0.0324 |
| 64327 | LMBR1 | A001-C-119 | Human | Colorectum | FAP | 9.51e-06 | -4.10e-01 | -0.1557 |
| 64327 | LMBR1 | A001-C-108 | Human | Colorectum | FAP | 1.29e-13 | -3.41e-01 | -0.0272 |
| 64327 | LMBR1 | A002-C-205 | Human | Colorectum | FAP | 8.60e-19 | -3.70e-01 | -0.1236 |
| 64327 | LMBR1 | A015-C-005 | Human | Colorectum | FAP | 2.20e-04 | -3.51e-01 | -0.0336 |
| 64327 | LMBR1 | A015-C-006 | Human | Colorectum | FAP | 2.21e-12 | -3.96e-01 | -0.0994 |
| 64327 | LMBR1 | A015-C-106 | Human | Colorectum | FAP | 5.34e-10 | -2.98e-01 | -0.0511 |
| 64327 | LMBR1 | A002-C-114 | Human | Colorectum | FAP | 7.34e-17 | -4.42e-01 | -0.1561 |
| 64327 | LMBR1 | A015-C-104 | Human | Colorectum | FAP | 2.35e-27 | -5.44e-01 | -0.1899 |
| 64327 | LMBR1 | A001-C-014 | Human | Colorectum | FAP | 9.65e-13 | -3.05e-01 | 0.0135 |
| 64327 | LMBR1 | A002-C-016 | Human | Colorectum | FAP | 3.68e-16 | -3.71e-01 | 0.0521 |
| 64327 | LMBR1 | A015-C-002 | Human | Colorectum | FAP | 8.06e-12 | -5.41e-01 | -0.0763 |
| Page: 1 2 3 4 5 6 7 |
| Tissue | Expression Dynamics | Abbreviation |
| Cervix |  | CC: Cervix cancer |
| HSIL_HPV: HPV-infected high-grade squamous intraepithelial lesions | ||
| N_HPV: HPV-infected normal cervix | ||
| Colorectum (GSE201348) |  | FAP: Familial adenomatous polyposis |
| CRC: Colorectal cancer | ||
| Colorectum (HTA11) |  | AD: Adenomas |
| SER: Sessile serrated lesions | ||
| MSI-H: Microsatellite-high colorectal cancer | ||
| MSS: Microsatellite stable colorectal cancer | ||
| Endometrium | 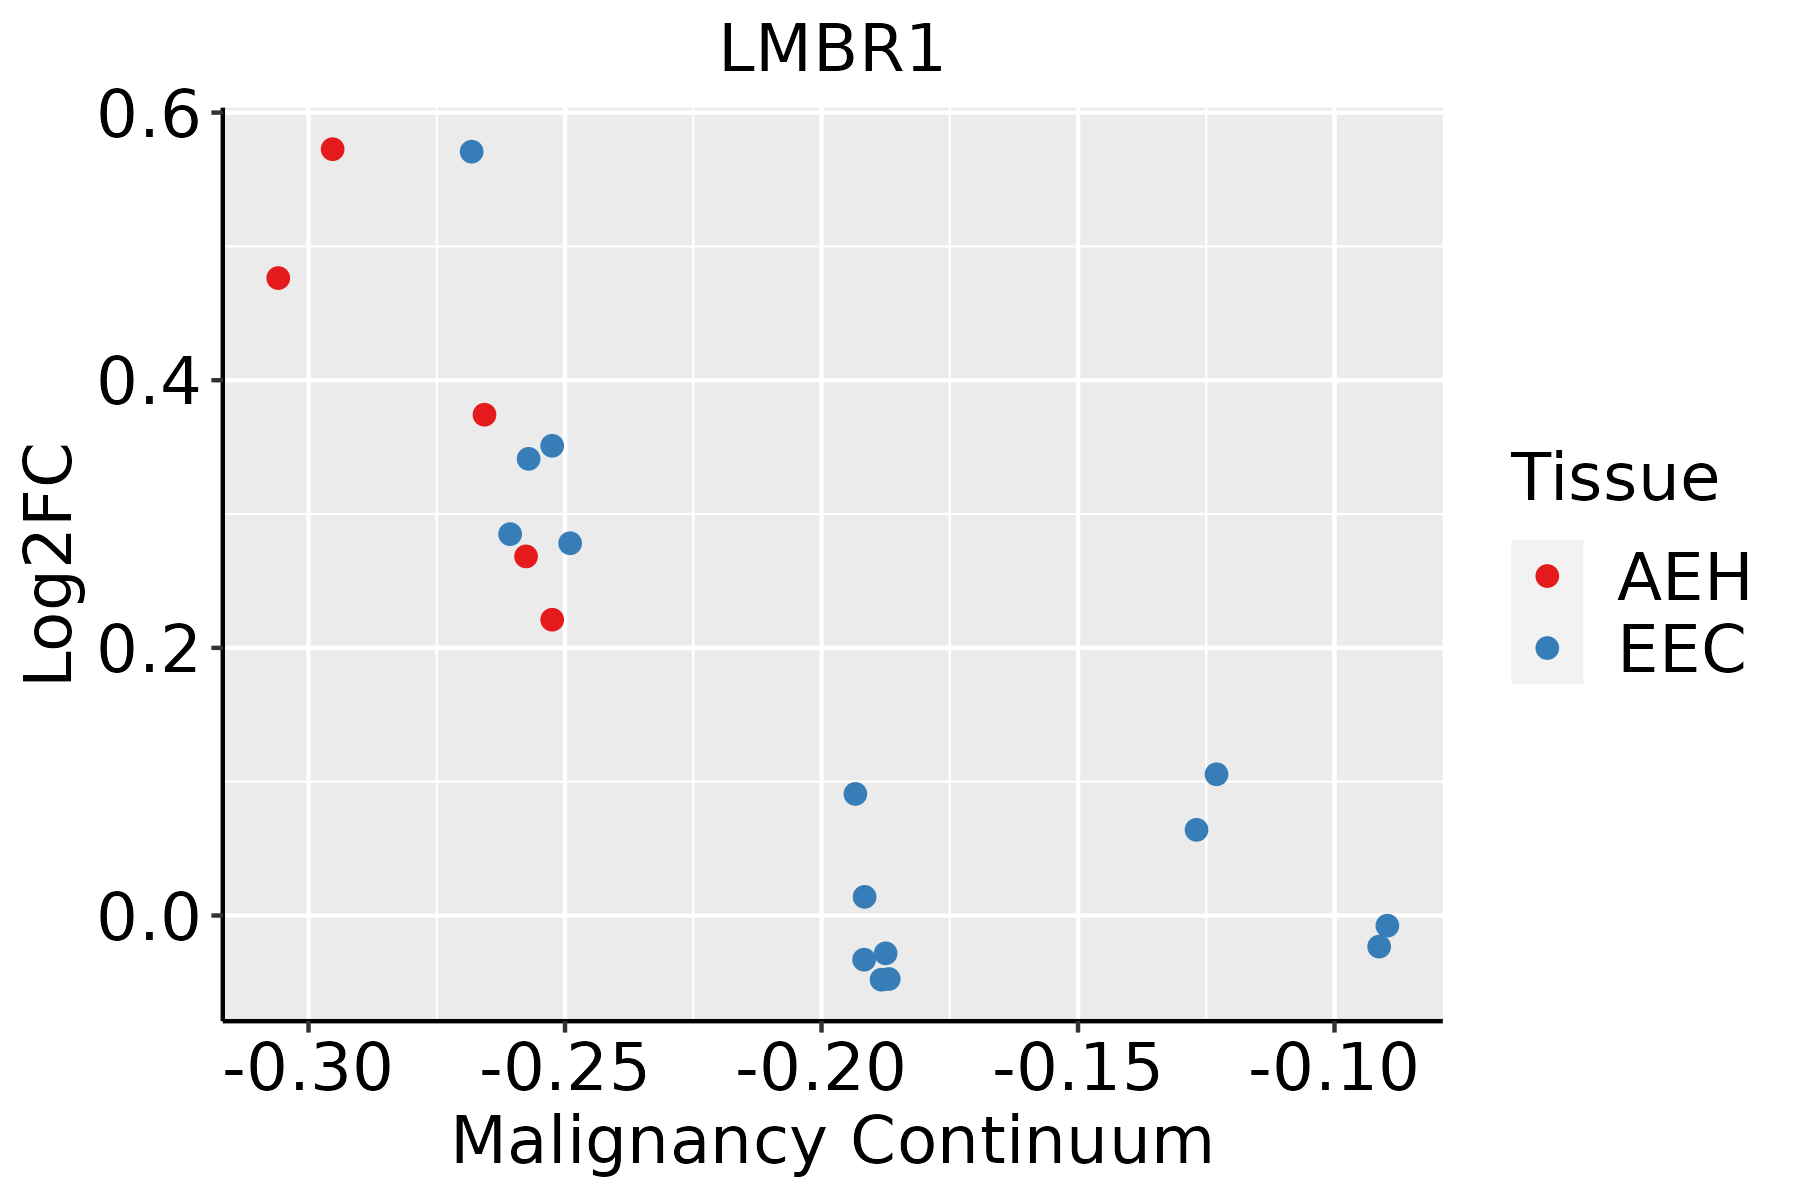 | AEH: Atypical endometrial hyperplasia |
| EEC: Endometrioid Cancer | ||
| Esophagus |  | ESCC: Esophageal squamous cell carcinoma |
| HGIN: High-grade intraepithelial neoplasias | ||
| LGIN: Low-grade intraepithelial neoplasias | ||
| Liver | 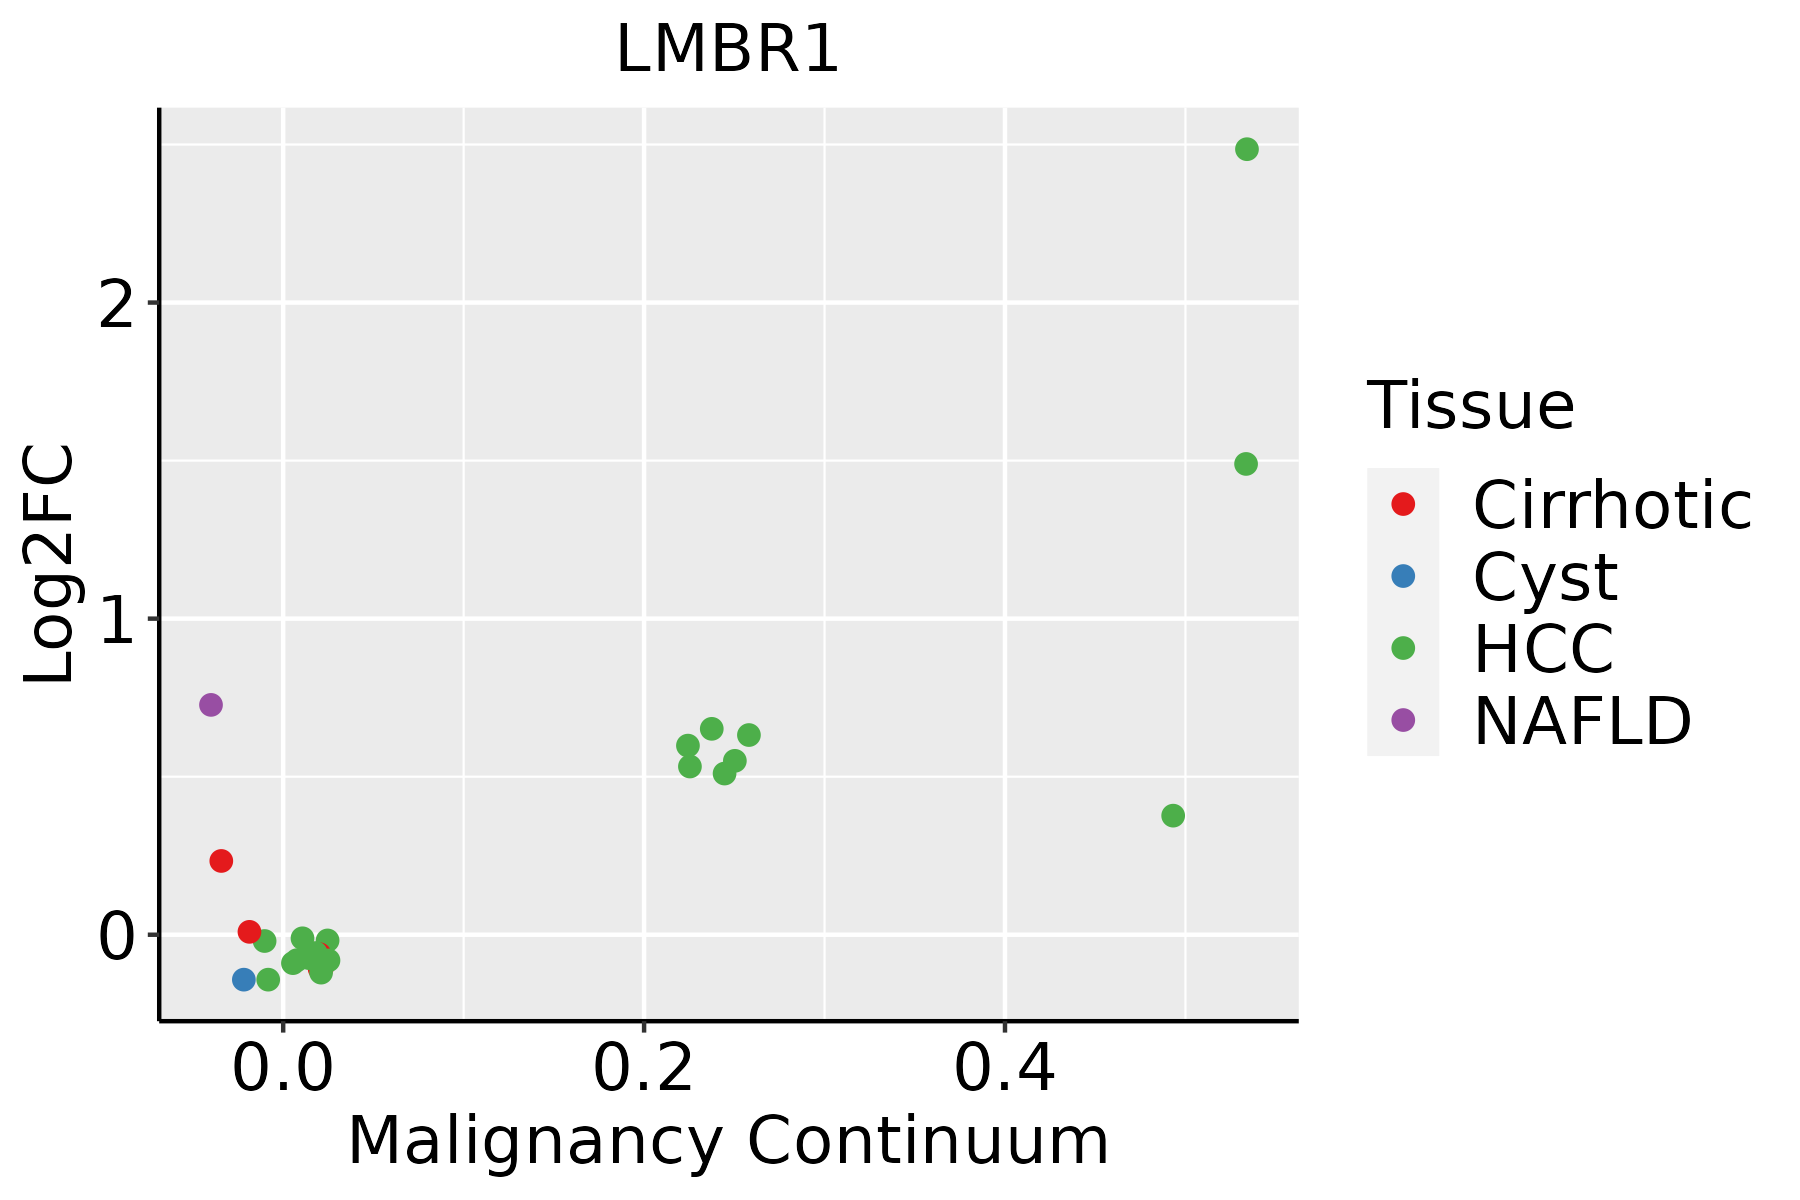 | HCC: Hepatocellular carcinoma |
| NAFLD: Non-alcoholic fatty liver disease | ||
| Lung | 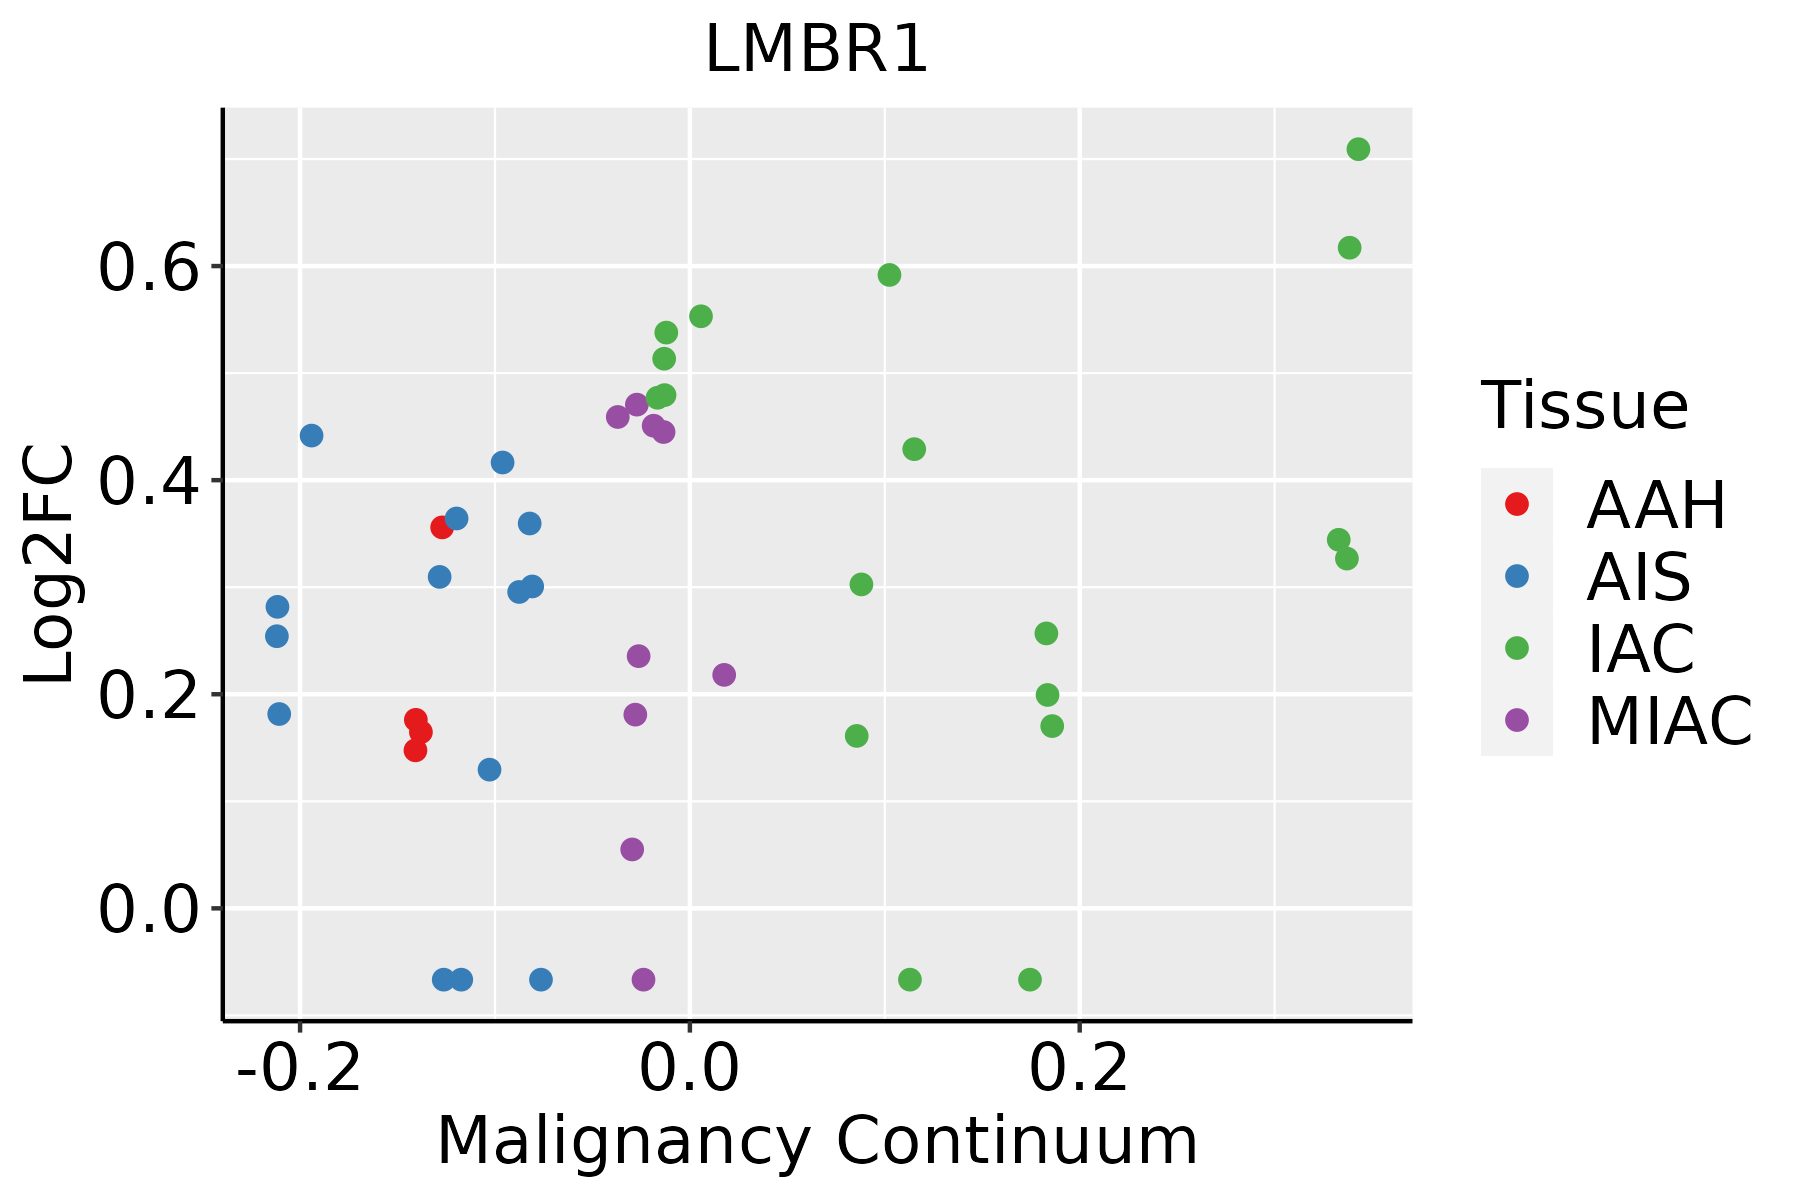 | AAH: Atypical adenomatous hyperplasia |
| AIS: Adenocarcinoma in situ | ||
| IAC: Invasive lung adenocarcinoma | ||
| MIA: Minimally invasive adenocarcinoma | ||
| Prostate | 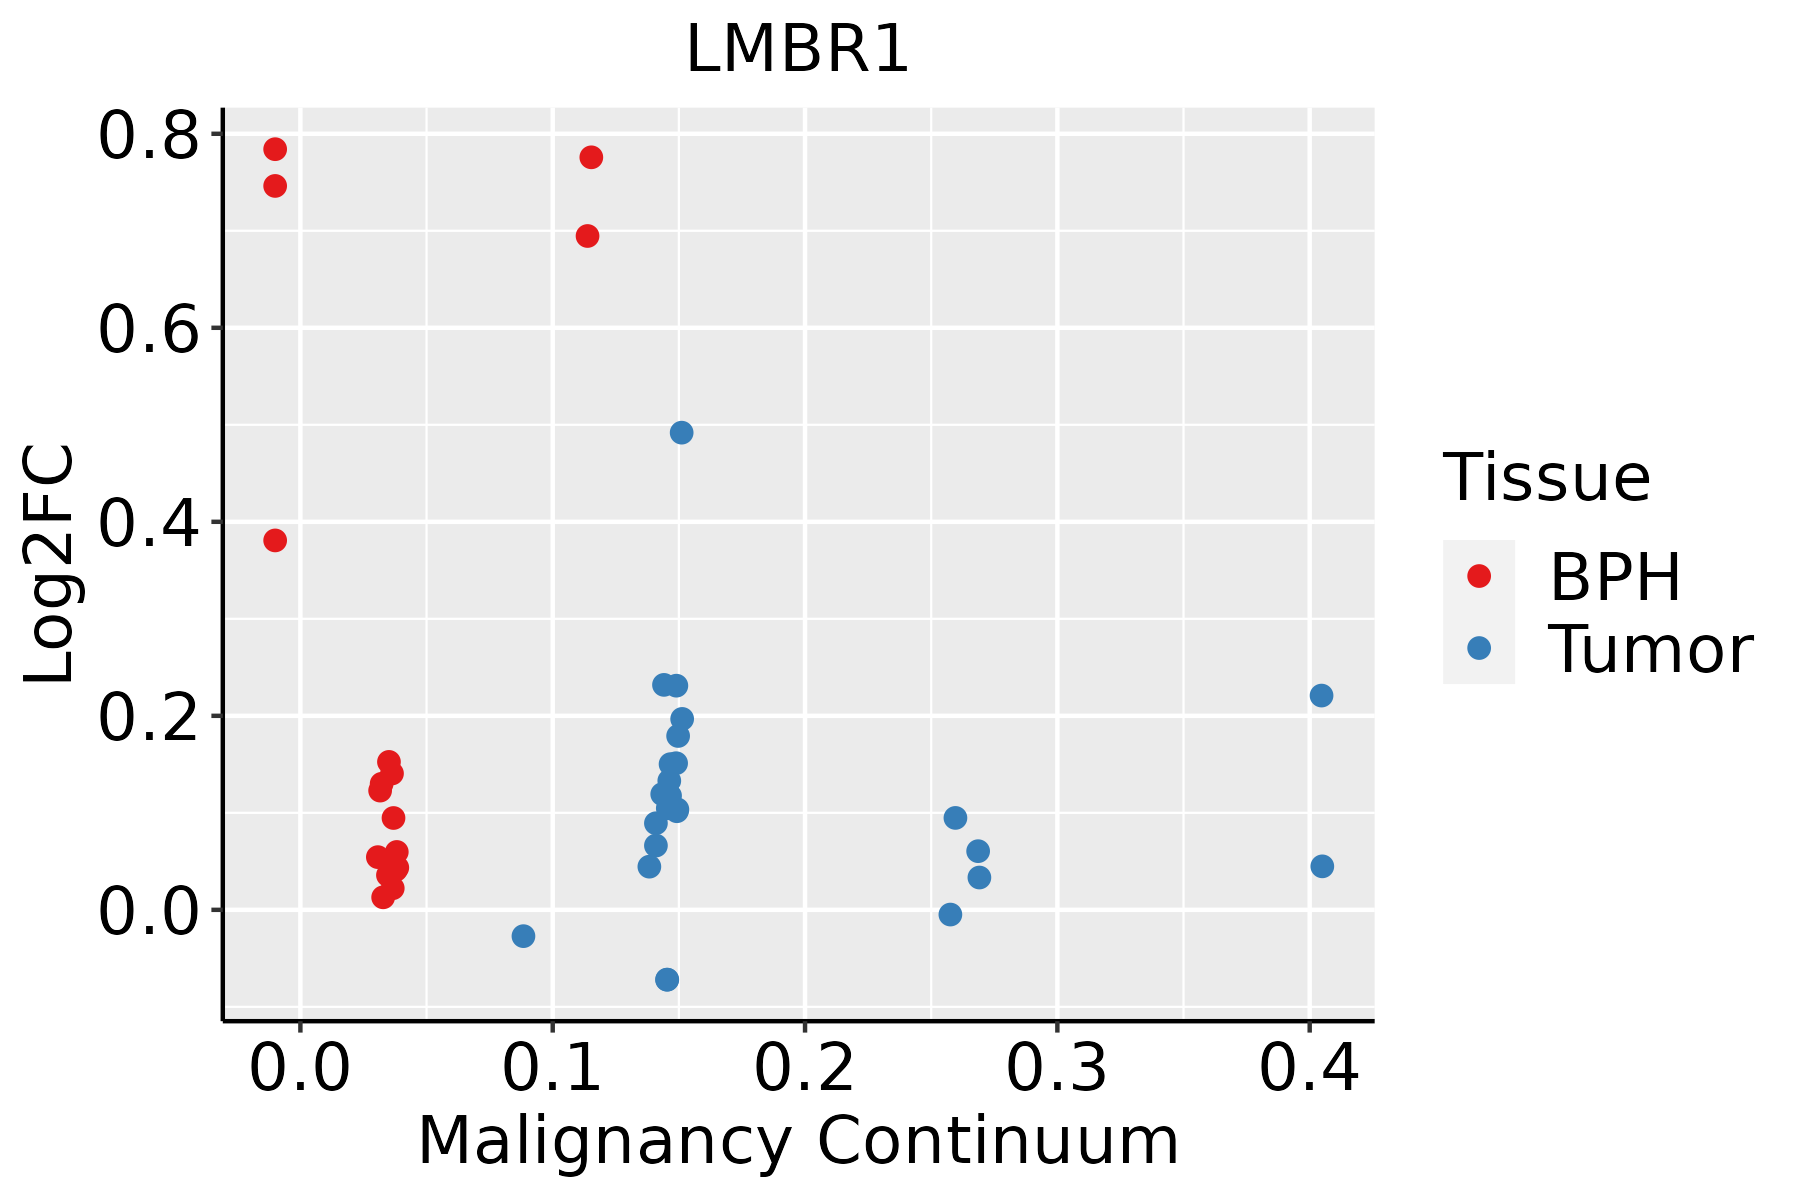 | BPH: Benign Prostatic Hyperplasia |
| ∗log2FC in expression of this searched gene in stem-like cells from each diseased tissue sample relative to stem-like cells in normal samples in each tissue plotted against the malignancy continuum. Samples are colored based on if they are from different disease stage. |
Top |
Malignant transformation related pathway analysis |
| Find out the enriched GO biological processes and KEGG pathways involved in transition from healthy to precancer to cancer |
| Tissue | Disease Stage | Enriched GO biological Processes |
| Colorectum | AD |  |
| Colorectum | SER |  |
| Colorectum | MSS |  |
| Colorectum | MSI-H |  |
| Colorectum | FAP |  |
| ∗Top 15 enriched GO BP terms are showed in the bar plot of each disease state in each tissue. Each row represents a significant GO biological process which is colored according to the -log10(p.adjust). |
| Page: 1 2 3 4 5 6 7 8 9 |
| GO ID | Tissue | Disease Stage | Description | Gene Ratio | Bg Ratio | pvalue | p.adjust | Count |
| GO:00487365 | Cervix | CC | appendage development | 35/2311 | 172/18723 | 1.88e-03 | 1.39e-02 | 35 |
| GO:00601735 | Cervix | CC | limb development | 35/2311 | 172/18723 | 1.88e-03 | 1.39e-02 | 35 |
| GO:0048736 | Colorectum | AD | appendage development | 51/3918 | 172/18723 | 4.20e-03 | 2.89e-02 | 51 |
| GO:0060173 | Colorectum | AD | limb development | 51/3918 | 172/18723 | 4.20e-03 | 2.89e-02 | 51 |
| GO:00351071 | Colorectum | FAP | appendage morphogenesis | 35/2622 | 138/18723 | 2.74e-04 | 3.66e-03 | 35 |
| GO:00351081 | Colorectum | FAP | limb morphogenesis | 35/2622 | 138/18723 | 2.74e-04 | 3.66e-03 | 35 |
| GO:00487363 | Colorectum | FAP | appendage development | 40/2622 | 172/18723 | 7.15e-04 | 7.66e-03 | 40 |
| GO:00601733 | Colorectum | FAP | limb development | 40/2622 | 172/18723 | 7.15e-04 | 7.66e-03 | 40 |
| GO:00351072 | Colorectum | CRC | appendage morphogenesis | 32/2078 | 138/18723 | 3.77e-05 | 9.26e-04 | 32 |
| GO:00351082 | Colorectum | CRC | limb morphogenesis | 32/2078 | 138/18723 | 3.77e-05 | 9.26e-04 | 32 |
| GO:00487364 | Colorectum | CRC | appendage development | 34/2078 | 172/18723 | 5.80e-04 | 7.89e-03 | 34 |
| GO:00601734 | Colorectum | CRC | limb development | 34/2078 | 172/18723 | 5.80e-04 | 7.89e-03 | 34 |
| GO:00351073 | Endometrium | AEH | appendage morphogenesis | 29/2100 | 138/18723 | 6.06e-04 | 5.94e-03 | 29 |
| GO:00351083 | Endometrium | AEH | limb morphogenesis | 29/2100 | 138/18723 | 6.06e-04 | 5.94e-03 | 29 |
| GO:00487366 | Endometrium | AEH | appendage development | 33/2100 | 172/18723 | 1.41e-03 | 1.18e-02 | 33 |
| GO:00601736 | Endometrium | AEH | limb development | 33/2100 | 172/18723 | 1.41e-03 | 1.18e-02 | 33 |
| GO:0030326 | Endometrium | AEH | embryonic limb morphogenesis | 23/2100 | 116/18723 | 4.58e-03 | 2.95e-02 | 23 |
| GO:0035113 | Endometrium | AEH | embryonic appendage morphogenesis | 23/2100 | 116/18723 | 4.58e-03 | 2.95e-02 | 23 |
| GO:003510711 | Endometrium | EEC | appendage morphogenesis | 29/2168 | 138/18723 | 1.01e-03 | 8.89e-03 | 29 |
| GO:003510811 | Endometrium | EEC | limb morphogenesis | 29/2168 | 138/18723 | 1.01e-03 | 8.89e-03 | 29 |
| Page: 1 2 3 4 |
| Pathway ID | Tissue | Disease Stage | Description | Gene Ratio | Bg Ratio | pvalue | p.adjust | qvalue | Count |
| Page: 1 |
Top |
Cell-cell communication analysis |
| Identification of potential cell-cell interactions between two cell types and their ligand-receptor pairs for different disease states |
| Ligand | Receptor | LRpair | Pathway | Tissue | Disease Stage |
| Page: 1 |
Top |
Single-cell gene regulatory network inference analysis |
| Find out the significant the regulons (TFs) and the target genes of each regulon across cell types for different disease states |
| TF | Cell Type | Tissue | Disease Stage | Target Gene | RSS | Regulon Activity |
| ∗The dot plots of a searched regulon are shown for all cell subpopulations in each disease state of each tissue based on the regulon specific score inferred using pySCENIC and by calculating the average expression. |
| Page: 1 |
Top |
Somatic mutation of malignant transformation related genes |
| Annotation of somatic variants for genes involved in malignant transformation |
| Hugo Symbol | Variant Class | Variant Classification | dbSNP RS | HGVSc | HGVSp | HGVSp Short | SWISSPROT | BIOTYPE | SIFT | PolyPhen | Tumor Sample Barcode | Tissue | Histology | Sex | Age | Stage | Therapy Types | Drugs | Outcome |
| LMBR1 | SNV | Missense_Mutation | novel | c.616N>T | p.Leu206Phe | p.L206F | Q8WVP7 | protein_coding | deleterious(0) | probably_damaging(0.998) | TCGA-D8-A73U-01 | Breast | breast invasive carcinoma | Female | >=65 | I/II | Hormone Therapy | tamoxiphen | SD |
| LMBR1 | deletion | Frame_Shift_Del | novel | c.436delN | p.Arg146AlafsTer3 | p.R146Afs*3 | Q8WVP7 | protein_coding | TCGA-D8-A27V-01 | Breast | breast invasive carcinoma | Female | <65 | I/II | Hormone Therapy | tamoxiphen | SD | ||
| LMBR1 | SNV | Missense_Mutation | c.1072N>A | p.Leu358Ile | p.L358I | Q8WVP7 | protein_coding | tolerated(0.05) | benign(0.433) | TCGA-AA-A010-01 | Colorectum | colon adenocarcinoma | Female | <65 | I/II | Chemotherapy | folinic | CR | |
| LMBR1 | SNV | Missense_Mutation | c.131G>T | p.Arg44Ile | p.R44I | Q8WVP7 | protein_coding | deleterious(0) | possibly_damaging(0.609) | TCGA-CA-6717-01 | Colorectum | colon adenocarcinoma | Male | <65 | I/II | Chemotherapy | oxaliplatin | CR | |
| LMBR1 | SNV | Missense_Mutation | rs371100043 | c.1214N>T | p.Ser405Leu | p.S405L | Q8WVP7 | protein_coding | deleterious(0) | probably_damaging(0.994) | TCGA-AG-3892-01 | Colorectum | rectum adenocarcinoma | Female | <65 | I/II | Unknown | Unknown | SD |
| LMBR1 | SNV | Missense_Mutation | novel | c.1369G>A | p.Glu457Lys | p.E457K | Q8WVP7 | protein_coding | deleterious(0.01) | benign(0.257) | TCGA-AG-A002-01 | Colorectum | rectum adenocarcinoma | Male | <65 | I/II | Unknown | Unknown | SD |
| LMBR1 | SNV | Missense_Mutation | novel | c.1382N>T | p.Ala461Val | p.A461V | Q8WVP7 | protein_coding | deleterious(0.04) | benign(0.007) | TCGA-EI-6917-01 | Colorectum | rectum adenocarcinoma | Male | <65 | III/IV | Chemotherapy | 5fluorouracil+oxaciplatina+l-folinian | SD |
| LMBR1 | SNV | Missense_Mutation | novel | c.708A>C | p.Gln236His | p.Q236H | Q8WVP7 | protein_coding | deleterious(0.02) | probably_damaging(0.996) | TCGA-A5-A0G2-01 | Endometrium | uterine corpus endometrioid carcinoma | Female | <65 | III/IV | Unknown | Unknown | SD |
| LMBR1 | SNV | Missense_Mutation | c.869G>T | p.Arg290Ile | p.R290I | Q8WVP7 | protein_coding | deleterious(0) | possibly_damaging(0.602) | TCGA-AP-A056-01 | Endometrium | uterine corpus endometrioid carcinoma | Female | <65 | I/II | Unknown | Unknown | SD | |
| LMBR1 | SNV | Missense_Mutation | c.688C>A | p.Leu230Ile | p.L230I | Q8WVP7 | protein_coding | deleterious(0.01) | probably_damaging(0.994) | TCGA-AP-A056-01 | Endometrium | uterine corpus endometrioid carcinoma | Female | <65 | I/II | Unknown | Unknown | SD |
| Page: 1 2 3 4 5 |
Top |
Related drugs of malignant transformation related genes |
| Identification of chemicals and drugs interact with genes involved in malignant transfromation |
| (DGIdb 4.0) |
| Entrez ID | Symbol | Category | Interaction Types | Drug Claim Name | Drug Name | PMIDs |
| Page: 1 |

Copyright 2023-Present -The University of Texas Health Science Center at Houston |