
|
|||||
|
 | |
| |
| |
| |
| |
| |
|
Gene: LMAN2 |
Gene summary for LMAN2 |
| Gene information | Species | Human | Gene symbol | LMAN2 | Gene ID | 10960 |
| Gene name | lectin, mannose binding 2 | |
| Gene Alias | C5orf8 | |
| Cytomap | 5q35.3 | |
| Gene Type | protein-coding | GO ID | GO:0006810 | UniProtAcc | Q12907 |
Top |
Malignant transformation analysis |
| Identification of the aberrant gene expression in precancerous and cancerous lesions by comparing the gene expression of stem-like cells in diseased tissues with normal stem cells |
| Entrez ID | Symbol | Replicates | Species | Organ | Tissue | Adj P-value | Log2FC | Malignancy |
| 10960 | LMAN2 | CA_HPV_1 | Human | Cervix | CC | 9.99e-13 | -3.37e-01 | 0.0264 |
| 10960 | LMAN2 | CCI_1 | Human | Cervix | CC | 2.60e-04 | -5.35e-01 | 0.528 |
| 10960 | LMAN2 | CCI_3 | Human | Cervix | CC | 1.12e-06 | -5.23e-01 | 0.516 |
| 10960 | LMAN2 | CCII_1 | Human | Cervix | CC | 1.07e-14 | -6.17e-01 | 0.3249 |
| 10960 | LMAN2 | Tumor | Human | Cervix | CC | 3.75e-02 | -2.44e-01 | 0.1241 |
| 10960 | LMAN2 | sample3 | Human | Cervix | CC | 5.49e-09 | -2.39e-01 | 0.1387 |
| 10960 | LMAN2 | L1 | Human | Cervix | CC | 4.37e-07 | -3.82e-01 | 0.0802 |
| 10960 | LMAN2 | T3 | Human | Cervix | CC | 4.52e-05 | -2.33e-01 | 0.1389 |
| 10960 | LMAN2 | HTA11_3410_2000001011 | Human | Colorectum | AD | 4.15e-12 | 2.76e-01 | 0.0155 |
| 10960 | LMAN2 | HTA11_2487_2000001011 | Human | Colorectum | SER | 2.21e-34 | 9.82e-01 | -0.1808 |
| 10960 | LMAN2 | HTA11_2951_2000001011 | Human | Colorectum | AD | 6.17e-03 | 4.23e-01 | 0.0216 |
| 10960 | LMAN2 | HTA11_1938_2000001011 | Human | Colorectum | AD | 1.51e-26 | 8.07e-01 | -0.0811 |
| 10960 | LMAN2 | HTA11_78_2000001011 | Human | Colorectum | AD | 2.76e-24 | 6.71e-01 | -0.1088 |
| 10960 | LMAN2 | HTA11_347_2000001011 | Human | Colorectum | AD | 1.52e-49 | 9.31e-01 | -0.1954 |
| 10960 | LMAN2 | HTA11_411_2000001011 | Human | Colorectum | SER | 1.23e-13 | 1.35e+00 | -0.2602 |
| 10960 | LMAN2 | HTA11_2112_2000001011 | Human | Colorectum | SER | 8.16e-08 | 1.01e+00 | -0.2196 |
| 10960 | LMAN2 | HTA11_3361_2000001011 | Human | Colorectum | AD | 2.16e-20 | 7.13e-01 | -0.1207 |
| 10960 | LMAN2 | HTA11_83_2000001011 | Human | Colorectum | SER | 4.08e-20 | 6.86e-01 | -0.1526 |
| 10960 | LMAN2 | HTA11_696_2000001011 | Human | Colorectum | AD | 1.23e-39 | 9.49e-01 | -0.1464 |
| 10960 | LMAN2 | HTA11_866_2000001011 | Human | Colorectum | AD | 2.69e-15 | 4.98e-01 | -0.1001 |
| Page: 1 2 3 4 5 6 7 8 9 10 |
| Tissue | Expression Dynamics | Abbreviation |
| Cervix | 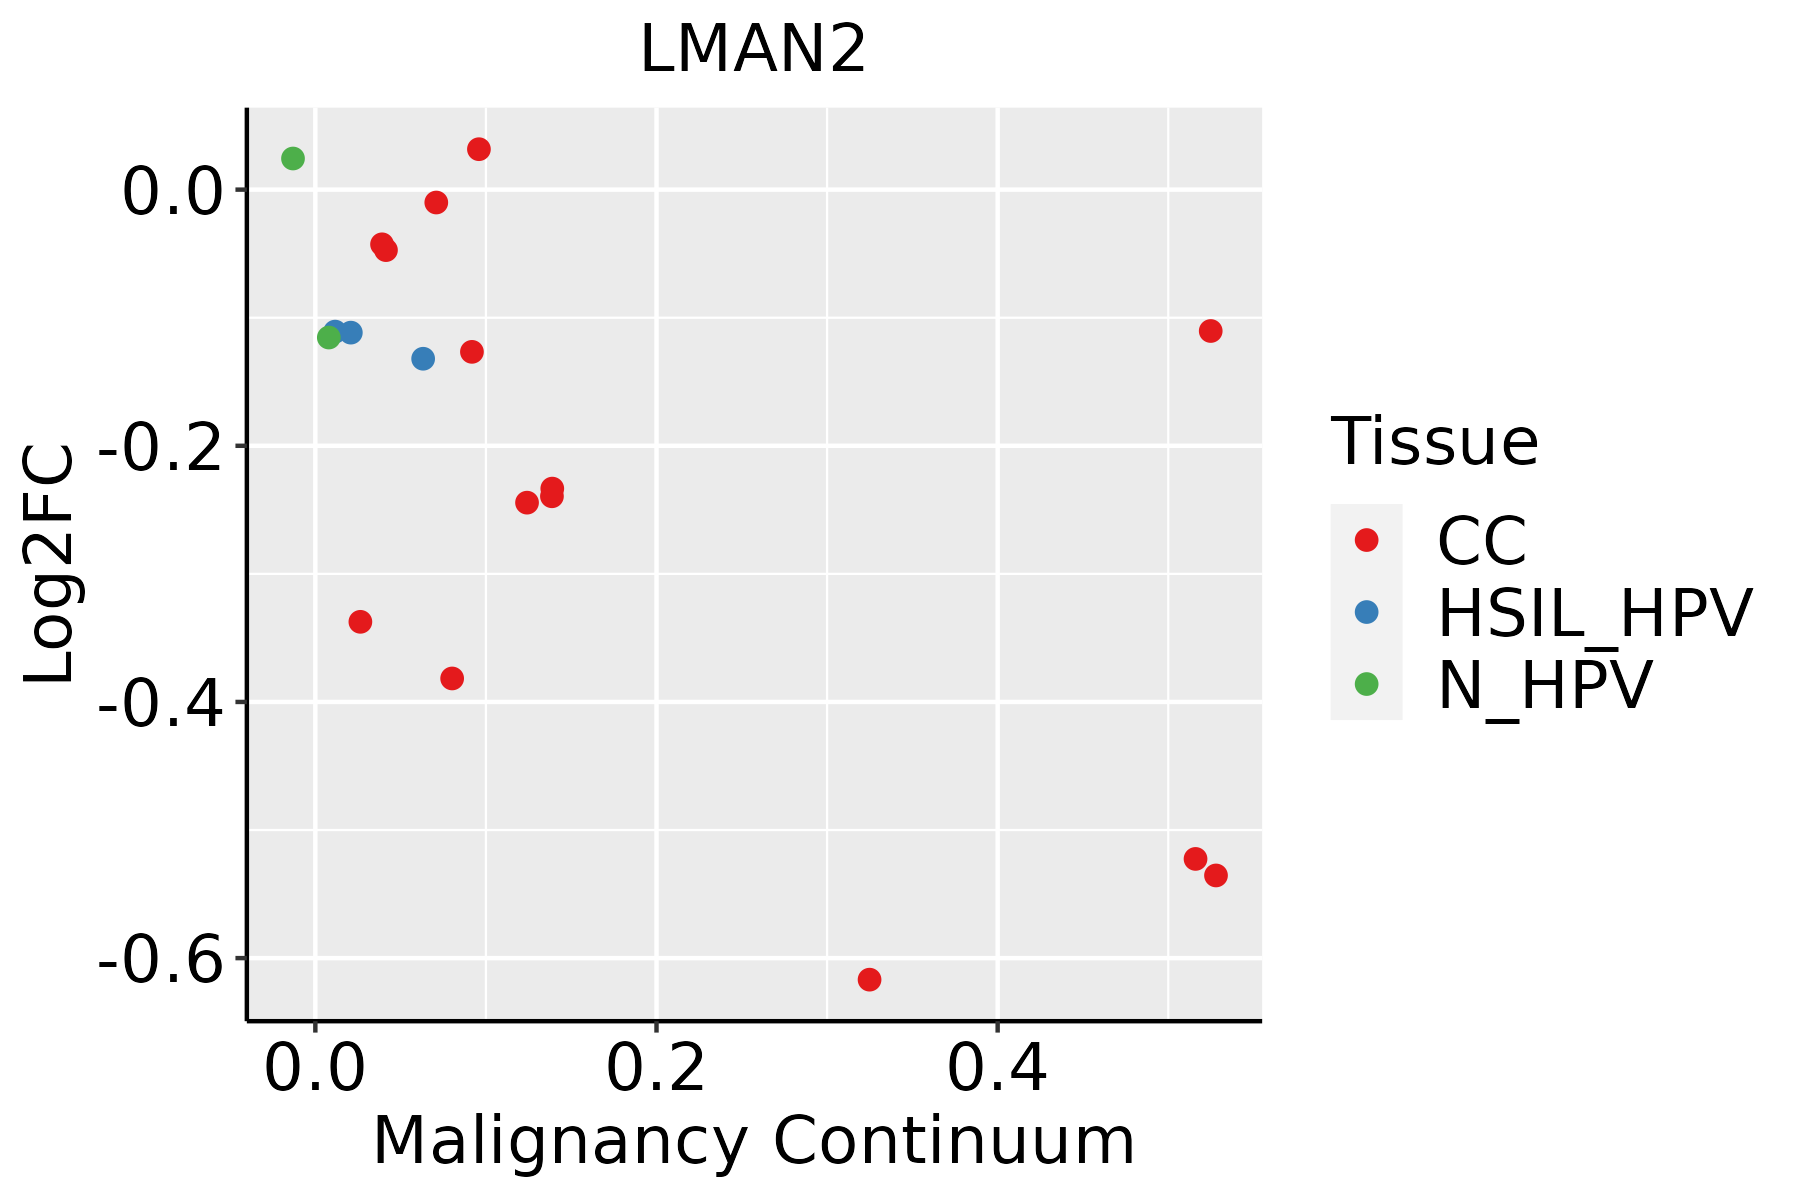 | CC: Cervix cancer |
| HSIL_HPV: HPV-infected high-grade squamous intraepithelial lesions | ||
| N_HPV: HPV-infected normal cervix | ||
| Colorectum (GSE201348) | 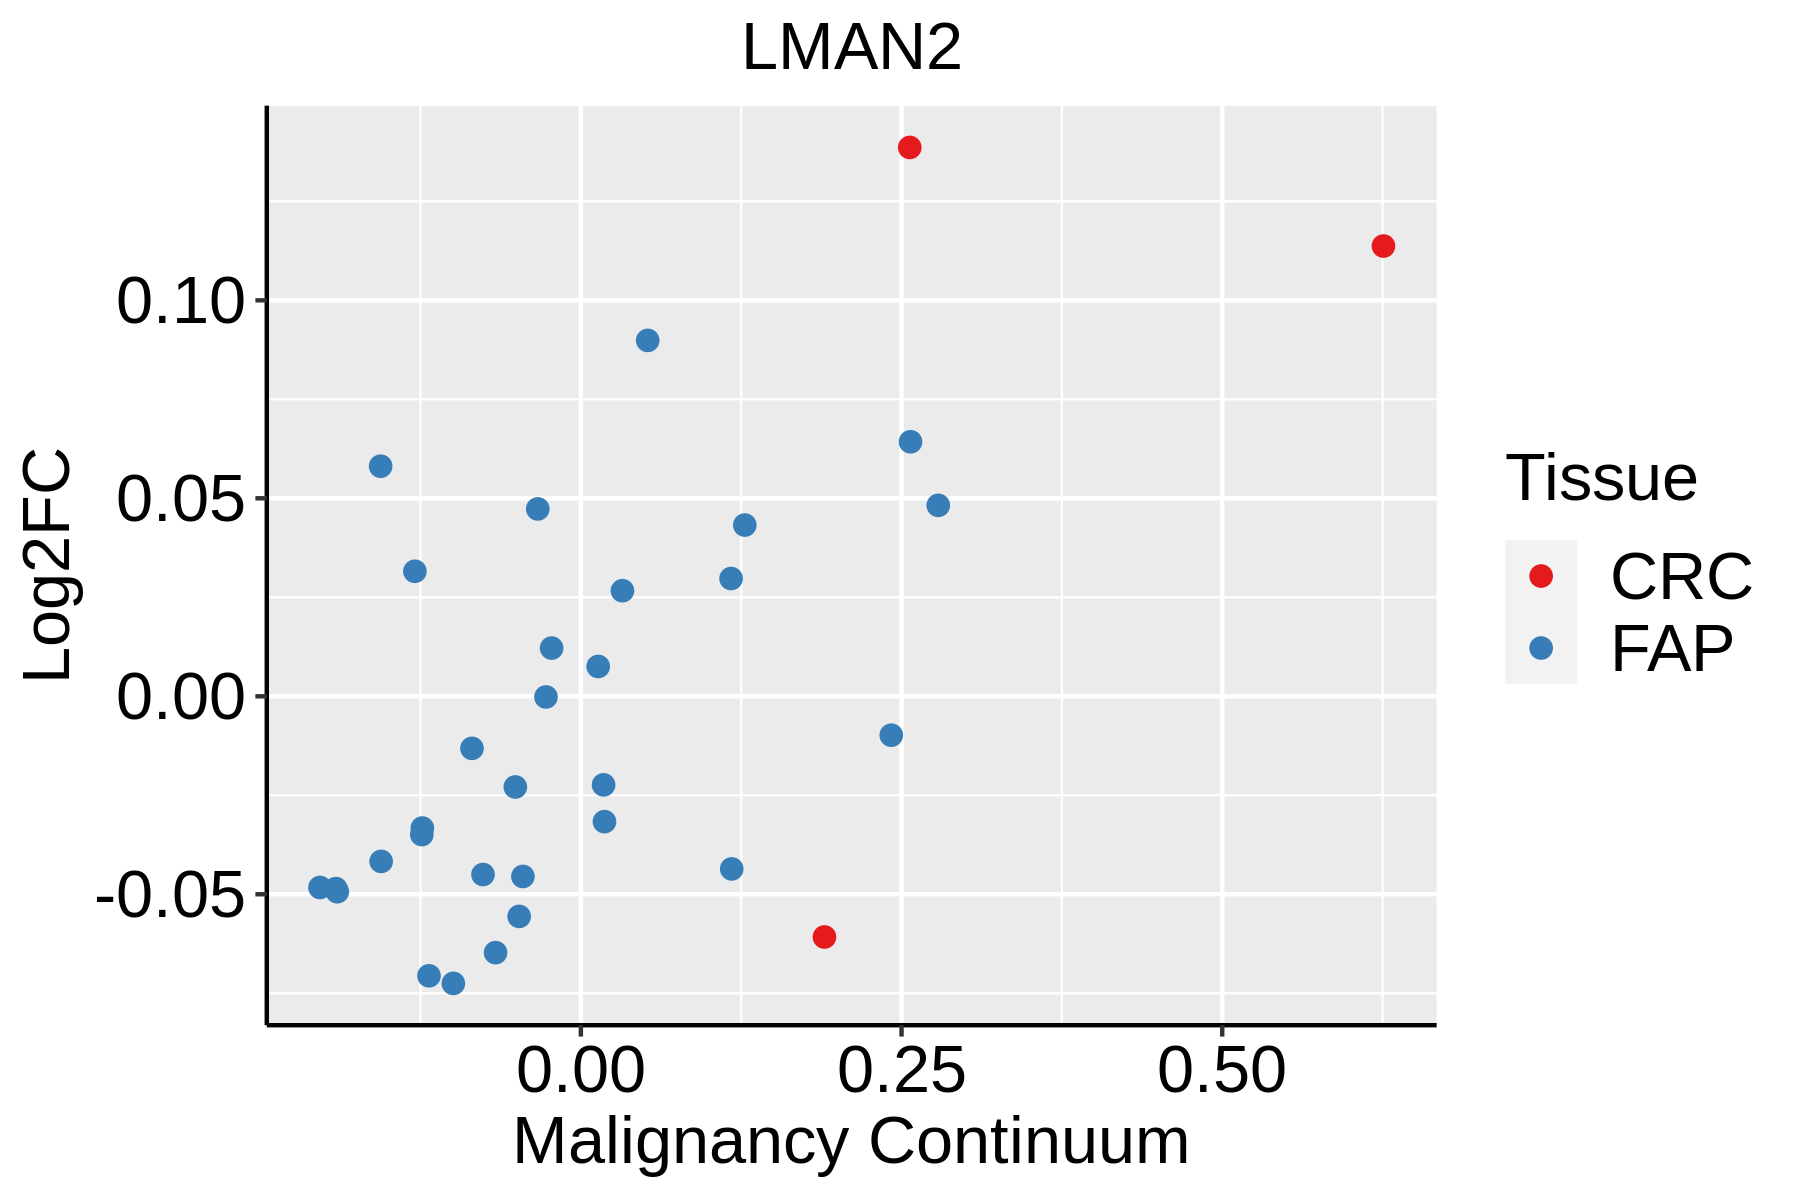 | FAP: Familial adenomatous polyposis |
| CRC: Colorectal cancer | ||
| Colorectum (HTA11) |  | AD: Adenomas |
| SER: Sessile serrated lesions | ||
| MSI-H: Microsatellite-high colorectal cancer | ||
| MSS: Microsatellite stable colorectal cancer | ||
| Endometrium |  | AEH: Atypical endometrial hyperplasia |
| EEC: Endometrioid Cancer | ||
| Esophagus |  | ESCC: Esophageal squamous cell carcinoma |
| HGIN: High-grade intraepithelial neoplasias | ||
| LGIN: Low-grade intraepithelial neoplasias | ||
| Liver | 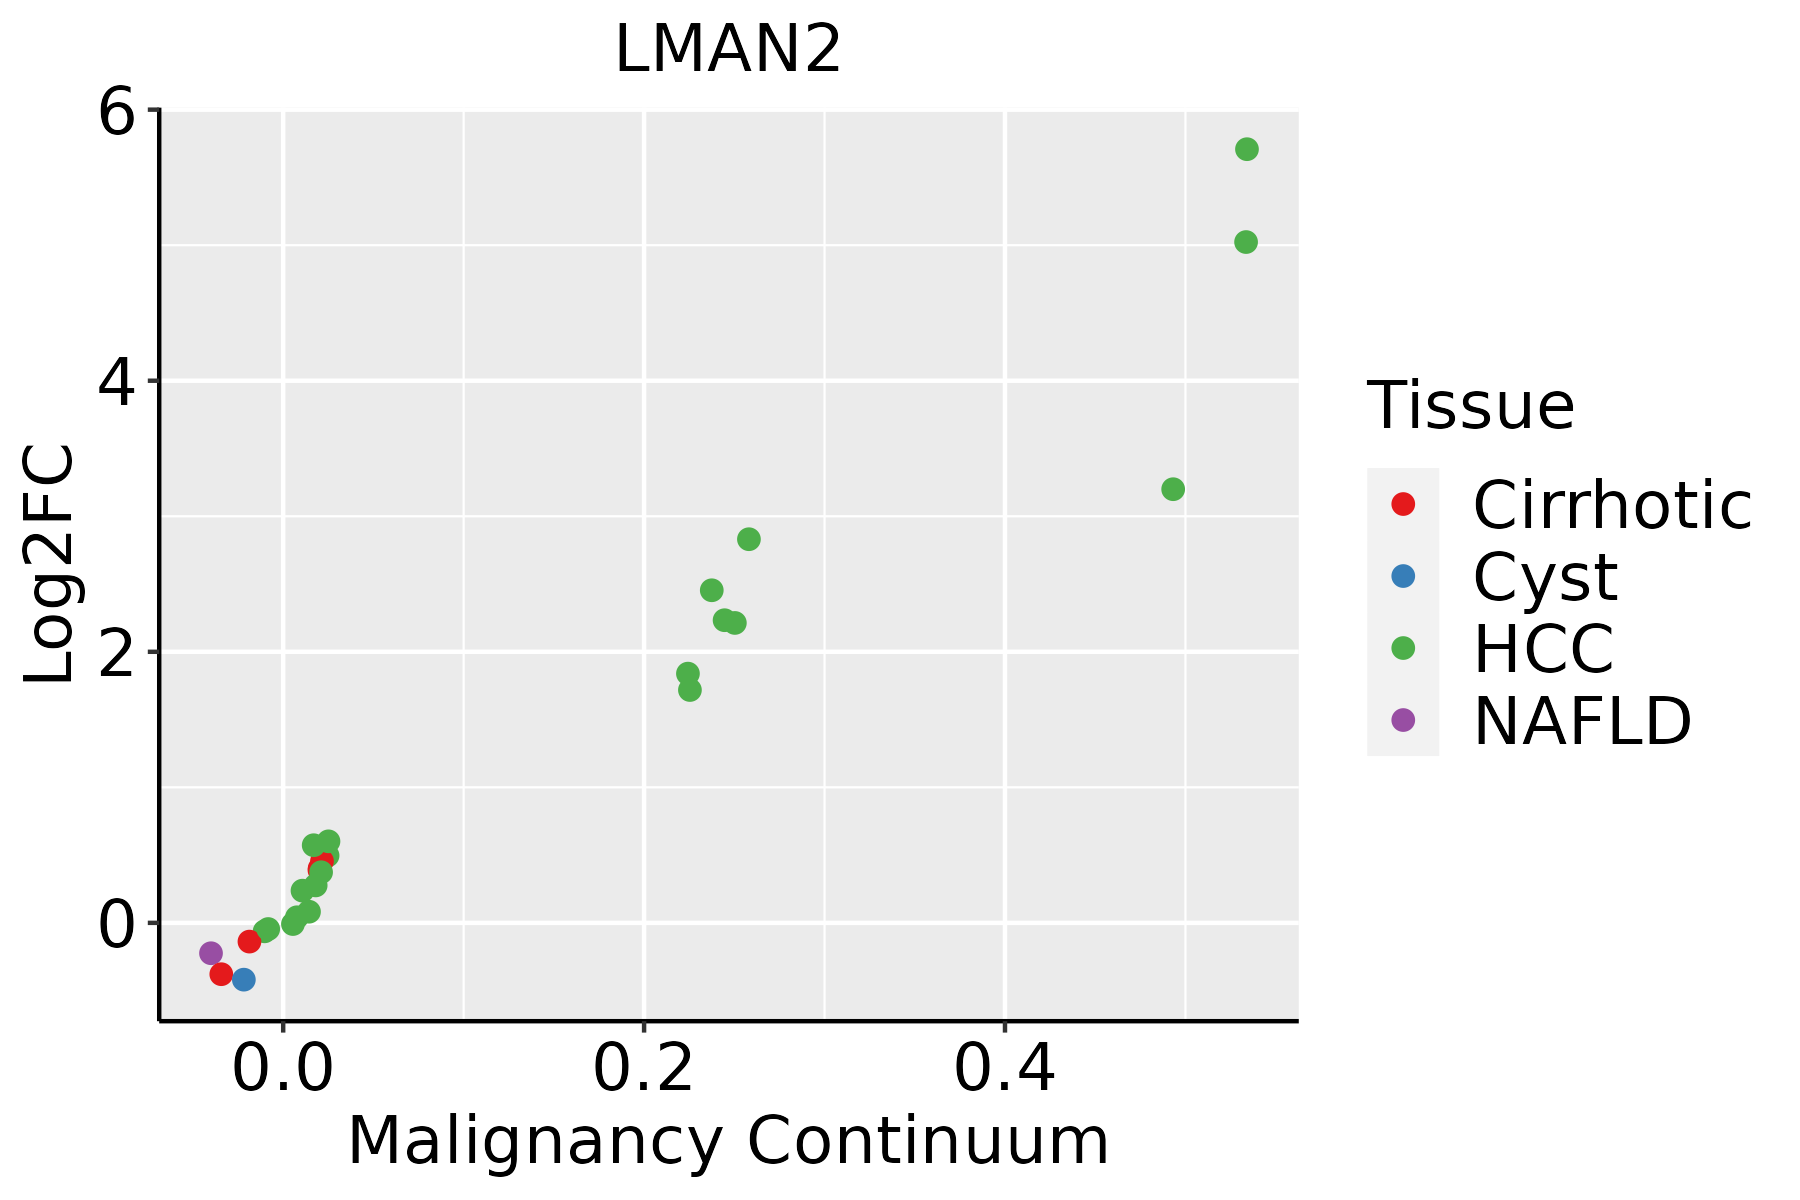 | HCC: Hepatocellular carcinoma |
| NAFLD: Non-alcoholic fatty liver disease | ||
| Oral Cavity | 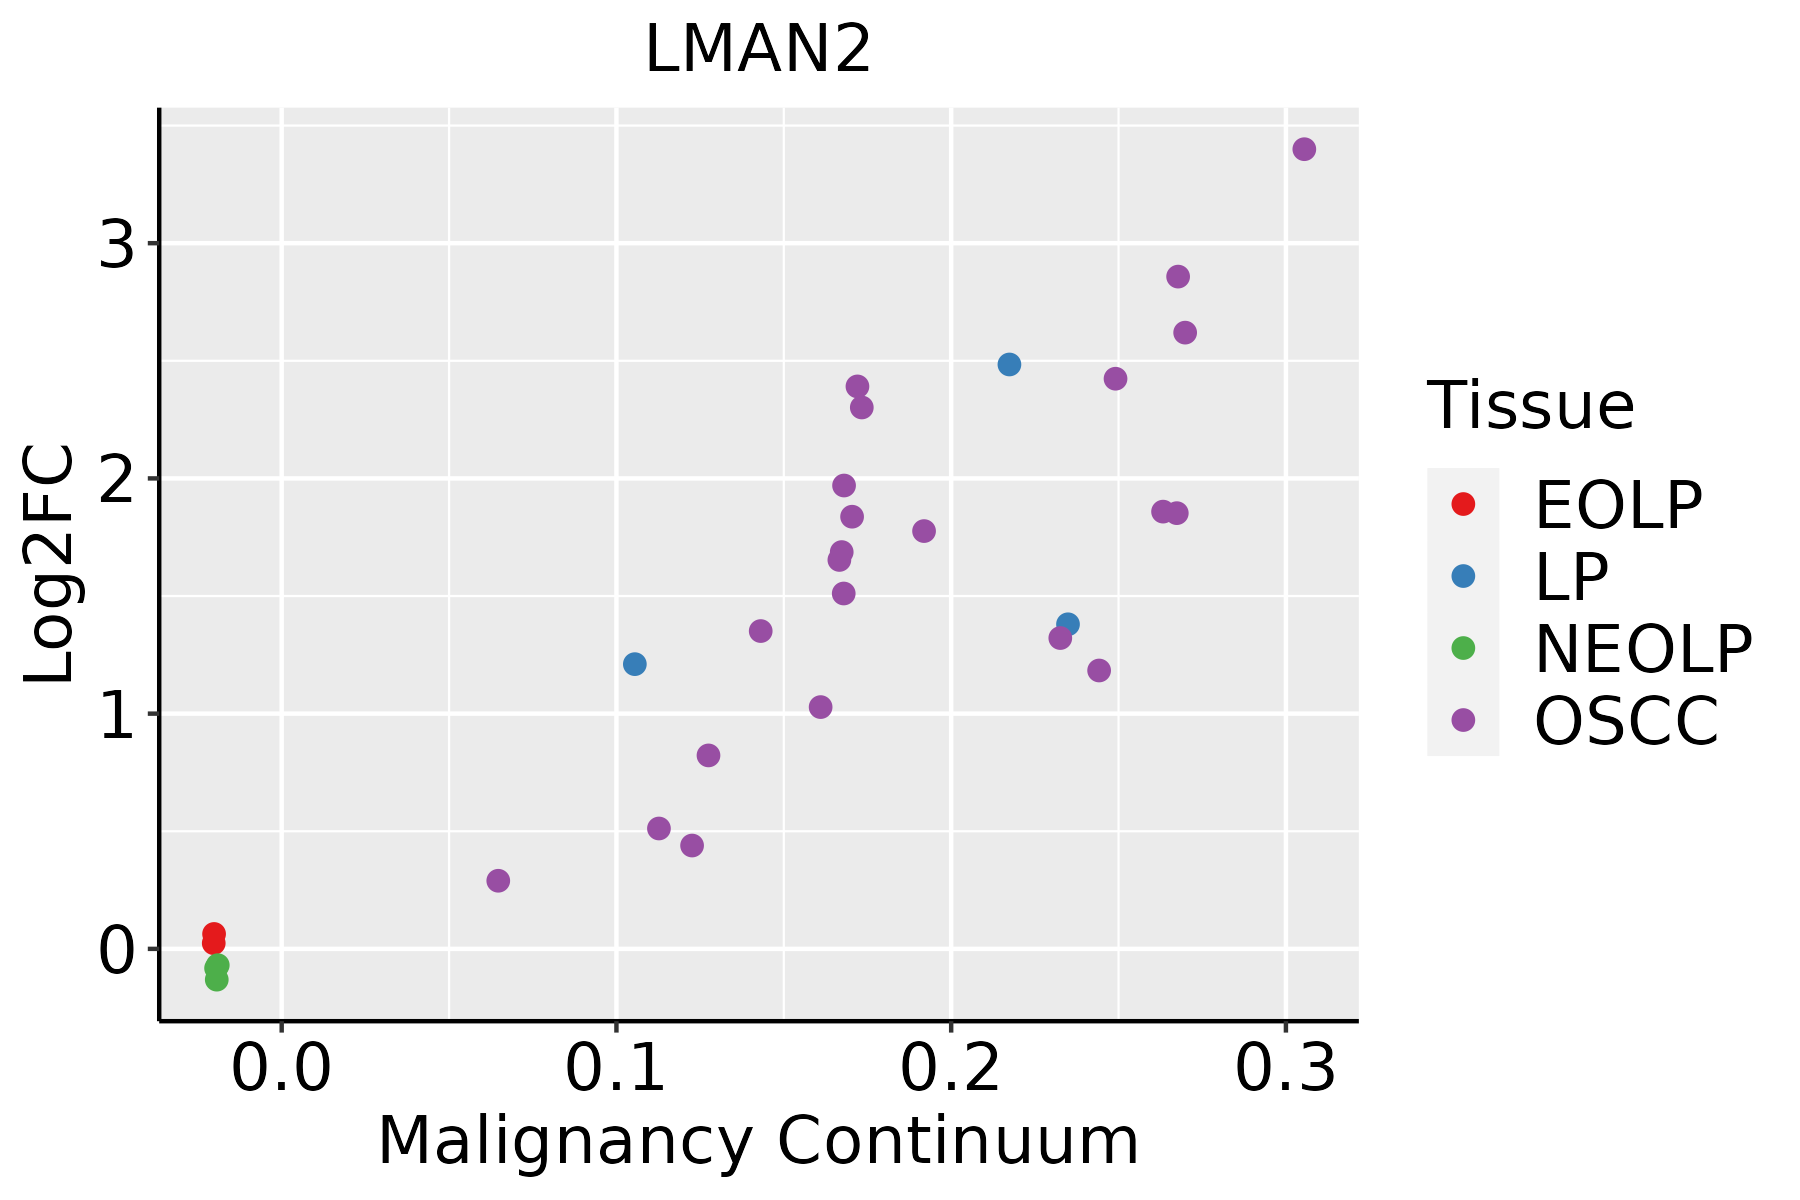 | EOLP: Erosive Oral lichen planus |
| LP: leukoplakia | ||
| NEOLP: Non-erosive oral lichen planus | ||
| OSCC: Oral squamous cell carcinoma | ||
| Skin | 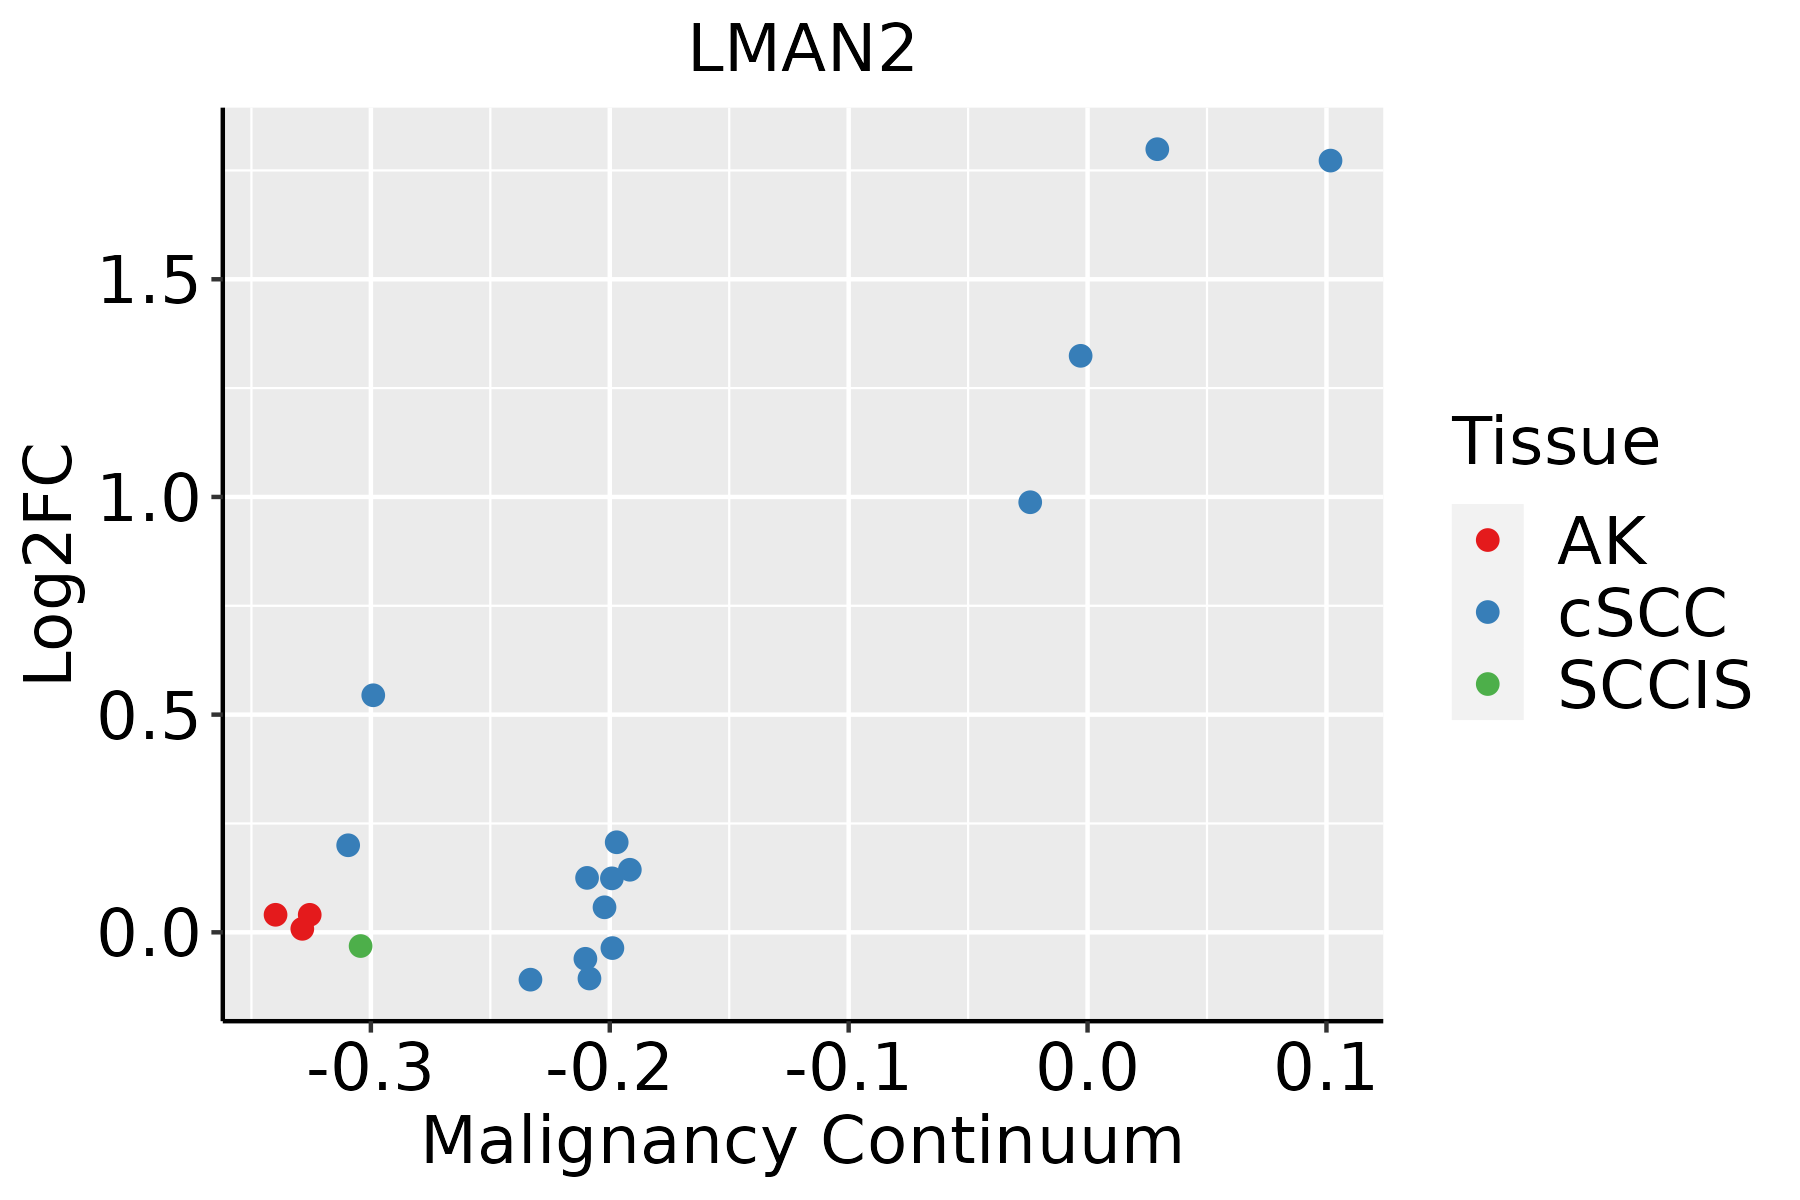 | AK: Actinic keratosis |
| cSCC: Cutaneous squamous cell carcinoma | ||
| SCCIS:squamous cell carcinoma in situ | ||
| Thyroid | 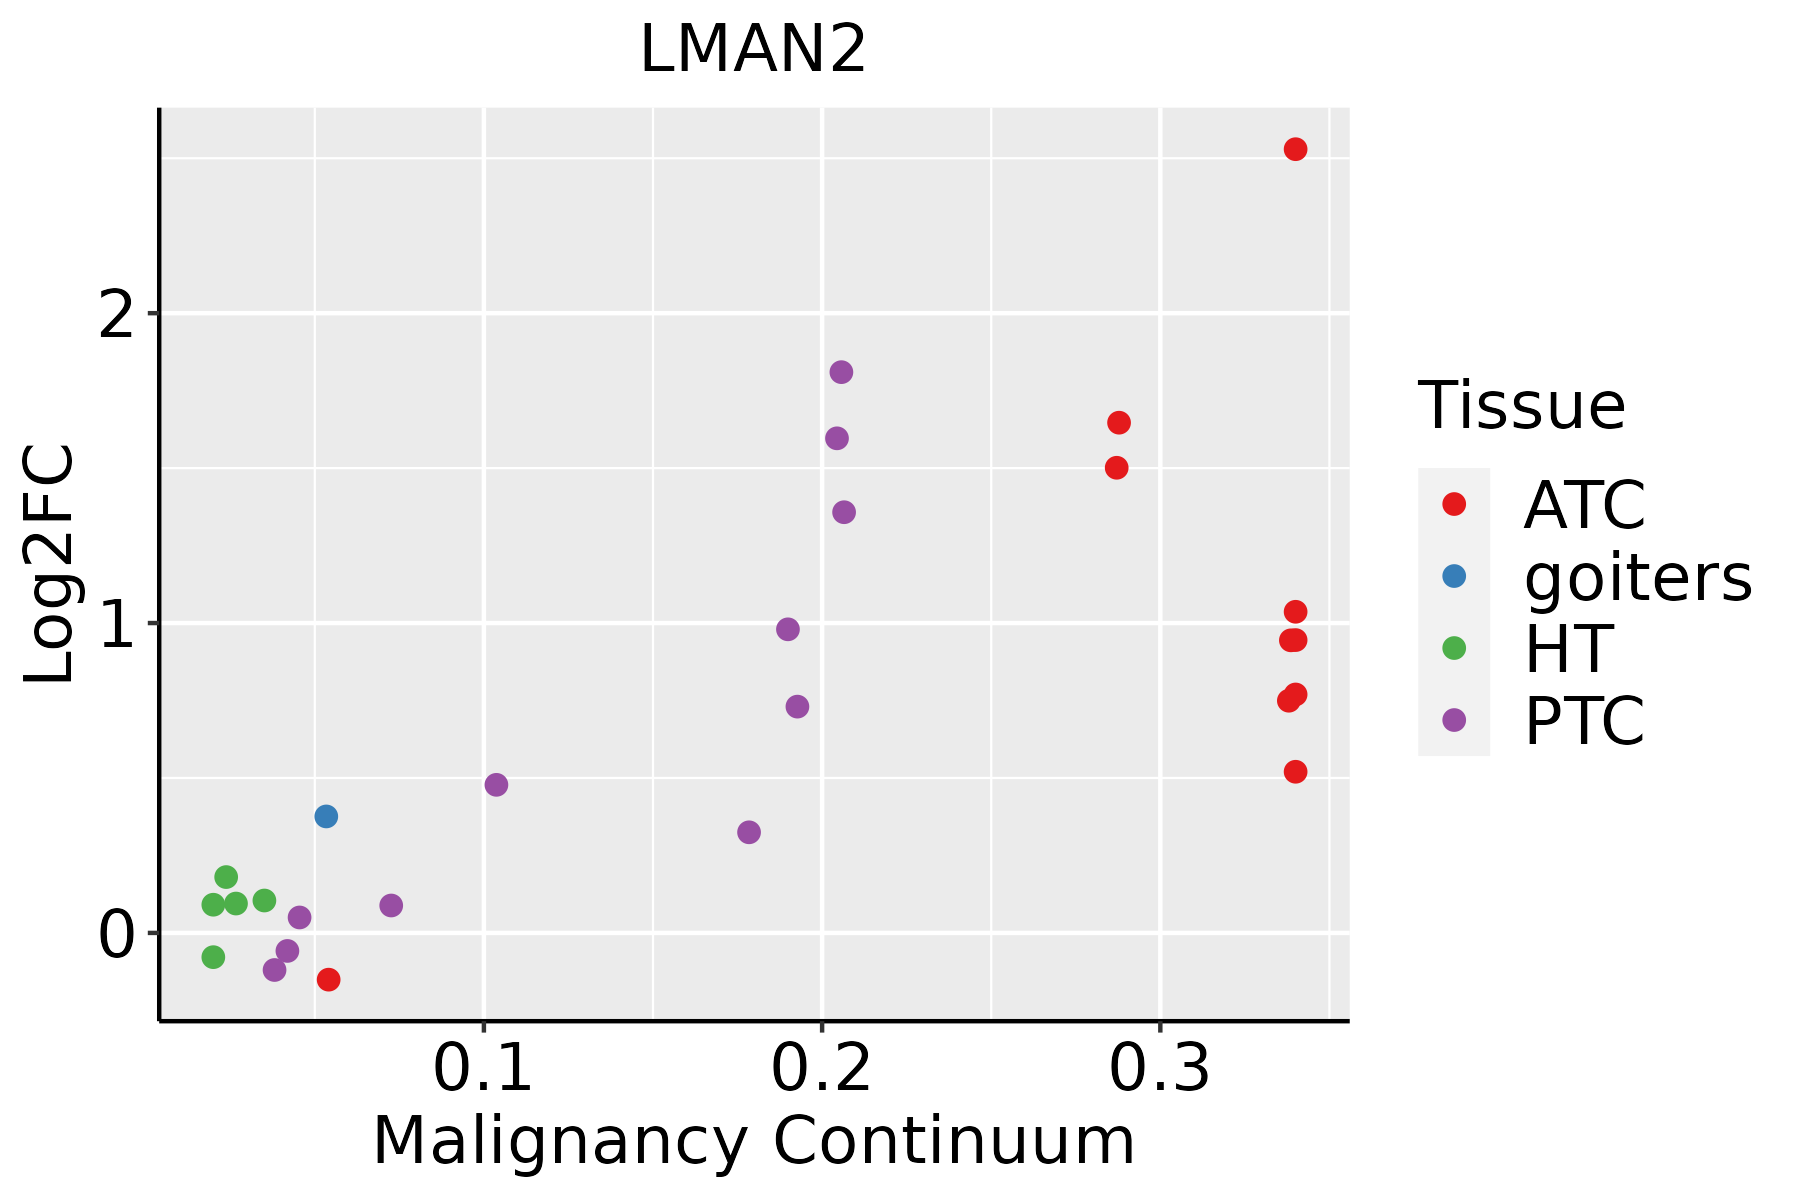 | ATC: Anaplastic thyroid cancer |
| HT: Hashimoto's thyroiditis | ||
| PTC: Papillary thyroid cancer |
| ∗log2FC in expression of this searched gene in stem-like cells from each diseased tissue sample relative to stem-like cells in normal samples in each tissue plotted against the malignancy continuum. Samples are colored based on if they are from different disease stage. |
Top |
Malignant transformation related pathway analysis |
| Find out the enriched GO biological processes and KEGG pathways involved in transition from healthy to precancer to cancer |
| Tissue | Disease Stage | Enriched GO biological Processes |
| Colorectum | AD |  |
| Colorectum | SER |  |
| Colorectum | MSS |  |
| Colorectum | MSI-H |  |
| Colorectum | FAP |  |
| ∗Top 15 enriched GO BP terms are showed in the bar plot of each disease state in each tissue. Each row represents a significant GO biological process which is colored according to the -log10(p.adjust). |
| Page: 1 2 3 4 5 6 7 8 9 |
| GO ID | Tissue | Disease Stage | Description | Gene Ratio | Bg Ratio | pvalue | p.adjust | Count |
| GO:00481938 | Cervix | CC | Golgi vesicle transport | 58/2311 | 296/18723 | 2.24e-04 | 2.54e-03 | 58 |
| GO:00507642 | Cervix | CC | regulation of phagocytosis | 23/2311 | 95/18723 | 1.03e-03 | 8.57e-03 | 23 |
| GO:00068907 | Cervix | CC | retrograde vesicle-mediated transport, Golgi to endoplasmic reticulum | 15/2311 | 52/18723 | 1.15e-03 | 9.39e-03 | 15 |
| GO:00070304 | Cervix | CC | Golgi organization | 32/2311 | 157/18723 | 2.78e-03 | 1.87e-02 | 32 |
| GO:00507662 | Cervix | CC | positive regulation of phagocytosis | 16/2311 | 66/18723 | 5.58e-03 | 3.22e-02 | 16 |
| GO:0006909 | Cervix | CC | phagocytosis | 53/2311 | 308/18723 | 7.49e-03 | 4.01e-02 | 53 |
| GO:0048193 | Colorectum | AD | Golgi vesicle transport | 109/3918 | 296/18723 | 1.80e-10 | 1.68e-08 | 109 |
| GO:0006890 | Colorectum | AD | retrograde vesicle-mediated transport, Golgi to endoplasmic reticulum | 27/3918 | 52/18723 | 7.67e-07 | 2.70e-05 | 27 |
| GO:0006888 | Colorectum | AD | endoplasmic reticulum to Golgi vesicle-mediated transport | 44/3918 | 130/18723 | 4.13e-04 | 4.68e-03 | 44 |
| GO:0007029 | Colorectum | AD | endoplasmic reticulum organization | 31/3918 | 87/18723 | 1.08e-03 | 1.00e-02 | 31 |
| GO:00481931 | Colorectum | SER | Golgi vesicle transport | 79/2897 | 296/18723 | 4.20e-07 | 2.15e-05 | 79 |
| GO:00068901 | Colorectum | SER | retrograde vesicle-mediated transport, Golgi to endoplasmic reticulum | 20/2897 | 52/18723 | 4.80e-05 | 1.18e-03 | 20 |
| GO:00068881 | Colorectum | SER | endoplasmic reticulum to Golgi vesicle-mediated transport | 34/2897 | 130/18723 | 1.13e-03 | 1.29e-02 | 34 |
| GO:00070291 | Colorectum | SER | endoplasmic reticulum organization | 23/2897 | 87/18723 | 5.77e-03 | 4.23e-02 | 23 |
| GO:00481932 | Colorectum | MSS | Golgi vesicle transport | 101/3467 | 296/18723 | 9.09e-11 | 9.77e-09 | 101 |
| GO:00068902 | Colorectum | MSS | retrograde vesicle-mediated transport, Golgi to endoplasmic reticulum | 26/3467 | 52/18723 | 2.66e-07 | 1.10e-05 | 26 |
| GO:00068882 | Colorectum | MSS | endoplasmic reticulum to Golgi vesicle-mediated transport | 44/3467 | 130/18723 | 2.17e-05 | 4.60e-04 | 44 |
| GO:00068903 | Colorectum | MSI-H | retrograde vesicle-mediated transport, Golgi to endoplasmic reticulum | 13/1319 | 52/18723 | 4.72e-05 | 1.69e-03 | 13 |
| GO:00068883 | Colorectum | MSI-H | endoplasmic reticulum to Golgi vesicle-mediated transport | 22/1319 | 130/18723 | 1.05e-04 | 3.24e-03 | 22 |
| GO:00481933 | Colorectum | MSI-H | Golgi vesicle transport | 39/1319 | 296/18723 | 1.17e-04 | 3.51e-03 | 39 |
| Page: 1 2 3 4 |
| Pathway ID | Tissue | Disease Stage | Description | Gene Ratio | Bg Ratio | pvalue | p.adjust | qvalue | Count |
| hsa0414120 | Cervix | CC | Protein processing in endoplasmic reticulum | 55/1267 | 174/8465 | 1.74e-08 | 2.68e-07 | 1.58e-07 | 55 |
| hsa04141110 | Cervix | CC | Protein processing in endoplasmic reticulum | 55/1267 | 174/8465 | 1.74e-08 | 2.68e-07 | 1.58e-07 | 55 |
| hsa04141 | Colorectum | AD | Protein processing in endoplasmic reticulum | 80/2092 | 174/8465 | 5.96e-10 | 1.25e-08 | 7.96e-09 | 80 |
| hsa041411 | Colorectum | AD | Protein processing in endoplasmic reticulum | 80/2092 | 174/8465 | 5.96e-10 | 1.25e-08 | 7.96e-09 | 80 |
| hsa041412 | Colorectum | SER | Protein processing in endoplasmic reticulum | 60/1580 | 174/8465 | 4.20e-07 | 7.33e-06 | 5.32e-06 | 60 |
| hsa041413 | Colorectum | SER | Protein processing in endoplasmic reticulum | 60/1580 | 174/8465 | 4.20e-07 | 7.33e-06 | 5.32e-06 | 60 |
| hsa041414 | Colorectum | MSS | Protein processing in endoplasmic reticulum | 75/1875 | 174/8465 | 3.78e-10 | 8.44e-09 | 5.17e-09 | 75 |
| hsa041415 | Colorectum | MSS | Protein processing in endoplasmic reticulum | 75/1875 | 174/8465 | 3.78e-10 | 8.44e-09 | 5.17e-09 | 75 |
| hsa041416 | Colorectum | MSI-H | Protein processing in endoplasmic reticulum | 46/797 | 174/8465 | 4.53e-11 | 9.78e-10 | 8.19e-10 | 46 |
| hsa041417 | Colorectum | MSI-H | Protein processing in endoplasmic reticulum | 46/797 | 174/8465 | 4.53e-11 | 9.78e-10 | 8.19e-10 | 46 |
| hsa0414126 | Endometrium | AEH | Protein processing in endoplasmic reticulum | 62/1197 | 174/8465 | 5.97e-13 | 1.39e-11 | 1.01e-11 | 62 |
| hsa04141111 | Endometrium | AEH | Protein processing in endoplasmic reticulum | 62/1197 | 174/8465 | 5.97e-13 | 1.39e-11 | 1.01e-11 | 62 |
| hsa0414127 | Endometrium | EEC | Protein processing in endoplasmic reticulum | 64/1237 | 174/8465 | 2.17e-13 | 5.09e-12 | 3.80e-12 | 64 |
| hsa0414136 | Endometrium | EEC | Protein processing in endoplasmic reticulum | 64/1237 | 174/8465 | 2.17e-13 | 5.09e-12 | 3.80e-12 | 64 |
| hsa04141211 | Esophagus | ESCC | Protein processing in endoplasmic reticulum | 147/4205 | 174/8465 | 3.29e-22 | 1.10e-19 | 5.64e-20 | 147 |
| hsa04141310 | Esophagus | ESCC | Protein processing in endoplasmic reticulum | 147/4205 | 174/8465 | 3.29e-22 | 1.10e-19 | 5.64e-20 | 147 |
| hsa0414114 | Liver | Cirrhotic | Protein processing in endoplasmic reticulum | 114/2530 | 174/8465 | 1.16e-22 | 9.67e-21 | 5.96e-21 | 114 |
| hsa0414115 | Liver | Cirrhotic | Protein processing in endoplasmic reticulum | 114/2530 | 174/8465 | 1.16e-22 | 9.67e-21 | 5.96e-21 | 114 |
| hsa0414122 | Liver | HCC | Protein processing in endoplasmic reticulum | 146/4020 | 174/8465 | 7.34e-24 | 2.46e-21 | 1.37e-21 | 146 |
| hsa0414132 | Liver | HCC | Protein processing in endoplasmic reticulum | 146/4020 | 174/8465 | 7.34e-24 | 2.46e-21 | 1.37e-21 | 146 |
| Page: 1 2 |
Top |
Cell-cell communication analysis |
| Identification of potential cell-cell interactions between two cell types and their ligand-receptor pairs for different disease states |
| Ligand | Receptor | LRpair | Pathway | Tissue | Disease Stage |
| Page: 1 |
Top |
Single-cell gene regulatory network inference analysis |
| Find out the significant the regulons (TFs) and the target genes of each regulon across cell types for different disease states |
| TF | Cell Type | Tissue | Disease Stage | Target Gene | RSS | Regulon Activity |
| ∗The dot plots of a searched regulon are shown for all cell subpopulations in each disease state of each tissue based on the regulon specific score inferred using pySCENIC and by calculating the average expression. |
| Page: 1 |
Top |
Somatic mutation of malignant transformation related genes |
| Annotation of somatic variants for genes involved in malignant transformation |
| Hugo Symbol | Variant Class | Variant Classification | dbSNP RS | HGVSc | HGVSp | HGVSp Short | SWISSPROT | BIOTYPE | SIFT | PolyPhen | Tumor Sample Barcode | Tissue | Histology | Sex | Age | Stage | Therapy Types | Drugs | Outcome |
| LMAN2 | SNV | Missense_Mutation | c.106C>G | p.Leu36Val | p.L36V | Q12907 | protein_coding | tolerated(0.15) | benign(0.063) | TCGA-AN-A0XW-01 | Breast | breast invasive carcinoma | Female | <65 | III/IV | Unknown | Unknown | SD | |
| LMAN2 | SNV | Missense_Mutation | c.157N>T | p.His53Tyr | p.H53Y | Q12907 | protein_coding | tolerated(1) | benign(0.006) | TCGA-AO-A124-01 | Breast | breast invasive carcinoma | Female | <65 | I/II | Chemotherapy | doxorubicin | SD | |
| LMAN2 | SNV | Missense_Mutation | c.788N>T | p.Ser263Phe | p.S263F | Q12907 | protein_coding | deleterious(0) | probably_damaging(0.985) | TCGA-D8-A1JA-01 | Breast | breast invasive carcinoma | Female | <65 | III/IV | Chemotherapy | adriamycin | PD | |
| LMAN2 | deletion | Frame_Shift_Del | novel | c.18delN | p.Trp6Ter | p.W6* | Q12907 | protein_coding | TCGA-EW-A2FV-01 | Breast | breast invasive carcinoma | Female | <65 | III/IV | Chemotherapy | docetaxel | SD | ||
| LMAN2 | SNV | Missense_Mutation | c.998G>C | p.Gly333Ala | p.G333A | Q12907 | protein_coding | tolerated(0.24) | probably_damaging(0.992) | TCGA-2W-A8YY-01 | Cervix | cervical & endocervical cancer | Female | <65 | I/II | Chemotherapy | cisplatin | CR | |
| LMAN2 | SNV | Missense_Mutation | c.862N>C | p.Asp288His | p.D288H | Q12907 | protein_coding | deleterious(0.04) | probably_damaging(0.996) | TCGA-DS-A1OC-01 | Cervix | cervical & endocervical cancer | Female | <65 | I/II | Chemotherapy | gemcitabine | SD | |
| LMAN2 | SNV | Missense_Mutation | c.88N>G | p.Thr30Ala | p.T30A | Q12907 | protein_coding | tolerated(0.21) | benign(0) | TCGA-AA-3510-01 | Colorectum | colon adenocarcinoma | Male | >=65 | I/II | Unknown | Unknown | SD | |
| LMAN2 | SNV | Missense_Mutation | rs770972790 | c.515G>A | p.Arg172His | p.R172H | Q12907 | protein_coding | tolerated(0.82) | probably_damaging(0.996) | TCGA-AZ-6598-01 | Colorectum | colon adenocarcinoma | Female | >=65 | I/II | Unknown | Unknown | SD |
| LMAN2 | SNV | Missense_Mutation | rs775457049 | c.1061N>A | p.Arg354His | p.R354H | Q12907 | protein_coding | deleterious(0.02) | probably_damaging(0.98) | TCGA-F4-6856-01 | Colorectum | colon adenocarcinoma | Male | <65 | I/II | Ancillary | leucovorin | CR |
| LMAN2 | SNV | Missense_Mutation | novel | c.572G>A | p.Ser191Asn | p.S191N | Q12907 | protein_coding | tolerated(0.06) | benign(0.028) | TCGA-AG-A002-01 | Colorectum | rectum adenocarcinoma | Male | <65 | I/II | Unknown | Unknown | SD |
| Page: 1 2 3 4 |
Top |
Related drugs of malignant transformation related genes |
| Identification of chemicals and drugs interact with genes involved in malignant transfromation |
| (DGIdb 4.0) |
| Entrez ID | Symbol | Category | Interaction Types | Drug Claim Name | Drug Name | PMIDs |
| Page: 1 |

Copyright 2023-Present -The University of Texas Health Science Center at Houston |