
|
|||||
|
 | |
| |
| |
| |
| |
| |
|
Gene: LMAN1 |
Gene summary for LMAN1 |
| Gene information | Species | Human | Gene symbol | LMAN1 | Gene ID | 3998 |
| Gene name | lectin, mannose binding 1 | |
| Gene Alias | ERGIC-53 | |
| Cytomap | 18q21.32 | |
| Gene Type | protein-coding | GO ID | GO:0006457 | UniProtAcc | A0A024R2A7 |
Top |
Malignant transformation analysis |
| Identification of the aberrant gene expression in precancerous and cancerous lesions by comparing the gene expression of stem-like cells in diseased tissues with normal stem cells |
| Entrez ID | Symbol | Replicates | Species | Organ | Tissue | Adj P-value | Log2FC | Malignancy |
| 3998 | LMAN1 | AEH-subject1 | Human | Endometrium | AEH | 1.05e-13 | -4.52e-01 | -0.3059 |
| 3998 | LMAN1 | AEH-subject2 | Human | Endometrium | AEH | 4.43e-13 | -4.59e-01 | -0.2525 |
| 3998 | LMAN1 | AEH-subject3 | Human | Endometrium | AEH | 6.51e-13 | -3.57e-01 | -0.2576 |
| 3998 | LMAN1 | AEH-subject4 | Human | Endometrium | AEH | 3.77e-02 | -2.90e-01 | -0.2657 |
| 3998 | LMAN1 | AEH-subject5 | Human | Endometrium | AEH | 1.04e-03 | -2.16e-01 | -0.2953 |
| 3998 | LMAN1 | EEC-subject1 | Human | Endometrium | EEC | 2.04e-10 | -3.05e-01 | -0.2682 |
| 3998 | LMAN1 | EEC-subject2 | Human | Endometrium | EEC | 1.10e-14 | -4.25e-01 | -0.2607 |
| 3998 | LMAN1 | EEC-subject3 | Human | Endometrium | EEC | 3.50e-41 | -4.40e-01 | -0.2525 |
| 3998 | LMAN1 | EEC-subject4 | Human | Endometrium | EEC | 1.45e-04 | -4.46e-02 | -0.2571 |
| 3998 | LMAN1 | GSM5276934 | Human | Endometrium | EEC | 6.81e-03 | -2.72e-02 | -0.0913 |
| 3998 | LMAN1 | GSM5276937 | Human | Endometrium | EEC | 1.00e-02 | 1.85e-01 | -0.0897 |
| 3998 | LMAN1 | GSM6177620_NYU_UCEC1_lib1_lib1 | Human | Endometrium | EEC | 4.68e-29 | -3.04e-01 | -0.1869 |
| 3998 | LMAN1 | GSM6177620_NYU_UCEC1_lib2_lib2 | Human | Endometrium | EEC | 4.88e-31 | -2.15e-01 | -0.1875 |
| 3998 | LMAN1 | GSM6177620_NYU_UCEC1_lib3_lib3 | Human | Endometrium | EEC | 1.60e-33 | -2.53e-01 | -0.1883 |
| 3998 | LMAN1 | GSM6177621_NYU_UCEC2_lib1_lib1 | Human | Endometrium | EEC | 7.75e-39 | 1.86e-01 | -0.1934 |
| 3998 | LMAN1 | GSM6177622_NYU_UCEC3_lib1_lib1 | Human | Endometrium | EEC | 8.24e-55 | -1.05e-01 | -0.1917 |
| 3998 | LMAN1 | GSM6177622_NYU_UCEC3_lib2_lib2 | Human | Endometrium | EEC | 4.52e-52 | -1.20e-01 | -0.1916 |
| 3998 | LMAN1 | GSM6177623_NYU_UCEC3_Vis | Human | Endometrium | EEC | 2.51e-09 | -1.61e-01 | -0.1269 |
| 3998 | LMAN1 | LZE2T | Human | Esophagus | ESCC | 5.22e-08 | 7.96e-01 | 0.082 |
| 3998 | LMAN1 | LZE4T | Human | Esophagus | ESCC | 3.78e-16 | 7.08e-01 | 0.0811 |
| Page: 1 2 3 4 5 6 7 8 9 |
| Tissue | Expression Dynamics | Abbreviation |
| Endometrium | 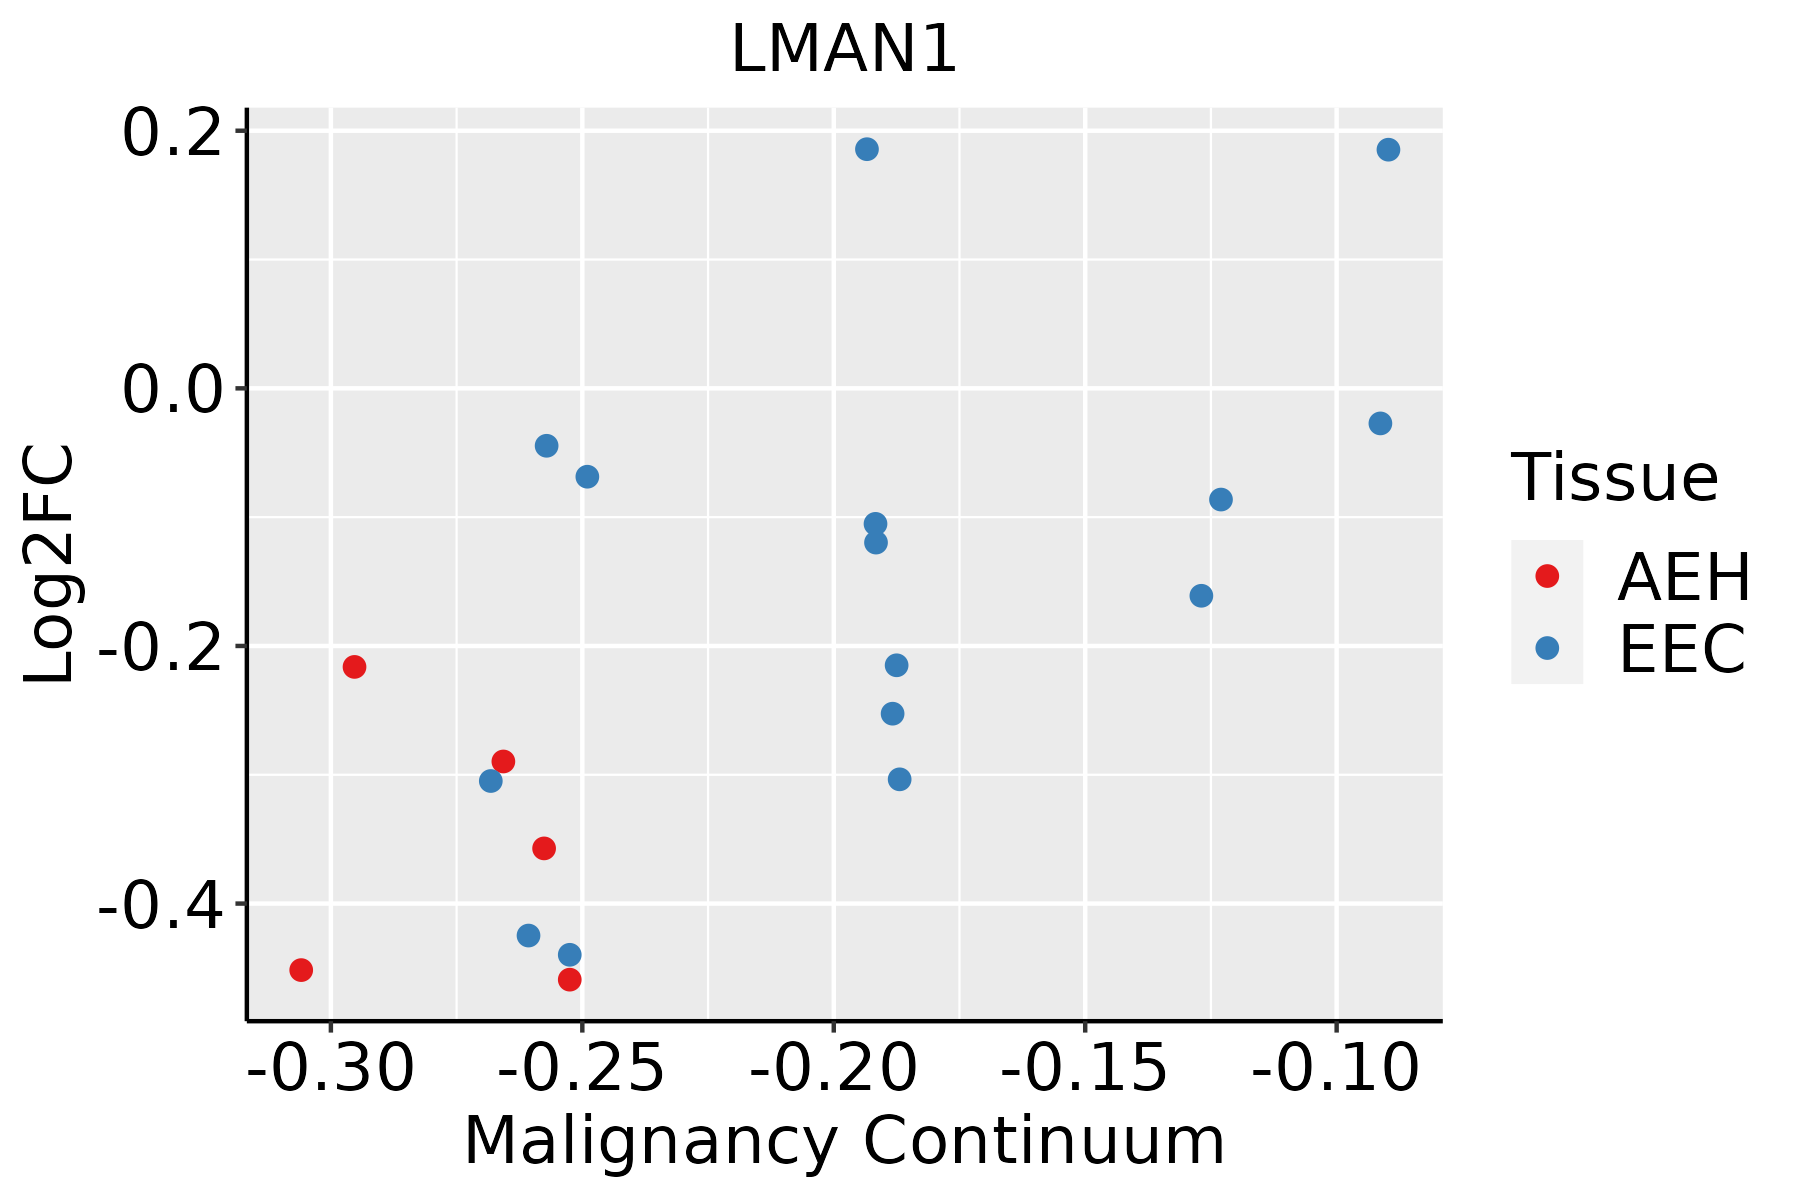 | AEH: Atypical endometrial hyperplasia |
| EEC: Endometrioid Cancer | ||
| Esophagus | 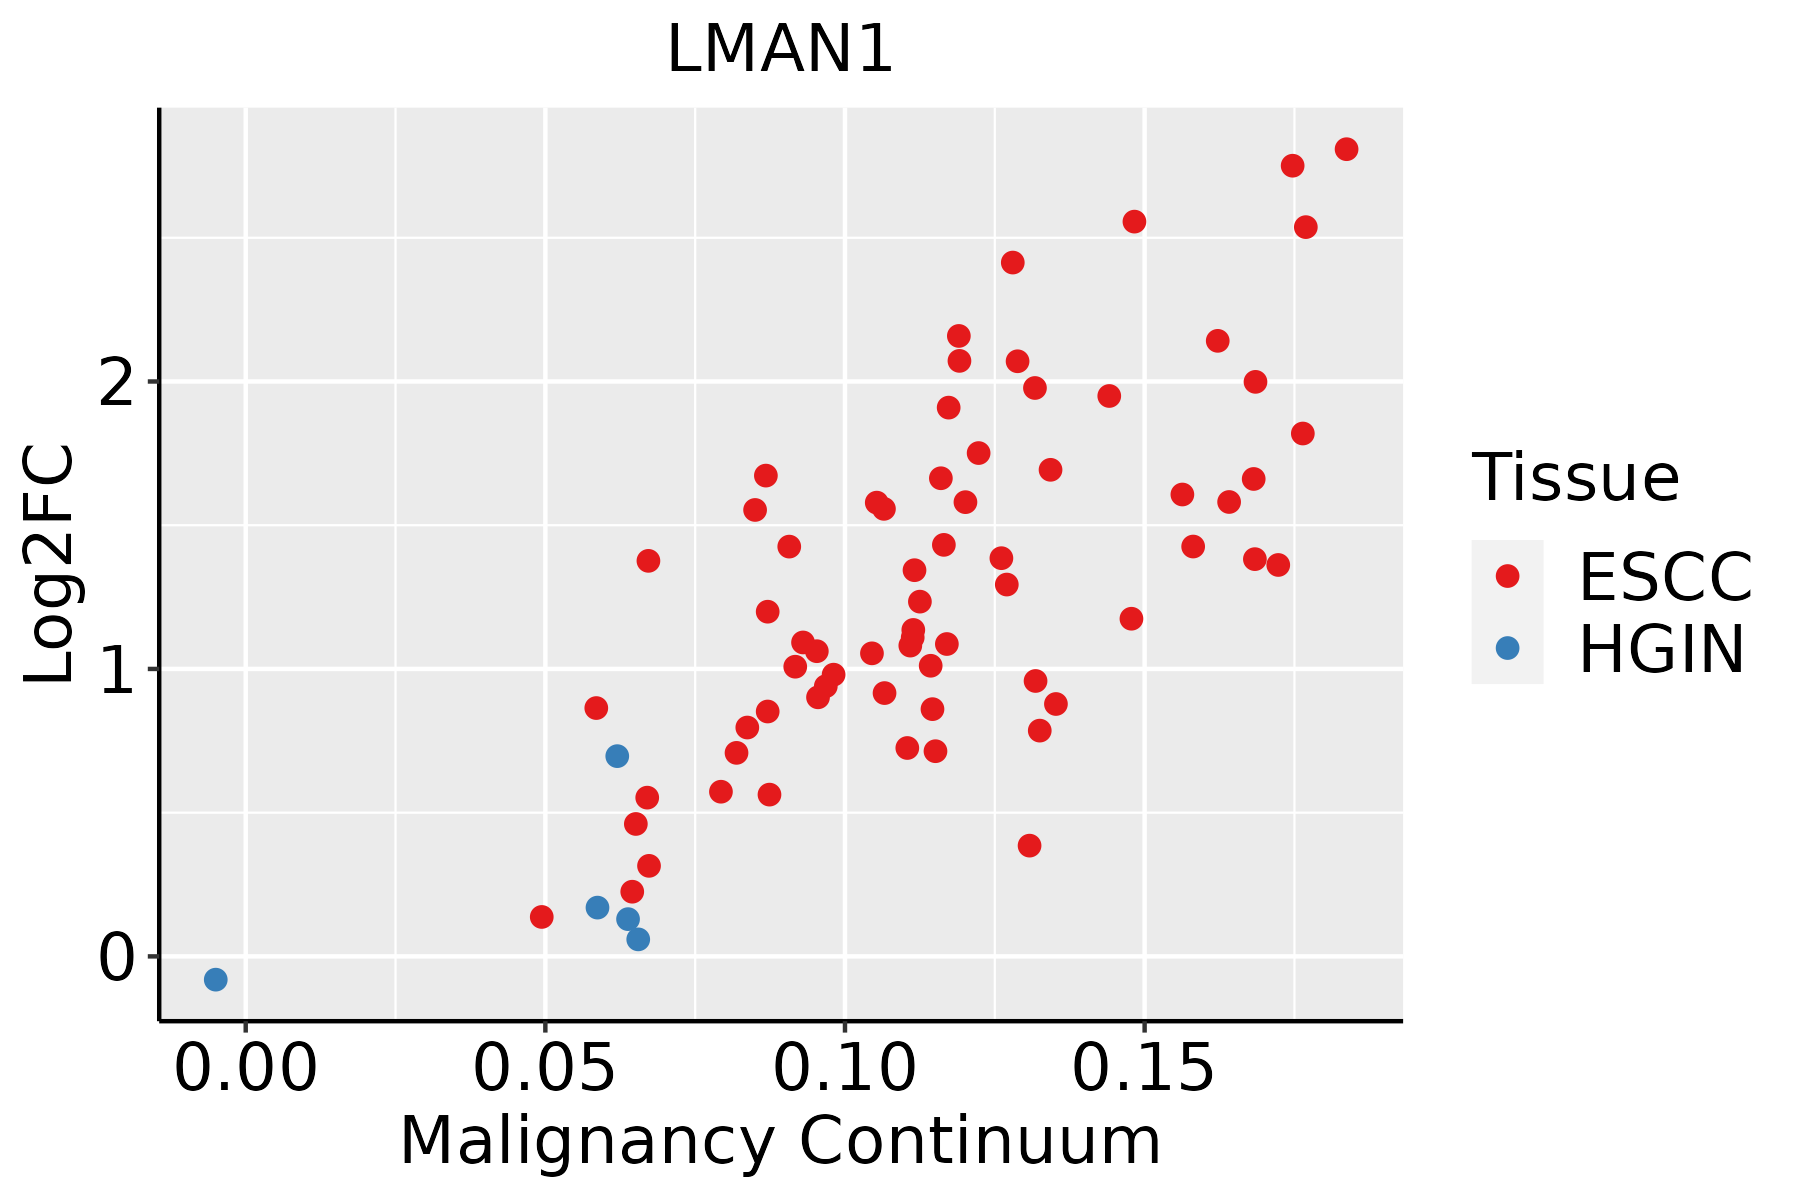 | ESCC: Esophageal squamous cell carcinoma |
| HGIN: High-grade intraepithelial neoplasias | ||
| LGIN: Low-grade intraepithelial neoplasias | ||
| Liver | 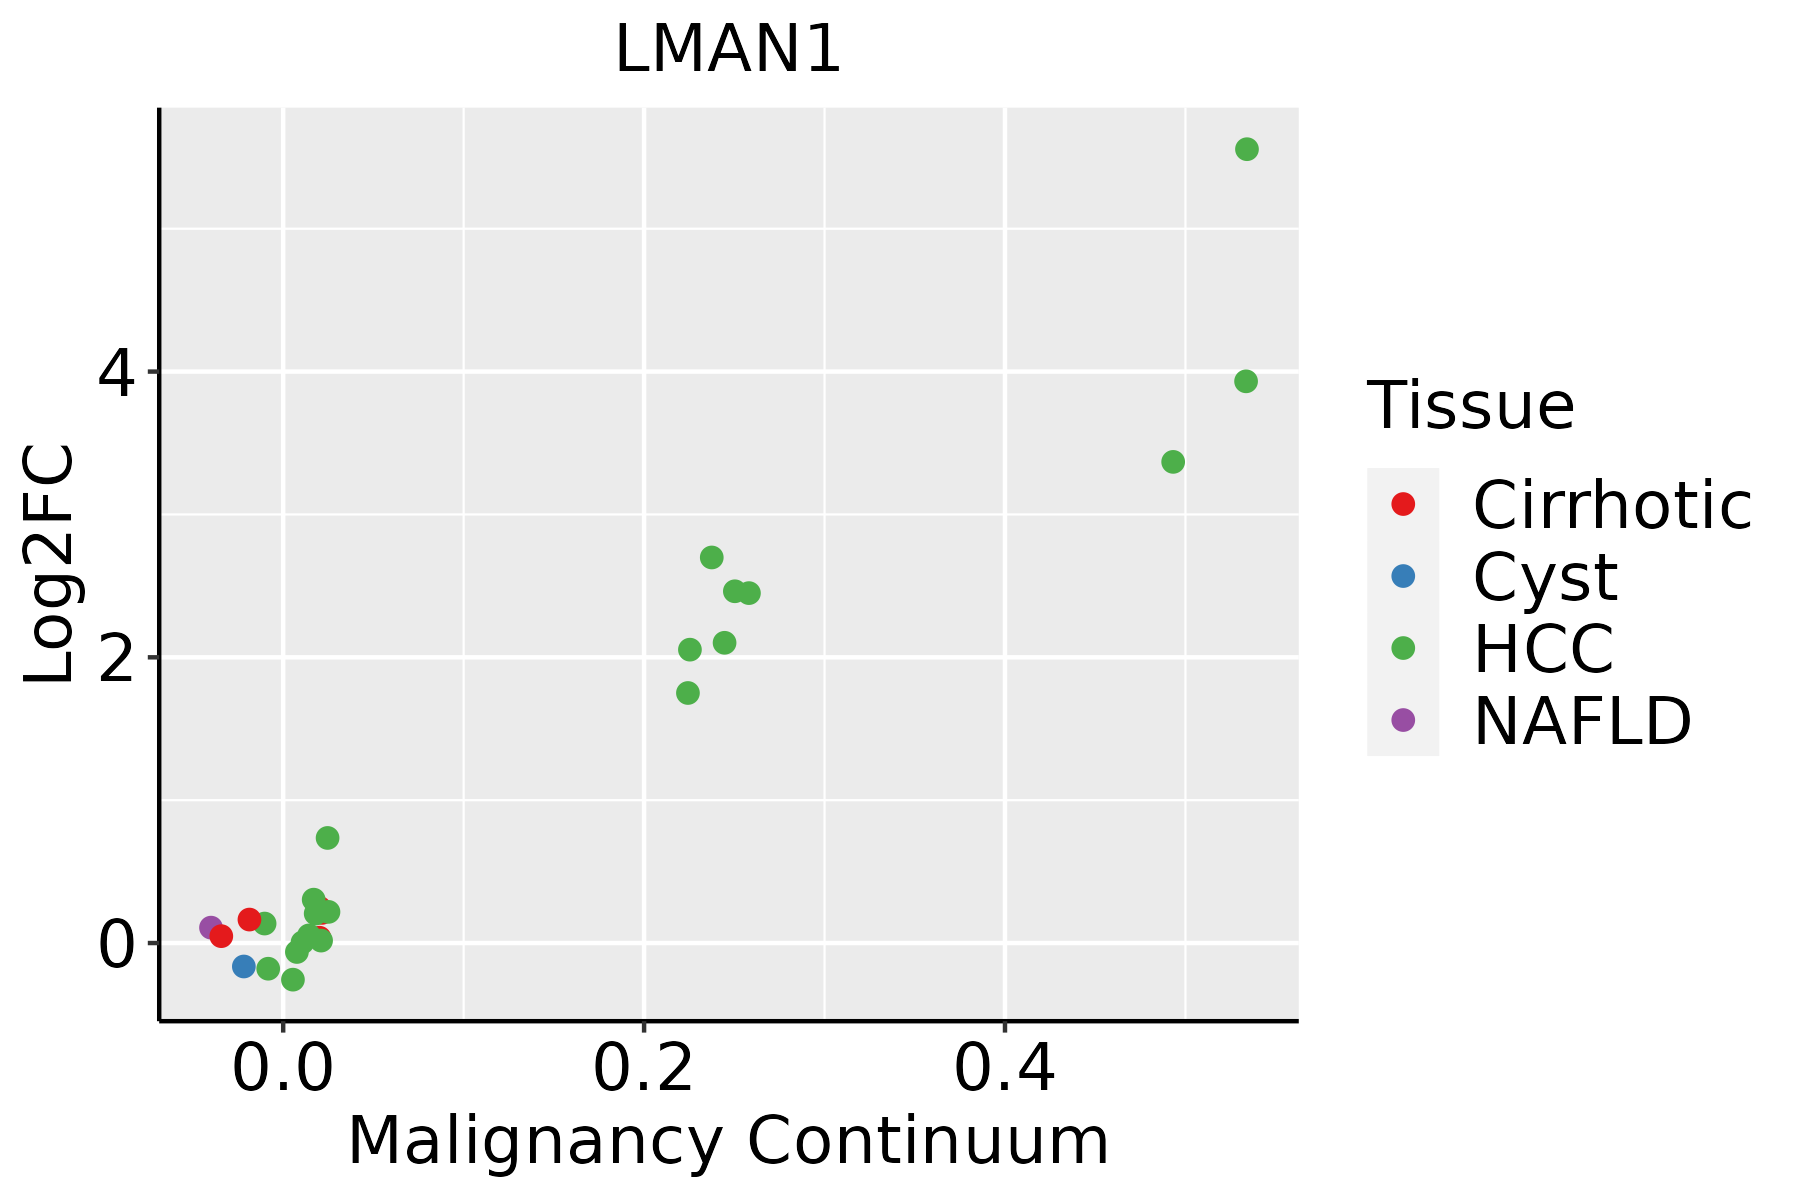 | HCC: Hepatocellular carcinoma |
| NAFLD: Non-alcoholic fatty liver disease | ||
| Oral Cavity |  | EOLP: Erosive Oral lichen planus |
| LP: leukoplakia | ||
| NEOLP: Non-erosive oral lichen planus | ||
| OSCC: Oral squamous cell carcinoma | ||
| Prostate | 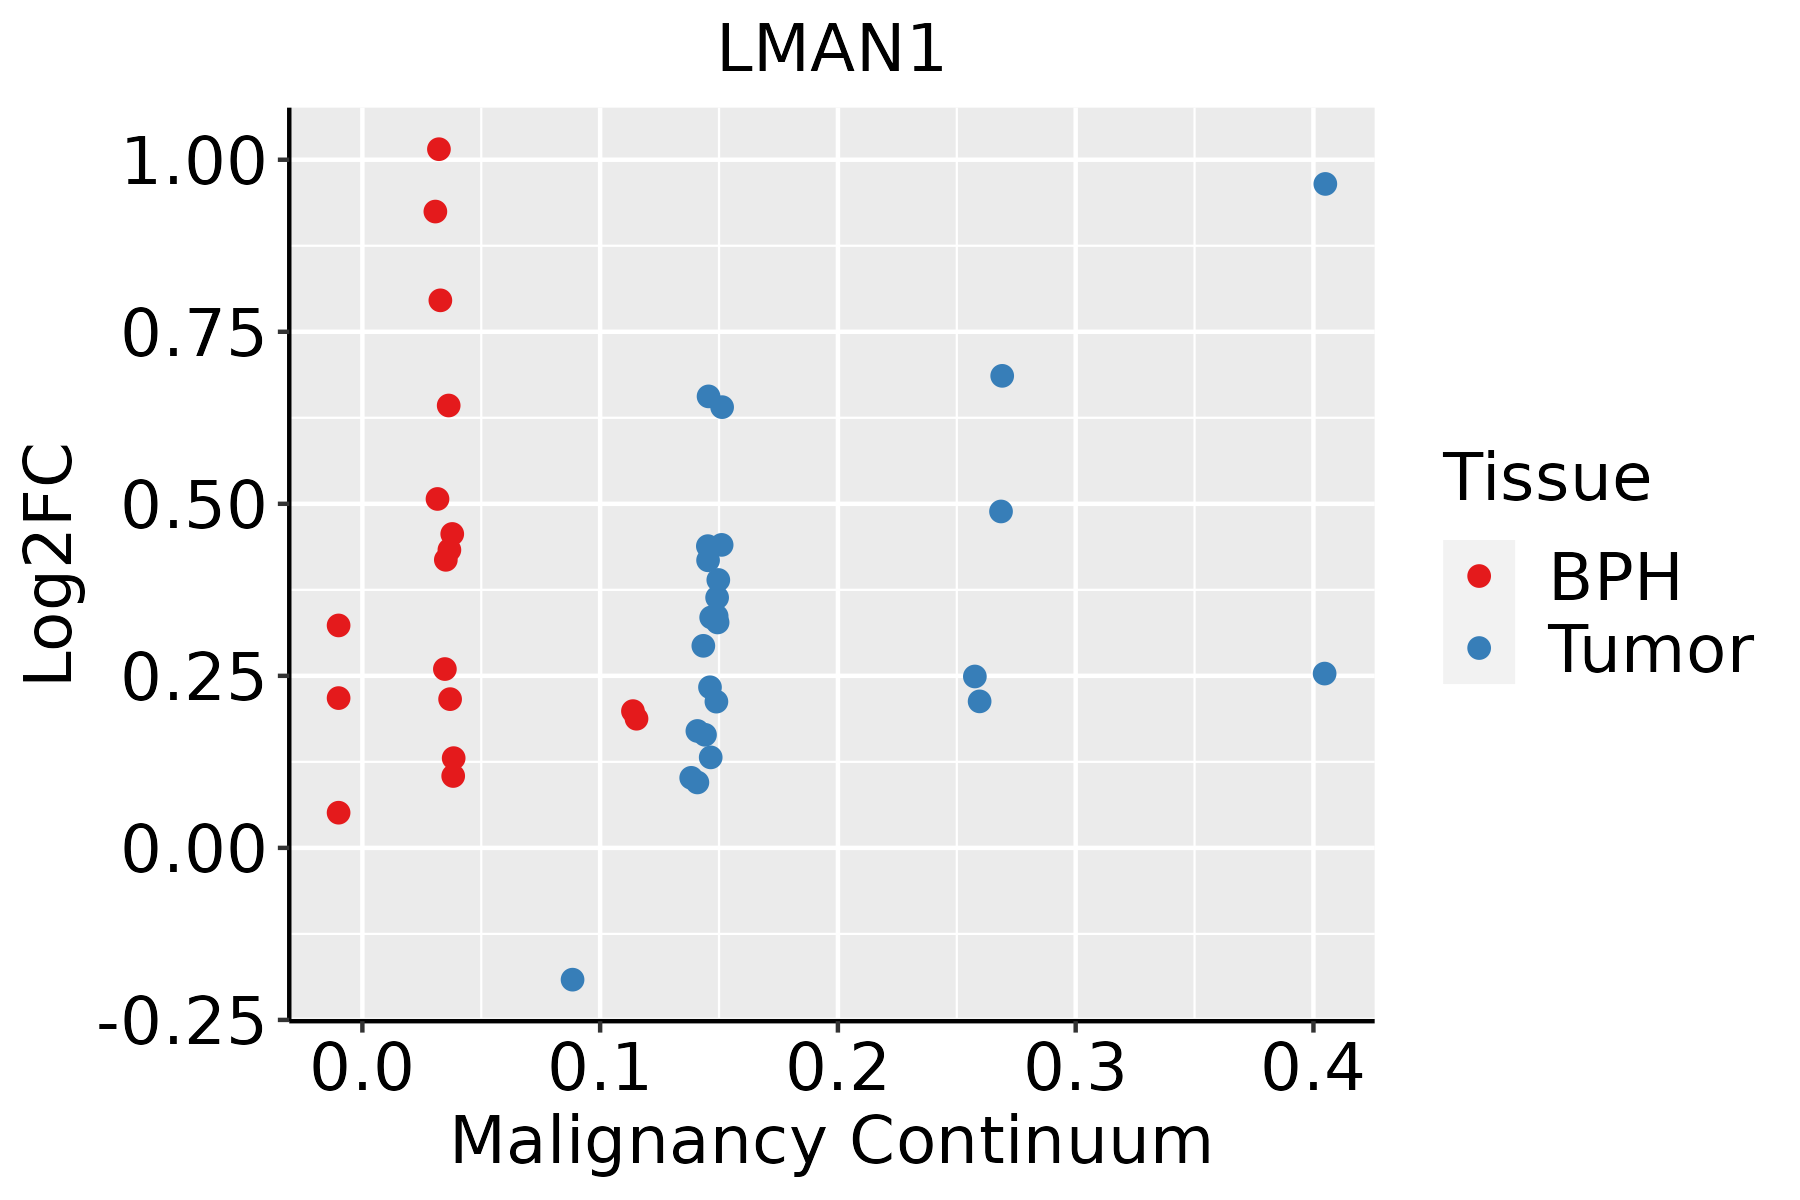 | BPH: Benign Prostatic Hyperplasia |
| Skin | 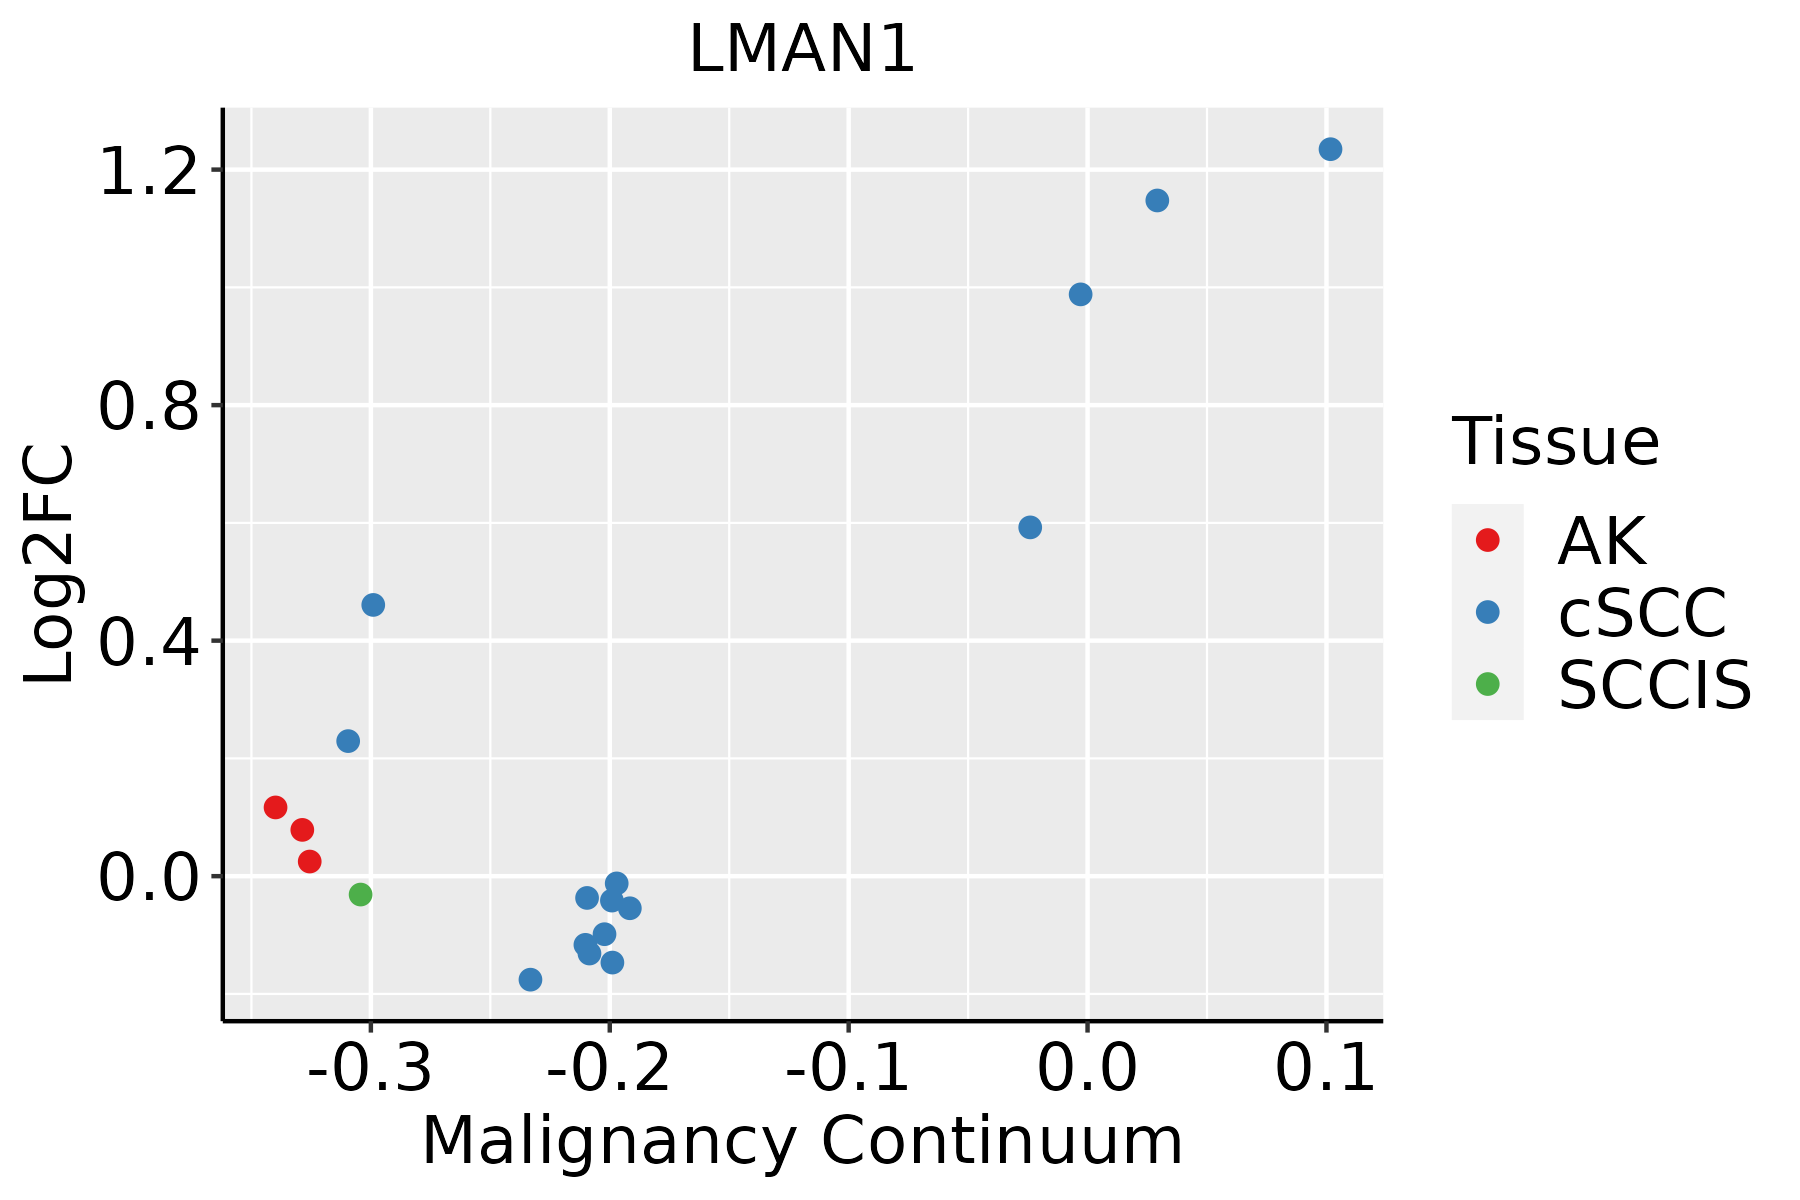 | AK: Actinic keratosis |
| cSCC: Cutaneous squamous cell carcinoma | ||
| SCCIS:squamous cell carcinoma in situ | ||
| Thyroid |  | ATC: Anaplastic thyroid cancer |
| HT: Hashimoto's thyroiditis | ||
| PTC: Papillary thyroid cancer |
| ∗log2FC in expression of this searched gene in stem-like cells from each diseased tissue sample relative to stem-like cells in normal samples in each tissue plotted against the malignancy continuum. Samples are colored based on if they are from different disease stage. |
Top |
Malignant transformation related pathway analysis |
| Find out the enriched GO biological processes and KEGG pathways involved in transition from healthy to precancer to cancer |
| Tissue | Disease Stage | Enriched GO biological Processes |
| Colorectum | AD |  |
| Colorectum | SER |  |
| Colorectum | MSS |  |
| Colorectum | MSI-H |  |
| Colorectum | FAP |  |
| ∗Top 15 enriched GO BP terms are showed in the bar plot of each disease state in each tissue. Each row represents a significant GO biological process which is colored according to the -log10(p.adjust). |
| Page: 1 2 3 4 5 6 7 8 9 |
| GO ID | Tissue | Disease Stage | Description | Gene Ratio | Bg Ratio | pvalue | p.adjust | Count |
| GO:000645710 | Endometrium | AEH | protein folding | 61/2100 | 212/18723 | 1.86e-12 | 3.48e-10 | 61 |
| GO:000683910 | Endometrium | AEH | mitochondrial transport | 66/2100 | 254/18723 | 3.55e-11 | 4.96e-09 | 66 |
| GO:004206016 | Endometrium | AEH | wound healing | 91/2100 | 422/18723 | 4.85e-10 | 4.61e-08 | 91 |
| GO:007259410 | Endometrium | AEH | establishment of protein localization to organelle | 89/2100 | 422/18723 | 2.41e-09 | 1.90e-07 | 89 |
| GO:000660516 | Endometrium | AEH | protein targeting | 68/2100 | 314/18723 | 6.30e-08 | 3.38e-06 | 68 |
| GO:003315710 | Endometrium | AEH | regulation of intracellular protein transport | 51/2100 | 229/18723 | 1.13e-06 | 3.75e-05 | 51 |
| GO:00481939 | Endometrium | AEH | Golgi vesicle transport | 60/2100 | 296/18723 | 3.65e-06 | 9.79e-05 | 60 |
| GO:00323869 | Endometrium | AEH | regulation of intracellular transport | 66/2100 | 337/18723 | 4.18e-06 | 1.10e-04 | 66 |
| GO:007058510 | Endometrium | AEH | protein localization to mitochondrion | 32/2100 | 125/18723 | 5.38e-06 | 1.36e-04 | 32 |
| GO:007265510 | Endometrium | AEH | establishment of protein localization to mitochondrion | 31/2100 | 120/18723 | 6.13e-06 | 1.50e-04 | 31 |
| GO:000662610 | Endometrium | AEH | protein targeting to mitochondrion | 26/2100 | 100/18723 | 2.96e-05 | 5.47e-04 | 26 |
| GO:00075967 | Endometrium | AEH | blood coagulation | 43/2100 | 217/18723 | 1.42e-04 | 1.89e-03 | 43 |
| GO:00510515 | Endometrium | AEH | negative regulation of transport | 79/2100 | 470/18723 | 1.51e-04 | 1.99e-03 | 79 |
| GO:00068886 | Endometrium | AEH | endoplasmic reticulum to Golgi vesicle-mediated transport | 29/2100 | 130/18723 | 2.11e-04 | 2.59e-03 | 29 |
| GO:00075997 | Endometrium | AEH | hemostasis | 43/2100 | 222/18723 | 2.39e-04 | 2.86e-03 | 43 |
| GO:00508177 | Endometrium | AEH | coagulation | 43/2100 | 222/18723 | 2.39e-04 | 2.86e-03 | 43 |
| GO:005087815 | Endometrium | AEH | regulation of body fluid levels | 64/2100 | 379/18723 | 5.40e-04 | 5.44e-03 | 64 |
| GO:00070305 | Endometrium | AEH | Golgi organization | 32/2100 | 157/18723 | 5.73e-04 | 5.69e-03 | 32 |
| GO:19032145 | Endometrium | AEH | regulation of protein targeting to mitochondrion | 13/2100 | 44/18723 | 7.79e-04 | 7.36e-03 | 13 |
| GO:19037476 | Endometrium | AEH | regulation of establishment of protein localization to mitochondrion | 14/2100 | 50/18723 | 8.97e-04 | 8.24e-03 | 14 |
| Page: 1 2 3 4 5 6 7 8 9 10 11 12 13 14 15 16 |
| Pathway ID | Tissue | Disease Stage | Description | Gene Ratio | Bg Ratio | pvalue | p.adjust | qvalue | Count |
| hsa0414126 | Endometrium | AEH | Protein processing in endoplasmic reticulum | 62/1197 | 174/8465 | 5.97e-13 | 1.39e-11 | 1.01e-11 | 62 |
| hsa04141111 | Endometrium | AEH | Protein processing in endoplasmic reticulum | 62/1197 | 174/8465 | 5.97e-13 | 1.39e-11 | 1.01e-11 | 62 |
| hsa0414127 | Endometrium | EEC | Protein processing in endoplasmic reticulum | 64/1237 | 174/8465 | 2.17e-13 | 5.09e-12 | 3.80e-12 | 64 |
| hsa0414136 | Endometrium | EEC | Protein processing in endoplasmic reticulum | 64/1237 | 174/8465 | 2.17e-13 | 5.09e-12 | 3.80e-12 | 64 |
| hsa04141211 | Esophagus | ESCC | Protein processing in endoplasmic reticulum | 147/4205 | 174/8465 | 3.29e-22 | 1.10e-19 | 5.64e-20 | 147 |
| hsa04141310 | Esophagus | ESCC | Protein processing in endoplasmic reticulum | 147/4205 | 174/8465 | 3.29e-22 | 1.10e-19 | 5.64e-20 | 147 |
| hsa0414114 | Liver | Cirrhotic | Protein processing in endoplasmic reticulum | 114/2530 | 174/8465 | 1.16e-22 | 9.67e-21 | 5.96e-21 | 114 |
| hsa0414115 | Liver | Cirrhotic | Protein processing in endoplasmic reticulum | 114/2530 | 174/8465 | 1.16e-22 | 9.67e-21 | 5.96e-21 | 114 |
| hsa0414122 | Liver | HCC | Protein processing in endoplasmic reticulum | 146/4020 | 174/8465 | 7.34e-24 | 2.46e-21 | 1.37e-21 | 146 |
| hsa0414132 | Liver | HCC | Protein processing in endoplasmic reticulum | 146/4020 | 174/8465 | 7.34e-24 | 2.46e-21 | 1.37e-21 | 146 |
| hsa0414130 | Oral cavity | OSCC | Protein processing in endoplasmic reticulum | 143/3704 | 174/8465 | 6.82e-26 | 2.28e-23 | 1.16e-23 | 143 |
| hsa04141113 | Oral cavity | OSCC | Protein processing in endoplasmic reticulum | 143/3704 | 174/8465 | 6.82e-26 | 2.28e-23 | 1.16e-23 | 143 |
| hsa04141210 | Oral cavity | LP | Protein processing in endoplasmic reticulum | 113/2418 | 174/8465 | 8.74e-24 | 5.82e-22 | 3.76e-22 | 113 |
| hsa0414138 | Oral cavity | LP | Protein processing in endoplasmic reticulum | 113/2418 | 174/8465 | 8.74e-24 | 5.82e-22 | 3.76e-22 | 113 |
| hsa0414128 | Prostate | BPH | Protein processing in endoplasmic reticulum | 97/1718 | 174/8465 | 2.37e-25 | 1.30e-23 | 8.07e-24 | 97 |
| hsa04141112 | Prostate | BPH | Protein processing in endoplasmic reticulum | 97/1718 | 174/8465 | 2.37e-25 | 1.30e-23 | 8.07e-24 | 97 |
| hsa0414129 | Prostate | Tumor | Protein processing in endoplasmic reticulum | 99/1791 | 174/8465 | 2.58e-25 | 1.71e-23 | 1.06e-23 | 99 |
| hsa0414137 | Prostate | Tumor | Protein processing in endoplasmic reticulum | 99/1791 | 174/8465 | 2.58e-25 | 1.71e-23 | 1.06e-23 | 99 |
| Page: 1 |
Top |
Cell-cell communication analysis |
| Identification of potential cell-cell interactions between two cell types and their ligand-receptor pairs for different disease states |
| Ligand | Receptor | LRpair | Pathway | Tissue | Disease Stage |
| Page: 1 |
Top |
Single-cell gene regulatory network inference analysis |
| Find out the significant the regulons (TFs) and the target genes of each regulon across cell types for different disease states |
| TF | Cell Type | Tissue | Disease Stage | Target Gene | RSS | Regulon Activity |
| ∗The dot plots of a searched regulon are shown for all cell subpopulations in each disease state of each tissue based on the regulon specific score inferred using pySCENIC and by calculating the average expression. |
| Page: 1 |
Top |
Somatic mutation of malignant transformation related genes |
| Annotation of somatic variants for genes involved in malignant transformation |
| Hugo Symbol | Variant Class | Variant Classification | dbSNP RS | HGVSc | HGVSp | HGVSp Short | SWISSPROT | BIOTYPE | SIFT | PolyPhen | Tumor Sample Barcode | Tissue | Histology | Sex | Age | Stage | Therapy Types | Drugs | Outcome |
| LMAN1 | SNV | Missense_Mutation | c.667N>A | p.Asp223Asn | p.D223N | P49257 | protein_coding | tolerated(1) | benign(0.011) | TCGA-BH-A0BP-01 | Breast | breast invasive carcinoma | Female | >=65 | I/II | Unknown | Unknown | SD | |
| LMAN1 | deletion | Frame_Shift_Del | rs746845401 | c.912delA | p.Glu305ArgfsTer22 | p.E305Rfs*22 | P49257 | protein_coding | TCGA-D8-A1XQ-01 | Breast | breast invasive carcinoma | Female | >=65 | I/II | Unknown | Unknown | SD | ||
| LMAN1 | SNV | Missense_Mutation | c.584G>C | p.Arg195Pro | p.R195P | P49257 | protein_coding | deleterious(0) | probably_damaging(1) | TCGA-EK-A2RO-01 | Cervix | cervical & endocervical cancer | Female | <65 | I/II | Unknown | Unknown | SD | |
| LMAN1 | deletion | Frame_Shift_Del | rs746845401 | c.912delA | p.Glu305ArgfsTer22 | p.E305Rfs*22 | P49257 | protein_coding | TCGA-MA-AA42-01 | Cervix | cervical & endocervical cancer | Female | >=65 | I/II | Unknown | Unknown | SD | ||
| LMAN1 | SNV | Missense_Mutation | novel | c.658N>C | p.Phe220Leu | p.F220L | P49257 | protein_coding | tolerated(0.83) | benign(0.023) | TCGA-A6-2672-01 | Colorectum | colon adenocarcinoma | Female | >=65 | III/IV | Unknown | Unknown | SD |
| LMAN1 | SNV | Missense_Mutation | rs752998844 | c.937N>A | p.Asp313Asn | p.D313N | P49257 | protein_coding | tolerated(0.07) | probably_damaging(0.933) | TCGA-AA-3510-01 | Colorectum | colon adenocarcinoma | Male | >=65 | I/II | Unknown | Unknown | SD |
| LMAN1 | SNV | Missense_Mutation | c.1442N>A | p.Phe481Tyr | p.F481Y | P49257 | protein_coding | deleterious(0) | probably_damaging(0.987) | TCGA-CM-6170-01 | Colorectum | colon adenocarcinoma | Female | >=65 | I/II | Unknown | Unknown | SD | |
| LMAN1 | SNV | Missense_Mutation | rs112235778 | c.305N>G | p.Glu102Gly | p.E102G | P49257 | protein_coding | deleterious(0.01) | benign(0.287) | TCGA-F4-6459-01 | Colorectum | colon adenocarcinoma | Female | <65 | III/IV | Unknown | Unknown | SD |
| LMAN1 | SNV | Missense_Mutation | novel | c.448T>G | p.Phe150Val | p.F150V | P49257 | protein_coding | deleterious(0) | possibly_damaging(0.494) | TCGA-AG-A002-01 | Colorectum | rectum adenocarcinoma | Male | <65 | I/II | Unknown | Unknown | SD |
| LMAN1 | SNV | Missense_Mutation | c.1018N>T | p.Arg340Cys | p.R340C | P49257 | protein_coding | deleterious(0.01) | possibly_damaging(0.818) | TCGA-EI-6917-01 | Colorectum | rectum adenocarcinoma | Male | <65 | III/IV | Chemotherapy | 5fluorouracil+oxaciplatina+l-folinian | SD |
| Page: 1 2 3 4 5 6 7 8 9 10 11 12 |
Top |
Related drugs of malignant transformation related genes |
| Identification of chemicals and drugs interact with genes involved in malignant transfromation |
| (DGIdb 4.0) |
| Entrez ID | Symbol | Category | Interaction Types | Drug Claim Name | Drug Name | PMIDs |
| Page: 1 |

Copyright 2023-Present -The University of Texas Health Science Center at Houston |