
|
|||||
|
 | |
| |
| |
| |
| |
| |
|
Gene: LLPH |
Gene summary for LLPH |
| Gene information | Species | Human | Gene symbol | LLPH | Gene ID | 84298 |
| Gene name | LLP homolog, long-term synaptic facilitation factor | |
| Gene Alias | C12orf31 | |
| Cytomap | 12q14.3 | |
| Gene Type | protein-coding | GO ID | GO:0000902 | UniProtAcc | A0A024RB76 |
Top |
Malignant transformation analysis |
| Identification of the aberrant gene expression in precancerous and cancerous lesions by comparing the gene expression of stem-like cells in diseased tissues with normal stem cells |
| Entrez ID | Symbol | Replicates | Species | Organ | Tissue | Adj P-value | Log2FC | Malignancy |
| 84298 | LLPH | LZE4T | Human | Esophagus | ESCC | 1.17e-16 | 4.36e-01 | 0.0811 |
| 84298 | LLPH | LZE5T | Human | Esophagus | ESCC | 2.24e-02 | 1.95e-01 | 0.0514 |
| 84298 | LLPH | LZE7T | Human | Esophagus | ESCC | 1.16e-12 | 4.12e-01 | 0.0667 |
| 84298 | LLPH | LZE8T | Human | Esophagus | ESCC | 1.41e-11 | 1.92e-01 | 0.067 |
| 84298 | LLPH | LZE20T | Human | Esophagus | ESCC | 1.50e-04 | 1.67e-01 | 0.0662 |
| 84298 | LLPH | LZE22T | Human | Esophagus | ESCC | 5.75e-04 | 3.21e-01 | 0.068 |
| 84298 | LLPH | LZE24T | Human | Esophagus | ESCC | 3.93e-20 | 5.10e-01 | 0.0596 |
| 84298 | LLPH | LZE22D3 | Human | Esophagus | HGIN | 3.85e-06 | 3.91e-01 | 0.0653 |
| 84298 | LLPH | LZE21T | Human | Esophagus | ESCC | 4.59e-04 | 3.54e-01 | 0.0655 |
| 84298 | LLPH | LZE6T | Human | Esophagus | ESCC | 4.18e-09 | 3.35e-01 | 0.0845 |
| 84298 | LLPH | P1T-E | Human | Esophagus | ESCC | 9.58e-14 | 9.01e-01 | 0.0875 |
| 84298 | LLPH | P2T-E | Human | Esophagus | ESCC | 3.32e-40 | 8.21e-01 | 0.1177 |
| 84298 | LLPH | P4T-E | Human | Esophagus | ESCC | 4.19e-33 | 7.99e-01 | 0.1323 |
| 84298 | LLPH | P5T-E | Human | Esophagus | ESCC | 1.65e-35 | 8.24e-01 | 0.1327 |
| 84298 | LLPH | P8T-E | Human | Esophagus | ESCC | 8.33e-31 | 6.58e-01 | 0.0889 |
| 84298 | LLPH | P9T-E | Human | Esophagus | ESCC | 3.96e-20 | 4.18e-01 | 0.1131 |
| 84298 | LLPH | P10T-E | Human | Esophagus | ESCC | 5.27e-24 | 5.96e-01 | 0.116 |
| 84298 | LLPH | P11T-E | Human | Esophagus | ESCC | 3.07e-11 | 4.91e-01 | 0.1426 |
| 84298 | LLPH | P12T-E | Human | Esophagus | ESCC | 1.56e-32 | 6.72e-01 | 0.1122 |
| 84298 | LLPH | P15T-E | Human | Esophagus | ESCC | 4.82e-25 | 4.14e-01 | 0.1149 |
| Page: 1 2 3 4 5 6 7 |
| Tissue | Expression Dynamics | Abbreviation |
| Esophagus | 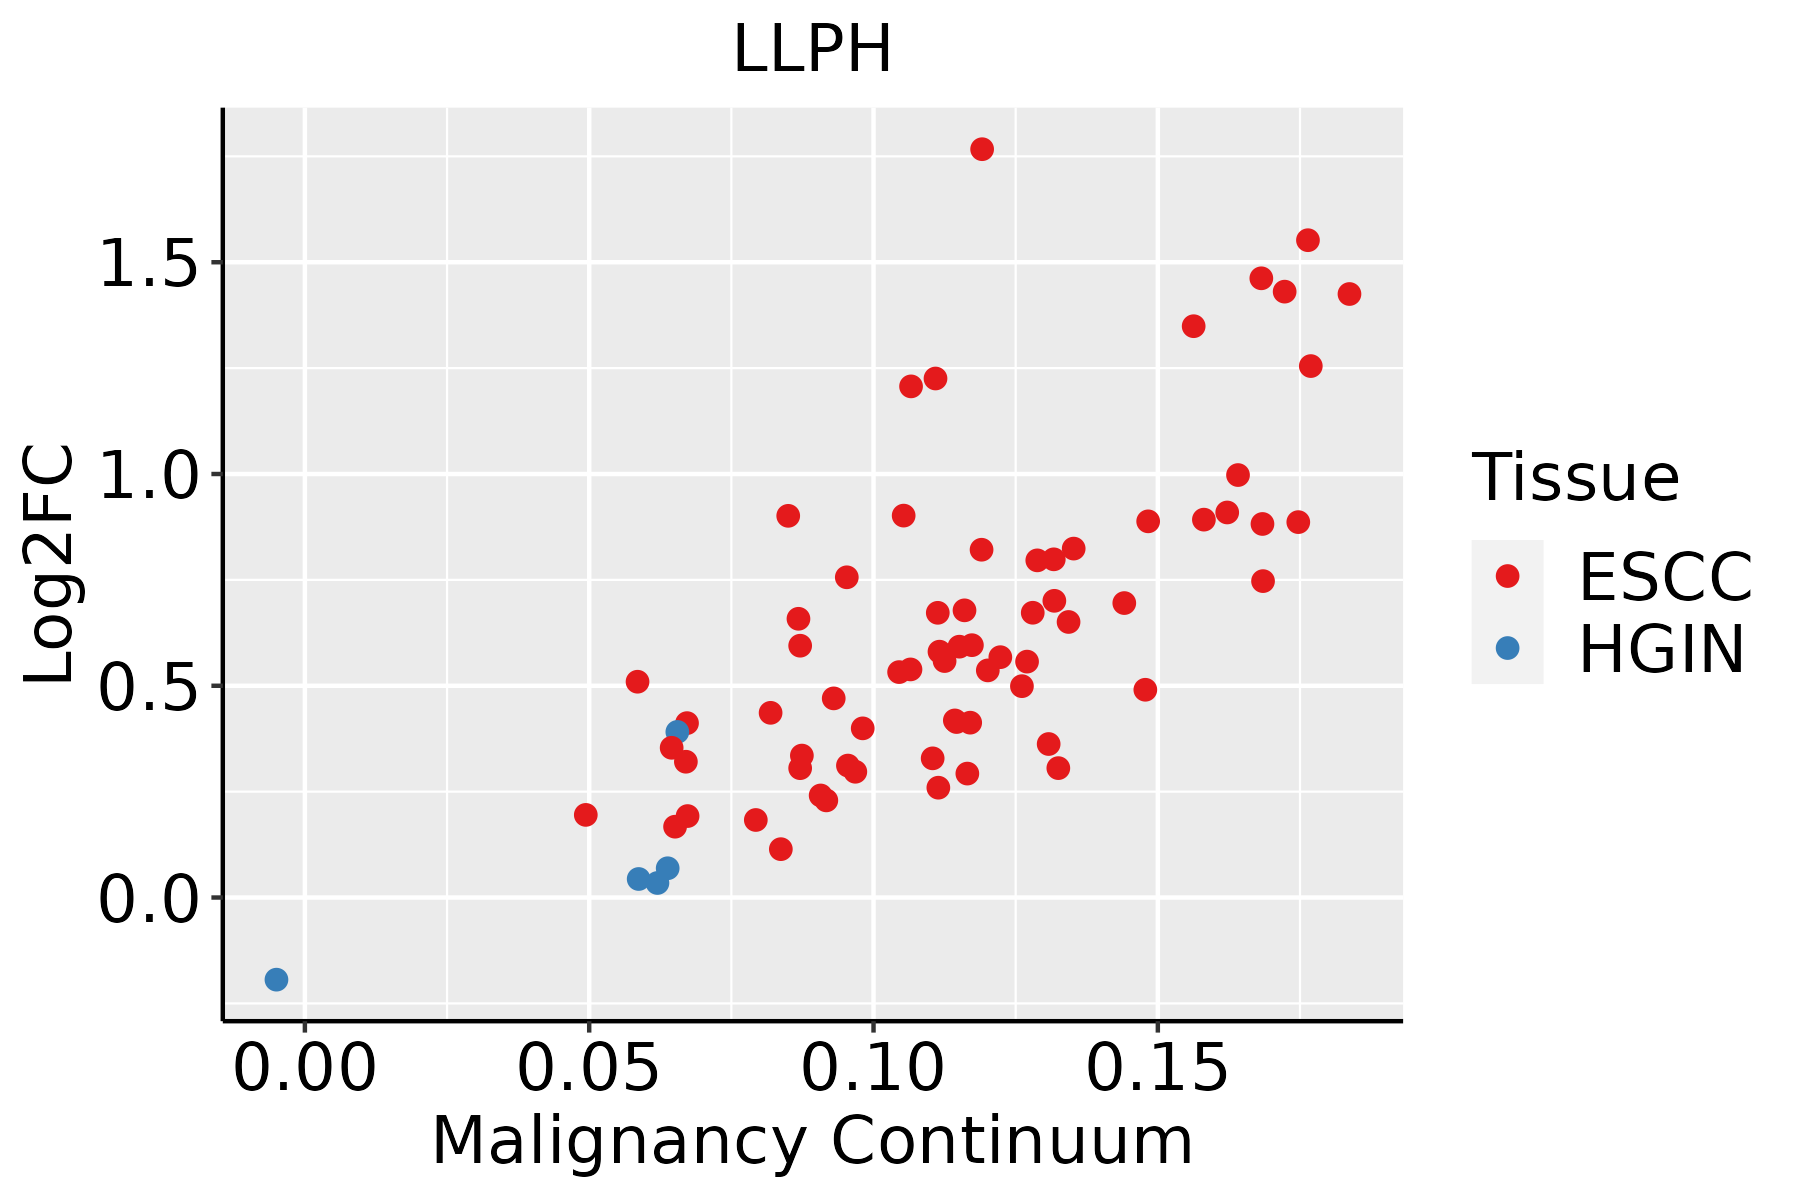 | ESCC: Esophageal squamous cell carcinoma |
| HGIN: High-grade intraepithelial neoplasias | ||
| LGIN: Low-grade intraepithelial neoplasias | ||
| Liver | 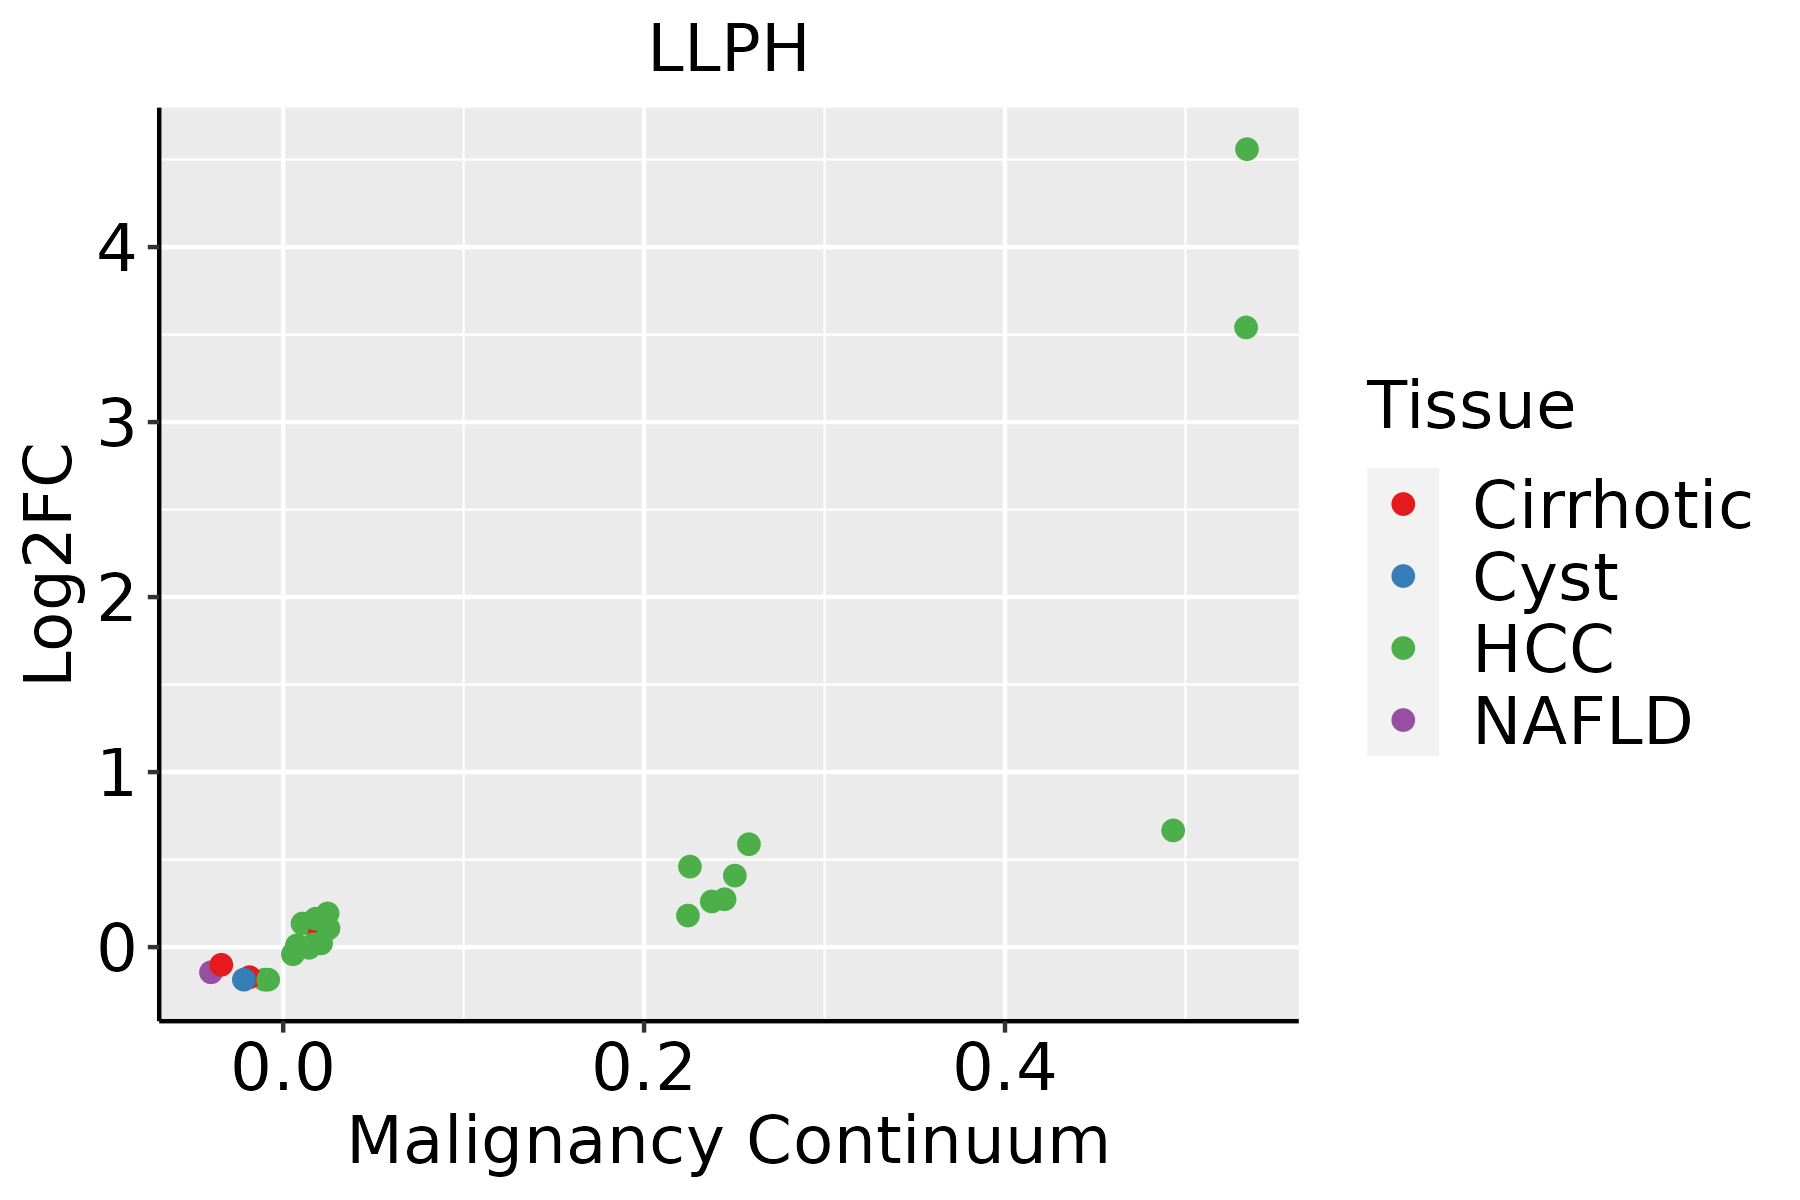 | HCC: Hepatocellular carcinoma |
| NAFLD: Non-alcoholic fatty liver disease | ||
| Oral Cavity | 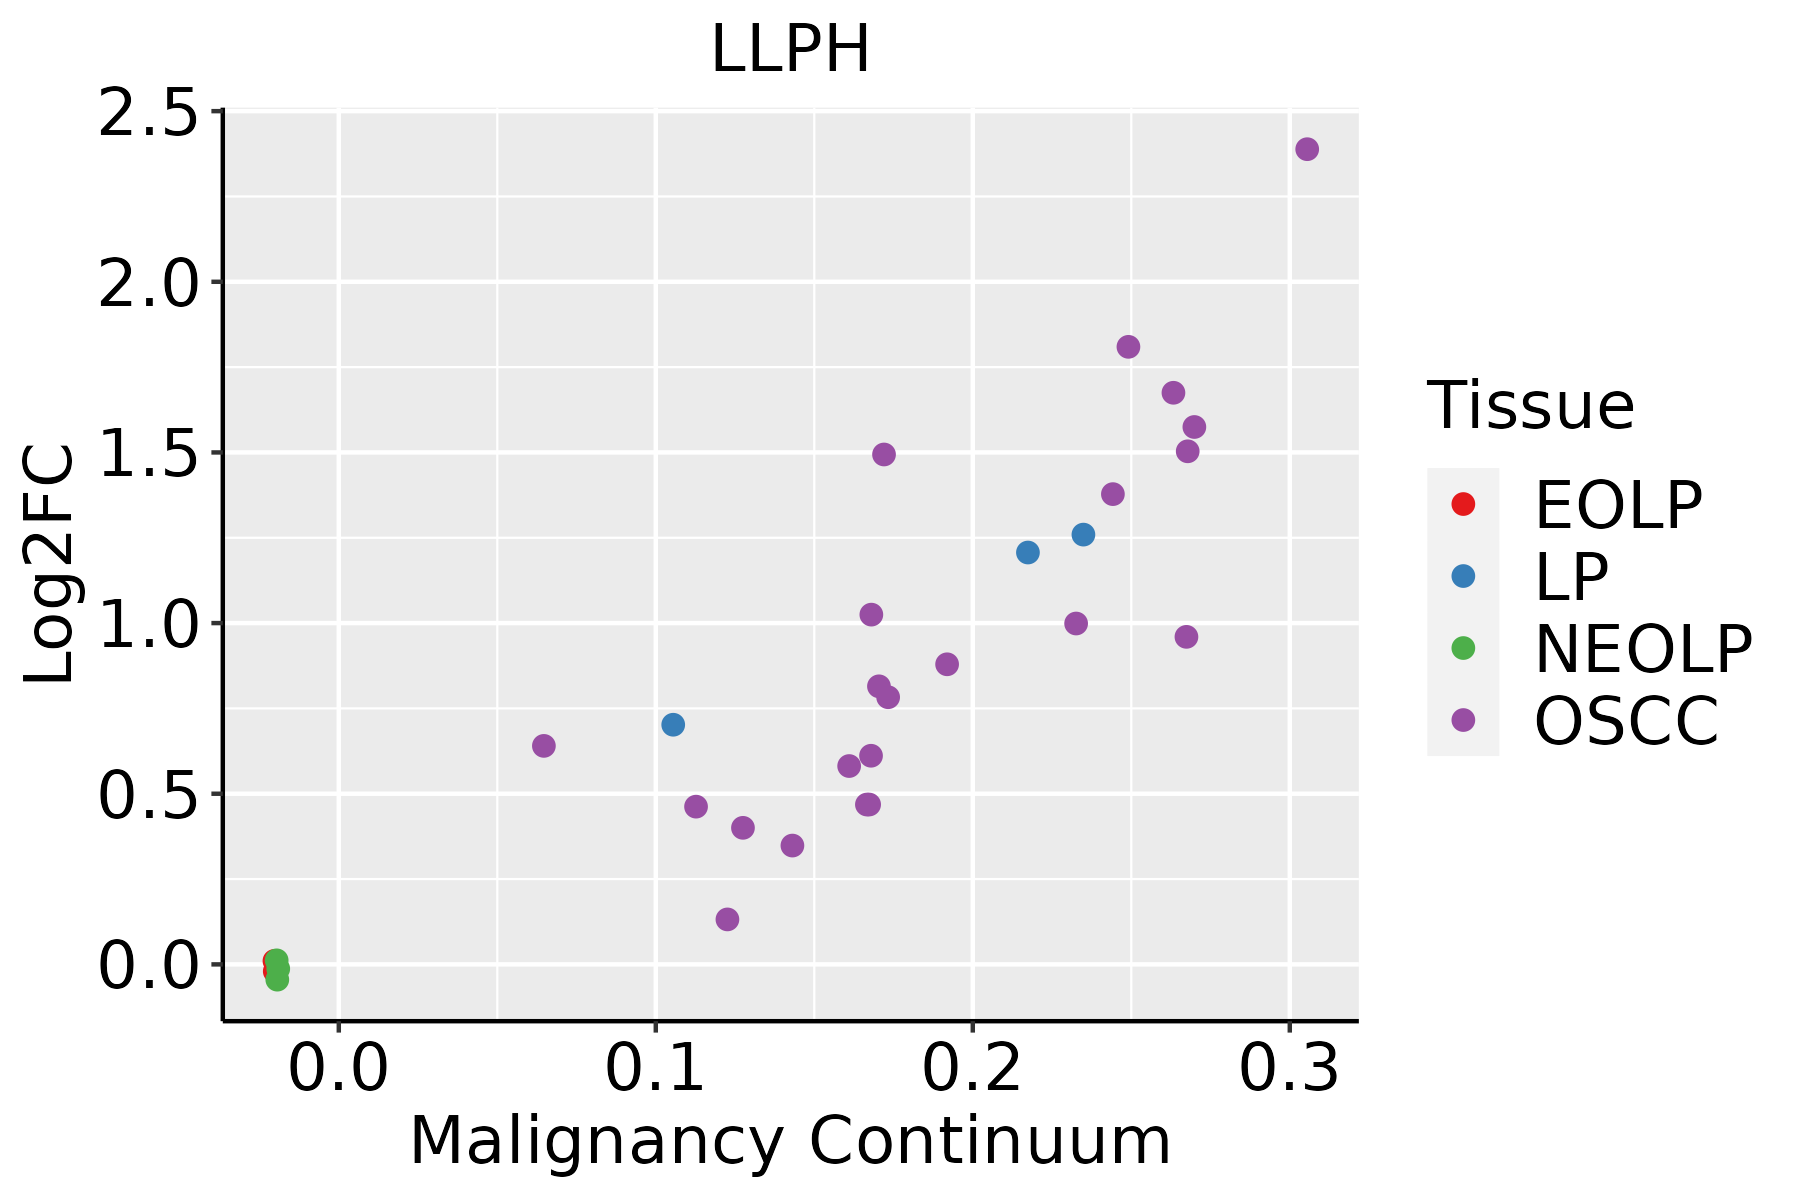 | EOLP: Erosive Oral lichen planus |
| LP: leukoplakia | ||
| NEOLP: Non-erosive oral lichen planus | ||
| OSCC: Oral squamous cell carcinoma | ||
| Skin | 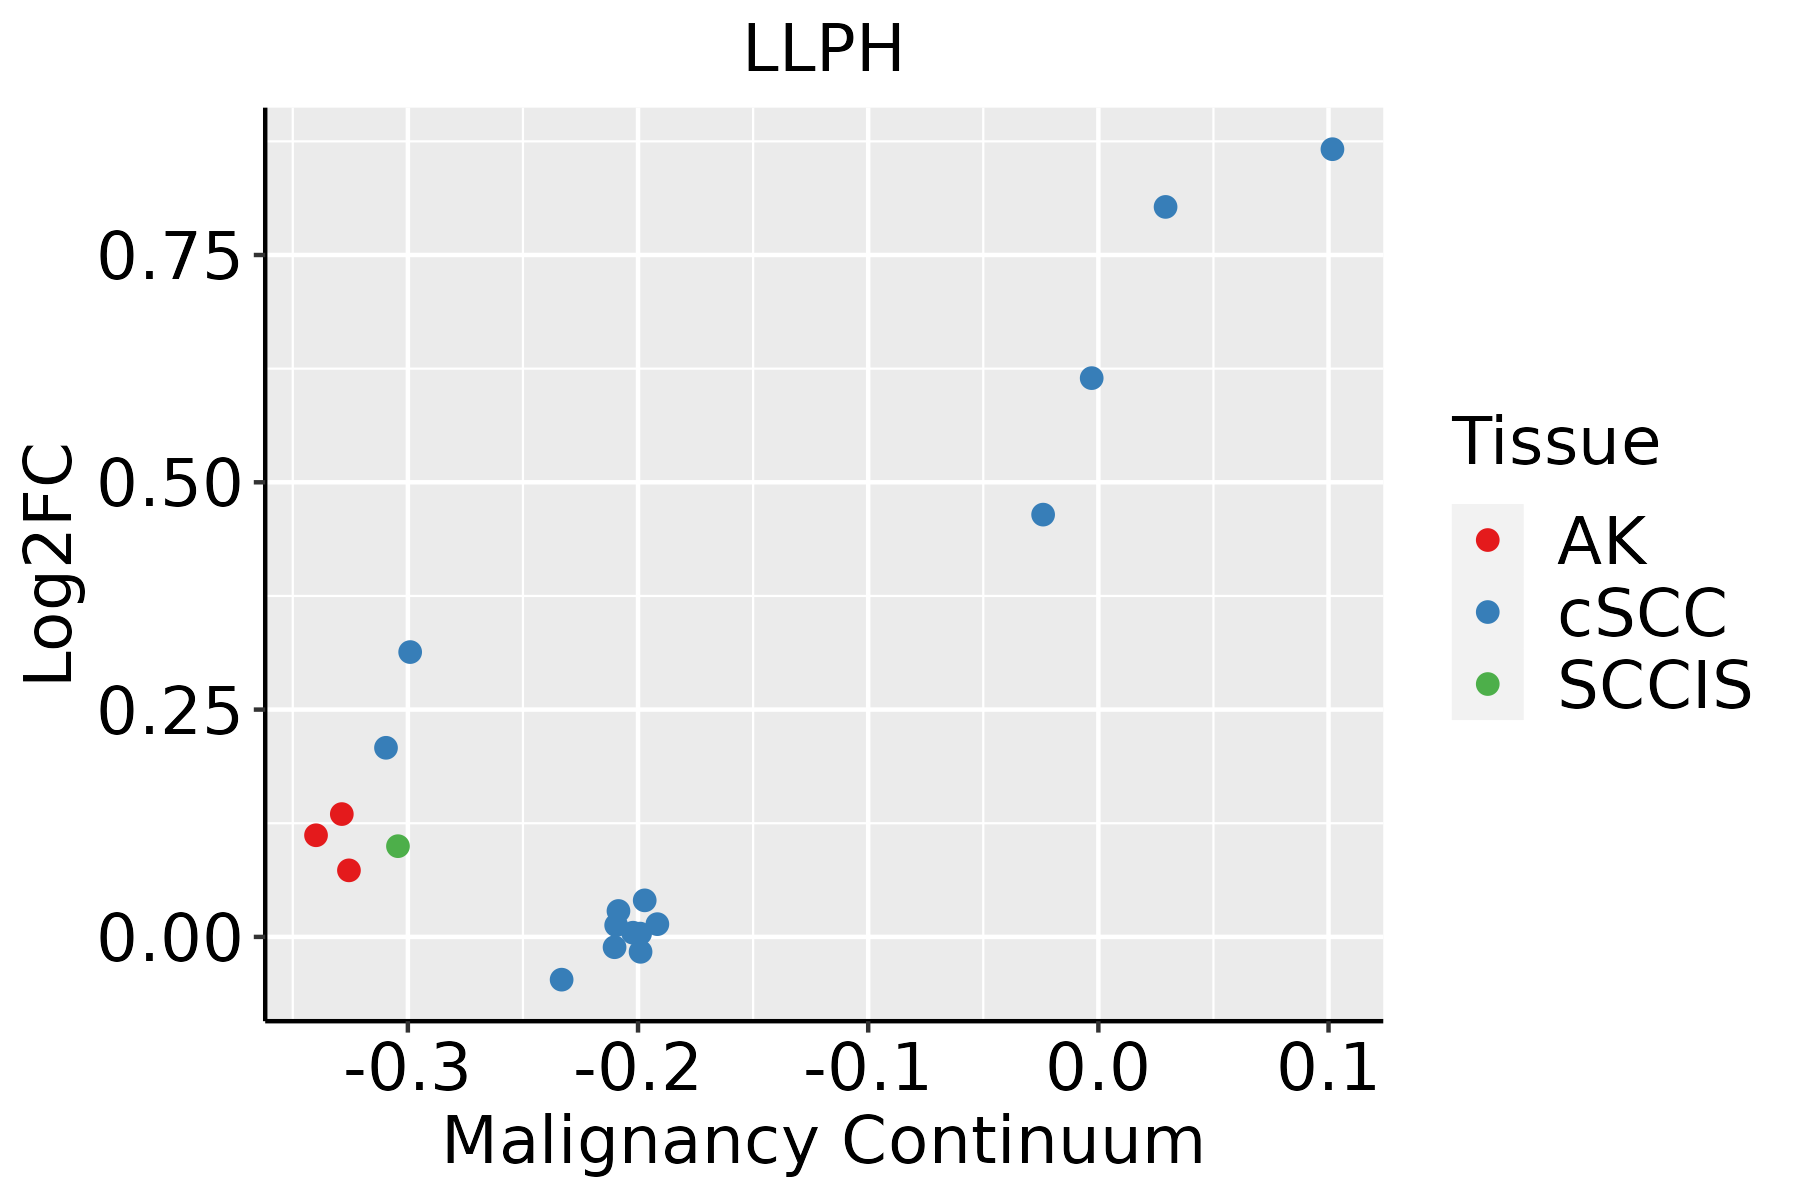 | AK: Actinic keratosis |
| cSCC: Cutaneous squamous cell carcinoma | ||
| SCCIS:squamous cell carcinoma in situ | ||
| Thyroid | 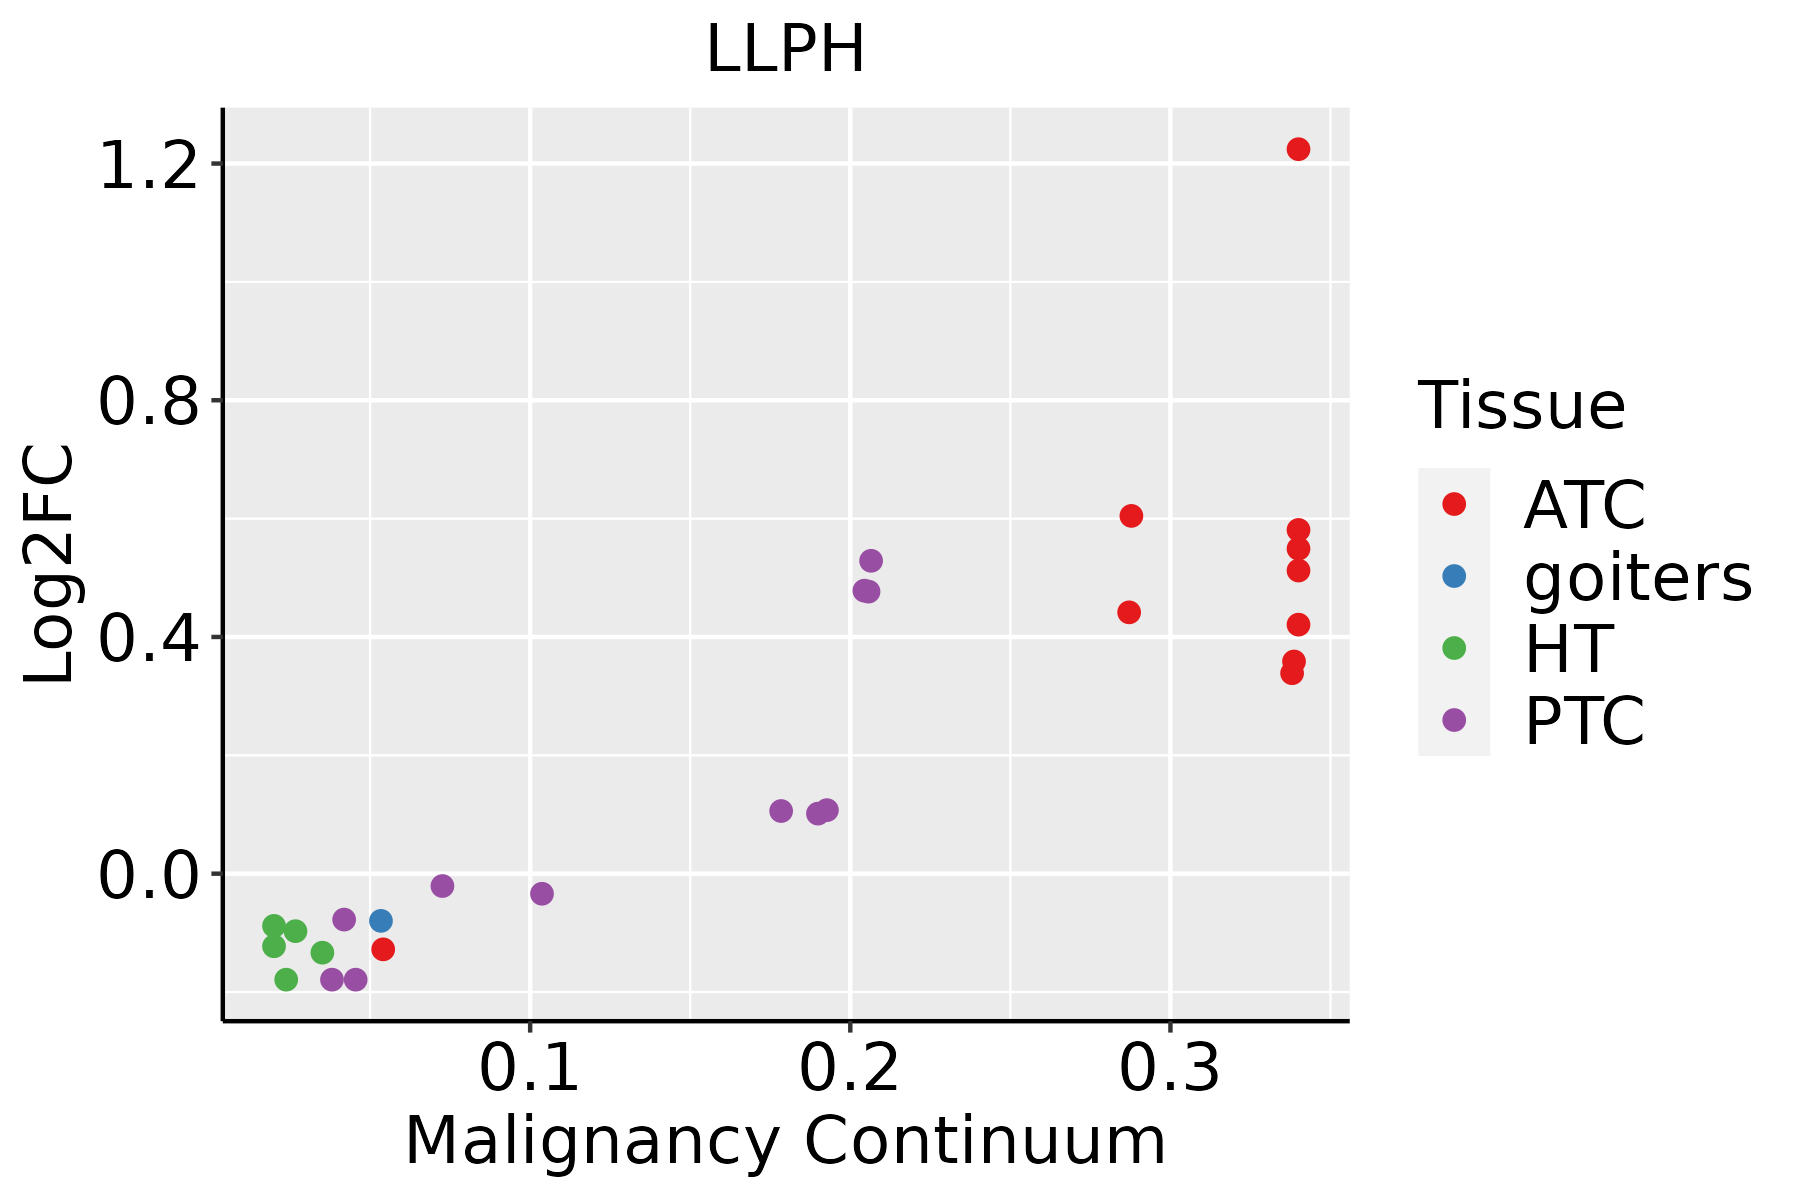 | ATC: Anaplastic thyroid cancer |
| HT: Hashimoto's thyroiditis | ||
| PTC: Papillary thyroid cancer |
| ∗log2FC in expression of this searched gene in stem-like cells from each diseased tissue sample relative to stem-like cells in normal samples in each tissue plotted against the malignancy continuum. Samples are colored based on if they are from different disease stage. |
Top |
Malignant transformation related pathway analysis |
| Find out the enriched GO biological processes and KEGG pathways involved in transition from healthy to precancer to cancer |
| Tissue | Disease Stage | Enriched GO biological Processes |
| Colorectum | AD |  |
| Colorectum | SER |  |
| Colorectum | MSS |  |
| Colorectum | MSI-H |  |
| Colorectum | FAP |  |
| ∗Top 15 enriched GO BP terms are showed in the bar plot of each disease state in each tissue. Each row represents a significant GO biological process which is colored according to the -log10(p.adjust). |
| Page: 1 2 3 4 5 6 7 8 9 |
| GO ID | Tissue | Disease Stage | Description | Gene Ratio | Bg Ratio | pvalue | p.adjust | Count |
| GO:001604919 | Esophagus | HGIN | cell growth | 93/2587 | 482/18723 | 4.49e-04 | 6.62e-03 | 93 |
| GO:0016049110 | Esophagus | ESCC | cell growth | 289/8552 | 482/18723 | 1.29e-10 | 3.77e-09 | 289 |
| GO:006056010 | Esophagus | ESCC | developmental growth involved in morphogenesis | 131/8552 | 234/18723 | 9.28e-04 | 4.73e-03 | 131 |
| GO:001635816 | Esophagus | ESCC | dendrite development | 130/8552 | 243/18723 | 8.33e-03 | 2.95e-02 | 130 |
| GO:004858810 | Esophagus | ESCC | developmental cell growth | 125/8552 | 234/18723 | 1.01e-02 | 3.46e-02 | 125 |
| GO:001604911 | Liver | Cirrhotic | cell growth | 160/4634 | 482/18723 | 1.50e-05 | 2.07e-04 | 160 |
| GO:001604921 | Liver | HCC | cell growth | 269/7958 | 482/18723 | 1.84e-09 | 5.35e-08 | 269 |
| GO:006056011 | Liver | HCC | developmental growth involved in morphogenesis | 124/7958 | 234/18723 | 7.37e-04 | 4.47e-03 | 124 |
| GO:199013811 | Liver | HCC | neuron projection extension | 92/7958 | 172/18723 | 2.31e-03 | 1.14e-02 | 92 |
| GO:004858811 | Liver | HCC | developmental cell growth | 121/7958 | 234/18723 | 2.68e-03 | 1.28e-02 | 121 |
| GO:0060999 | Liver | HCC | positive regulation of dendritic spine development | 27/7958 | 42/18723 | 3.60e-03 | 1.60e-02 | 27 |
| GO:006099611 | Liver | HCC | dendritic spine development | 54/7958 | 99/18723 | 1.03e-02 | 3.86e-02 | 54 |
| GO:001635811 | Liver | HCC | dendrite development | 121/7958 | 243/18723 | 1.26e-02 | 4.56e-02 | 121 |
| GO:00609981 | Liver | HCC | regulation of dendritic spine development | 35/7958 | 61/18723 | 1.35e-02 | 4.82e-02 | 35 |
| GO:001604917 | Oral cavity | OSCC | cell growth | 268/7305 | 482/18723 | 6.55e-14 | 3.51e-12 | 268 |
| GO:00485889 | Oral cavity | OSCC | developmental cell growth | 116/7305 | 234/18723 | 6.20e-04 | 3.50e-03 | 116 |
| GO:00605609 | Oral cavity | OSCC | developmental growth involved in morphogenesis | 116/7305 | 234/18723 | 6.20e-04 | 3.50e-03 | 116 |
| GO:19901388 | Oral cavity | OSCC | neuron projection extension | 86/7305 | 172/18723 | 2.13e-03 | 9.80e-03 | 86 |
| GO:001635810 | Oral cavity | OSCC | dendrite development | 113/7305 | 243/18723 | 1.00e-02 | 3.49e-02 | 113 |
| GO:00609967 | Oral cavity | OSCC | dendritic spine development | 50/7305 | 99/18723 | 1.31e-02 | 4.34e-02 | 50 |
| Page: 1 2 3 |
| Pathway ID | Tissue | Disease Stage | Description | Gene Ratio | Bg Ratio | pvalue | p.adjust | qvalue | Count |
| Page: 1 |
Top |
Cell-cell communication analysis |
| Identification of potential cell-cell interactions between two cell types and their ligand-receptor pairs for different disease states |
| Ligand | Receptor | LRpair | Pathway | Tissue | Disease Stage |
| Page: 1 |
Top |
Single-cell gene regulatory network inference analysis |
| Find out the significant the regulons (TFs) and the target genes of each regulon across cell types for different disease states |
| TF | Cell Type | Tissue | Disease Stage | Target Gene | RSS | Regulon Activity |
| ∗The dot plots of a searched regulon are shown for all cell subpopulations in each disease state of each tissue based on the regulon specific score inferred using pySCENIC and by calculating the average expression. |
| Page: 1 |
Top |
Somatic mutation of malignant transformation related genes |
| Annotation of somatic variants for genes involved in malignant transformation |
| Hugo Symbol | Variant Class | Variant Classification | dbSNP RS | HGVSc | HGVSp | HGVSp Short | SWISSPROT | BIOTYPE | SIFT | PolyPhen | Tumor Sample Barcode | Tissue | Histology | Sex | Age | Stage | Therapy Types | Drugs | Outcome |
| LLPH | SNV | Missense_Mutation | c.346N>C | p.Ser116Arg | p.S116R | Q9BRT6 | protein_coding | tolerated(0.35) | benign(0.04) | TCGA-BI-A0VS-01 | Cervix | cervical & endocervical cancer | Female | <65 | I/II | Unknown | Unknown | SD | |
| LLPH | SNV | Missense_Mutation | rs375541513 | c.202N>T | p.Asp68Tyr | p.D68Y | Q9BRT6 | protein_coding | deleterious(0.01) | possibly_damaging(0.593) | TCGA-CA-6717-01 | Colorectum | colon adenocarcinoma | Male | <65 | I/II | Chemotherapy | oxaliplatin | CR |
| LLPH | SNV | Missense_Mutation | novel | c.212N>G | p.Asp71Gly | p.D71G | Q9BRT6 | protein_coding | tolerated(0.24) | benign(0.011) | TCGA-G4-6586-01 | Colorectum | colon adenocarcinoma | Female | >=65 | I/II | Unknown | Unknown | SD |
| LLPH | SNV | Missense_Mutation | novel | c.60N>T | p.Lys20Asn | p.K20N | Q9BRT6 | protein_coding | deleterious(0.04) | probably_damaging(0.999) | TCGA-F5-6814-01 | Colorectum | rectum adenocarcinoma | Male | <65 | I/II | Unknown | Unknown | SD |
| LLPH | insertion | Frame_Shift_Ins | novel | c.10_11insAA | p.Ser4LysfsTer33 | p.S4Kfs*33 | Q9BRT6 | protein_coding | TCGA-CM-6162-01 | Colorectum | colon adenocarcinoma | Female | <65 | III/IV | Chemotherapy | oxaliplatin | SD | ||
| LLPH | SNV | Missense_Mutation | novel | c.281N>A | p.Pro94Gln | p.P94Q | Q9BRT6 | protein_coding | deleterious(0) | probably_damaging(0.99) | TCGA-AP-A059-01 | Endometrium | uterine corpus endometrioid carcinoma | Female | >=65 | I/II | Unknown | Unknown | SD |
| LLPH | SNV | Missense_Mutation | novel | c.319N>A | p.Ala107Thr | p.A107T | Q9BRT6 | protein_coding | tolerated(0.05) | possibly_damaging(0.701) | TCGA-AP-A1DK-01 | Endometrium | uterine corpus endometrioid carcinoma | Female | <65 | I/II | Unknown | Unknown | SD |
| LLPH | SNV | Missense_Mutation | novel | c.73G>C | p.Glu25Gln | p.E25Q | Q9BRT6 | protein_coding | deleterious(0) | probably_damaging(0.999) | TCGA-B5-A11I-01 | Endometrium | uterine corpus endometrioid carcinoma | Female | >=65 | III/IV | Chemotherapy | paclitaxel | PD |
| LLPH | SNV | Missense_Mutation | novel | c.72G>C | p.Lys24Asn | p.K24N | Q9BRT6 | protein_coding | deleterious(0) | possibly_damaging(0.864) | TCGA-B5-A11I-01 | Endometrium | uterine corpus endometrioid carcinoma | Female | >=65 | III/IV | Chemotherapy | paclitaxel | PD |
| LLPH | SNV | Missense_Mutation | novel | c.41N>A | p.Arg14His | p.R14H | Q9BRT6 | protein_coding | tolerated(0.06) | probably_damaging(0.966) | TCGA-BS-A0VI-01 | Endometrium | uterine corpus endometrioid carcinoma | Female | <65 | I/II | Unknown | Unknown | SD |
| Page: 1 2 |
Top |
Related drugs of malignant transformation related genes |
| Identification of chemicals and drugs interact with genes involved in malignant transfromation |
| (DGIdb 4.0) |
| Entrez ID | Symbol | Category | Interaction Types | Drug Claim Name | Drug Name | PMIDs |
| Page: 1 |

Copyright 2023-Present -The University of Texas Health Science Center at Houston |