
|
|||||
|
 | |
| |
| |
| |
| |
| |
|
Gene: LITAF |
Gene summary for LITAF |
| Gene information | Species | Human | Gene symbol | LITAF | Gene ID | 9516 |
| Gene name | lipopolysaccharide induced TNF factor | |
| Gene Alias | PIG7 | |
| Cytomap | 16p13.13 | |
| Gene Type | protein-coding | GO ID | GO:0001816 | UniProtAcc | Q99732 |
Top |
Malignant transformation analysis |
| Identification of the aberrant gene expression in precancerous and cancerous lesions by comparing the gene expression of stem-like cells in diseased tissues with normal stem cells |
| Entrez ID | Symbol | Replicates | Species | Organ | Tissue | Adj P-value | Log2FC | Malignancy |
| 9516 | LITAF | GSM4909282 | Human | Breast | IDC | 7.18e-25 | 5.58e-01 | -0.0288 |
| 9516 | LITAF | GSM4909285 | Human | Breast | IDC | 1.49e-07 | -2.49e-01 | 0.21 |
| 9516 | LITAF | GSM4909286 | Human | Breast | IDC | 3.13e-27 | -6.25e-01 | 0.1081 |
| 9516 | LITAF | GSM4909293 | Human | Breast | IDC | 1.30e-04 | -1.64e-01 | 0.1581 |
| 9516 | LITAF | GSM4909294 | Human | Breast | IDC | 2.13e-08 | -3.37e-01 | 0.2022 |
| 9516 | LITAF | GSM4909296 | Human | Breast | IDC | 8.48e-19 | -4.90e-01 | 0.1524 |
| 9516 | LITAF | GSM4909297 | Human | Breast | IDC | 6.74e-30 | -5.66e-01 | 0.1517 |
| 9516 | LITAF | GSM4909302 | Human | Breast | IDC | 2.99e-05 | -2.96e-01 | 0.1545 |
| 9516 | LITAF | GSM4909304 | Human | Breast | IDC | 3.19e-04 | -3.01e-01 | 0.1636 |
| 9516 | LITAF | GSM4909307 | Human | Breast | IDC | 1.10e-03 | -3.33e-01 | 0.1569 |
| 9516 | LITAF | GSM4909309 | Human | Breast | IDC | 1.39e-02 | -1.66e-01 | 0.0483 |
| 9516 | LITAF | GSM4909311 | Human | Breast | IDC | 1.06e-34 | -5.71e-01 | 0.1534 |
| 9516 | LITAF | GSM4909312 | Human | Breast | IDC | 9.52e-14 | -2.54e-01 | 0.1552 |
| 9516 | LITAF | GSM4909315 | Human | Breast | IDC | 1.03e-07 | -4.31e-01 | 0.21 |
| 9516 | LITAF | GSM4909316 | Human | Breast | IDC | 6.35e-07 | -5.27e-01 | 0.21 |
| 9516 | LITAF | GSM4909318 | Human | Breast | IDC | 5.34e-03 | -5.10e-01 | 0.2031 |
| 9516 | LITAF | GSM4909319 | Human | Breast | IDC | 2.10e-50 | -3.83e-01 | 0.1563 |
| 9516 | LITAF | GSM4909320 | Human | Breast | IDC | 6.47e-17 | -7.18e-01 | 0.1575 |
| 9516 | LITAF | GSM4909321 | Human | Breast | IDC | 4.24e-22 | -3.71e-01 | 0.1559 |
| 9516 | LITAF | NCCBC14 | Human | Breast | DCIS | 3.36e-15 | -2.60e-01 | 0.2021 |
| Page: 1 2 3 4 5 6 7 8 9 10 11 |
| Tissue | Expression Dynamics | Abbreviation |
| Breast | 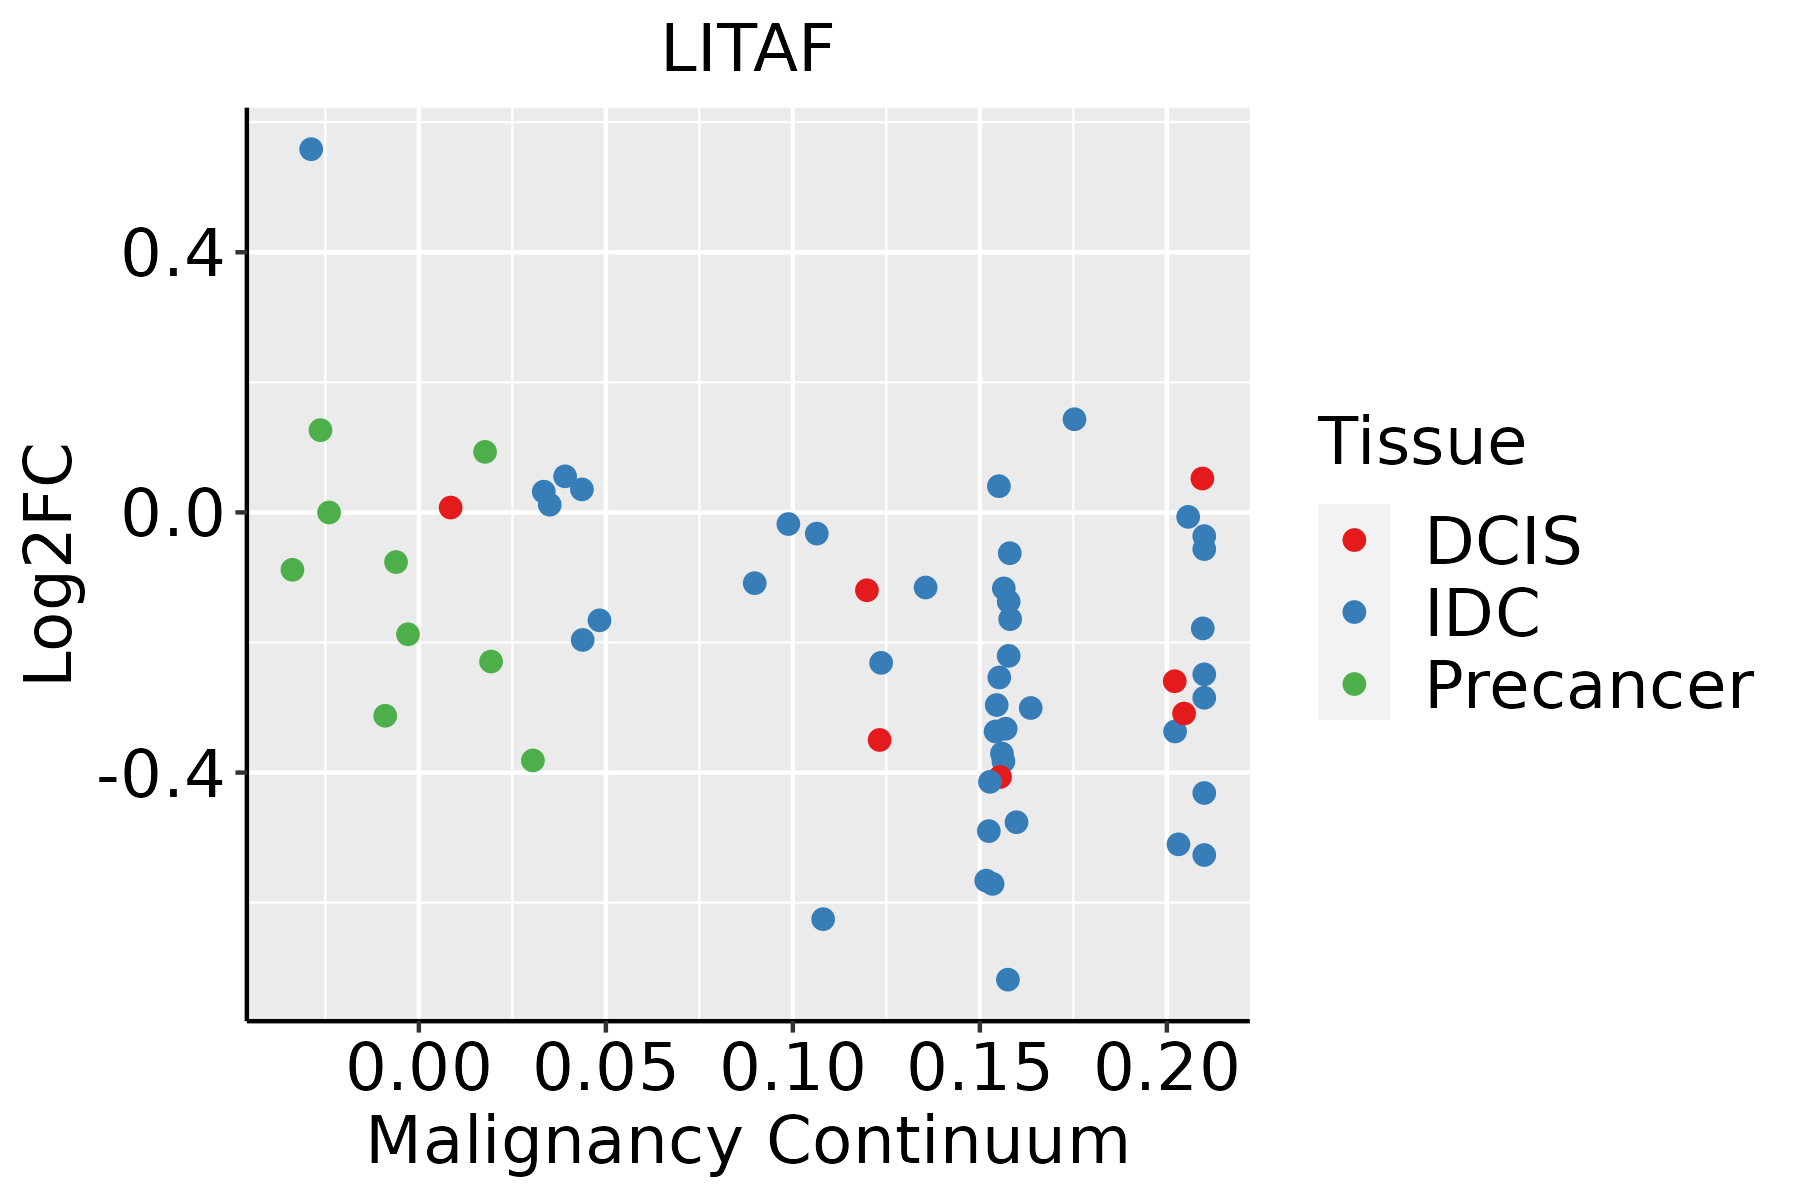 | IDC: Invasive ductal carcinoma |
| DCIS: Ductal carcinoma in situ | ||
| Precancer(BRCA1-mut): Precancerous lesion from BRCA1 mutation carriers | ||
| Colorectum (GSE201348) | 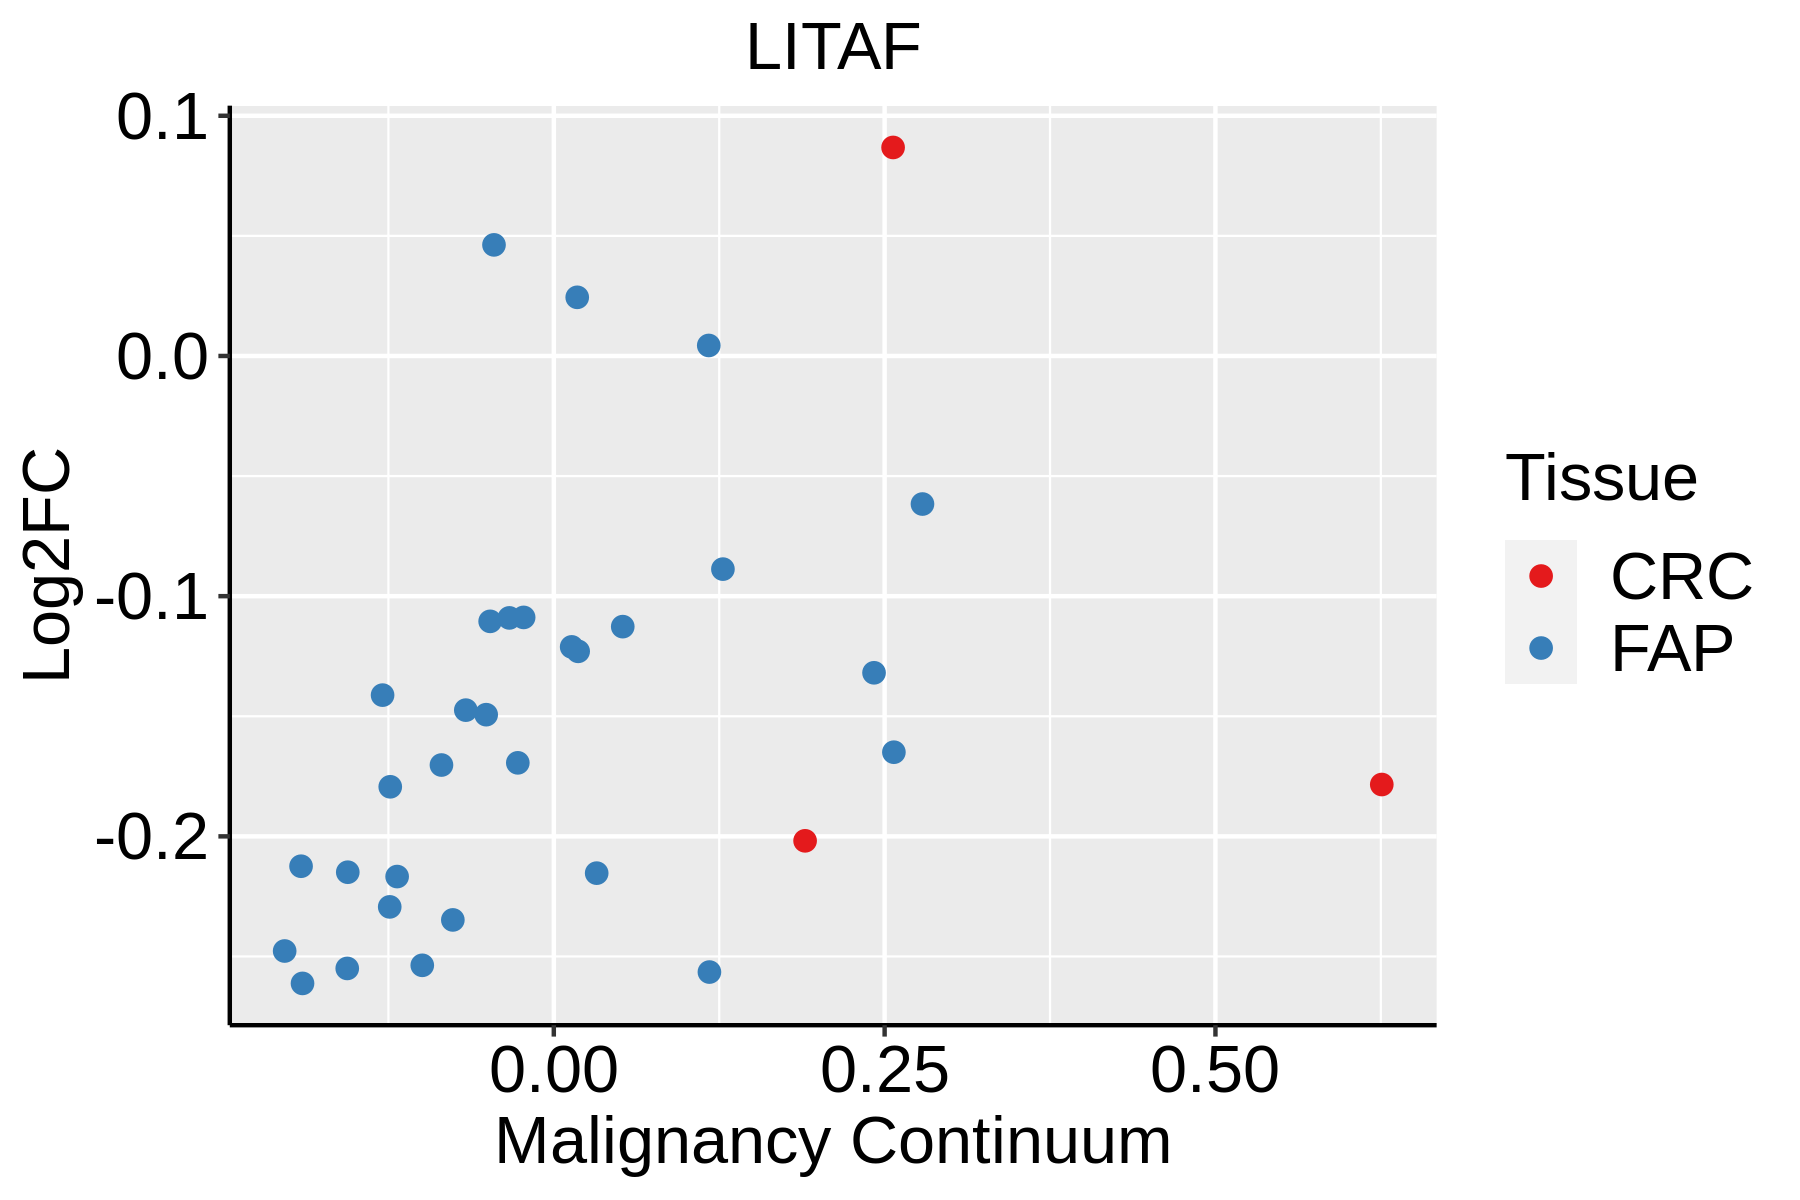 | FAP: Familial adenomatous polyposis |
| CRC: Colorectal cancer | ||
| Colorectum (HTA11) |  | AD: Adenomas |
| SER: Sessile serrated lesions | ||
| MSI-H: Microsatellite-high colorectal cancer | ||
| MSS: Microsatellite stable colorectal cancer | ||
| Endometrium | 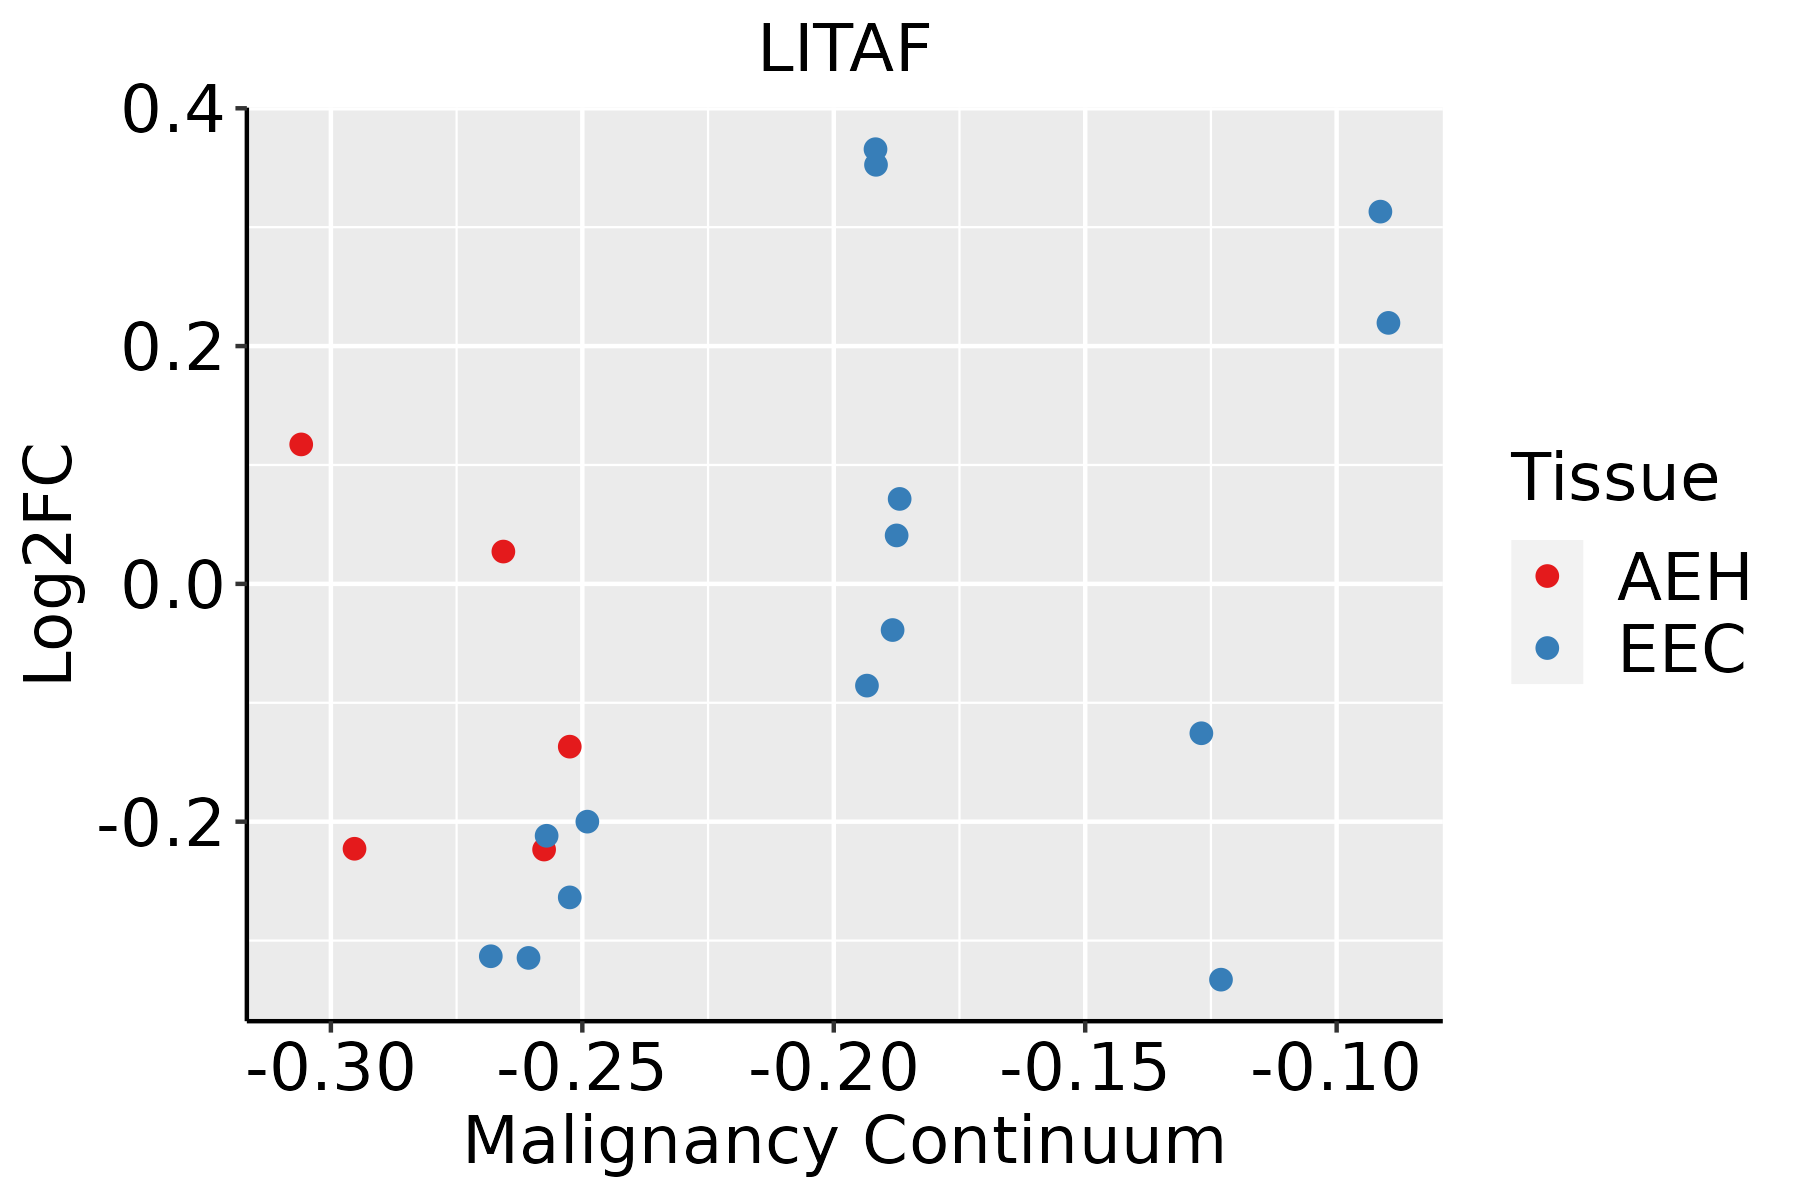 | AEH: Atypical endometrial hyperplasia |
| EEC: Endometrioid Cancer | ||
| Esophagus | 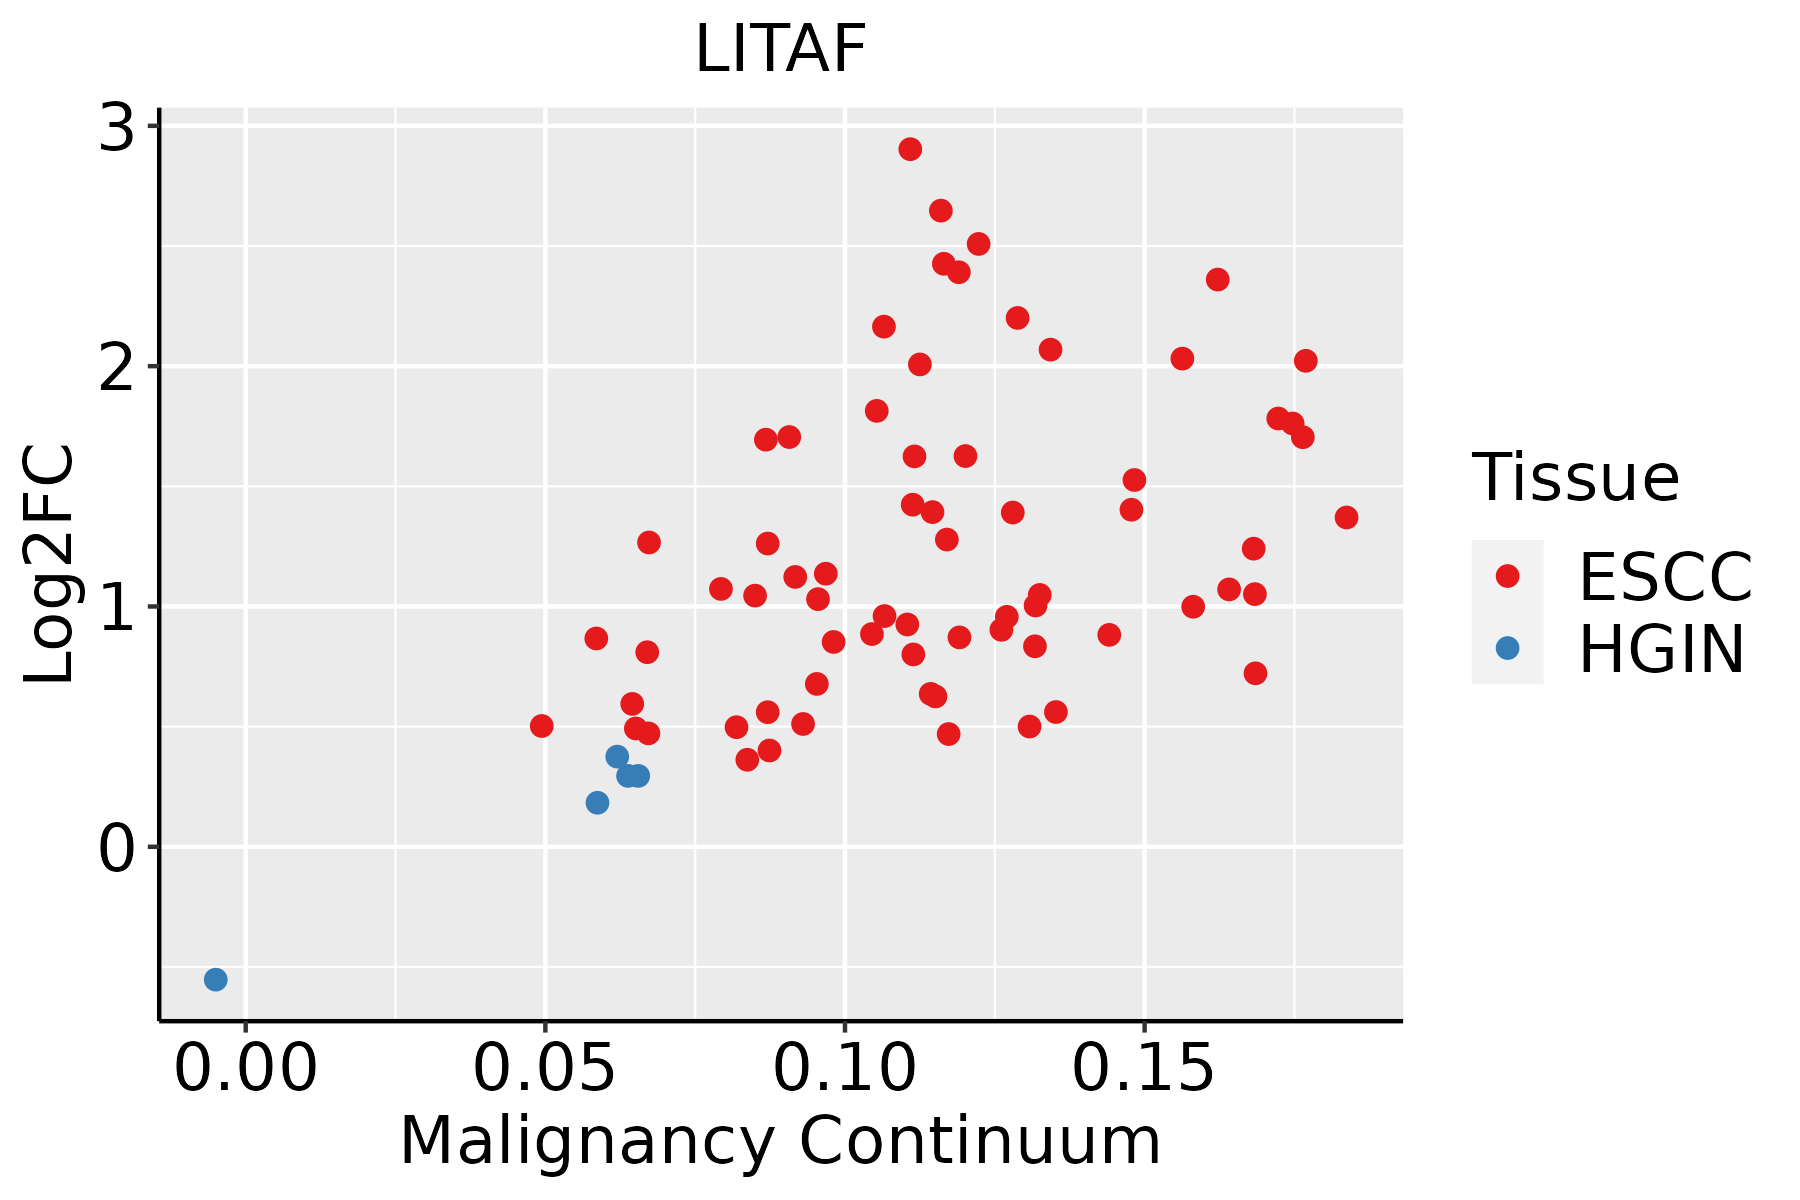 | ESCC: Esophageal squamous cell carcinoma |
| HGIN: High-grade intraepithelial neoplasias | ||
| LGIN: Low-grade intraepithelial neoplasias | ||
| Liver | 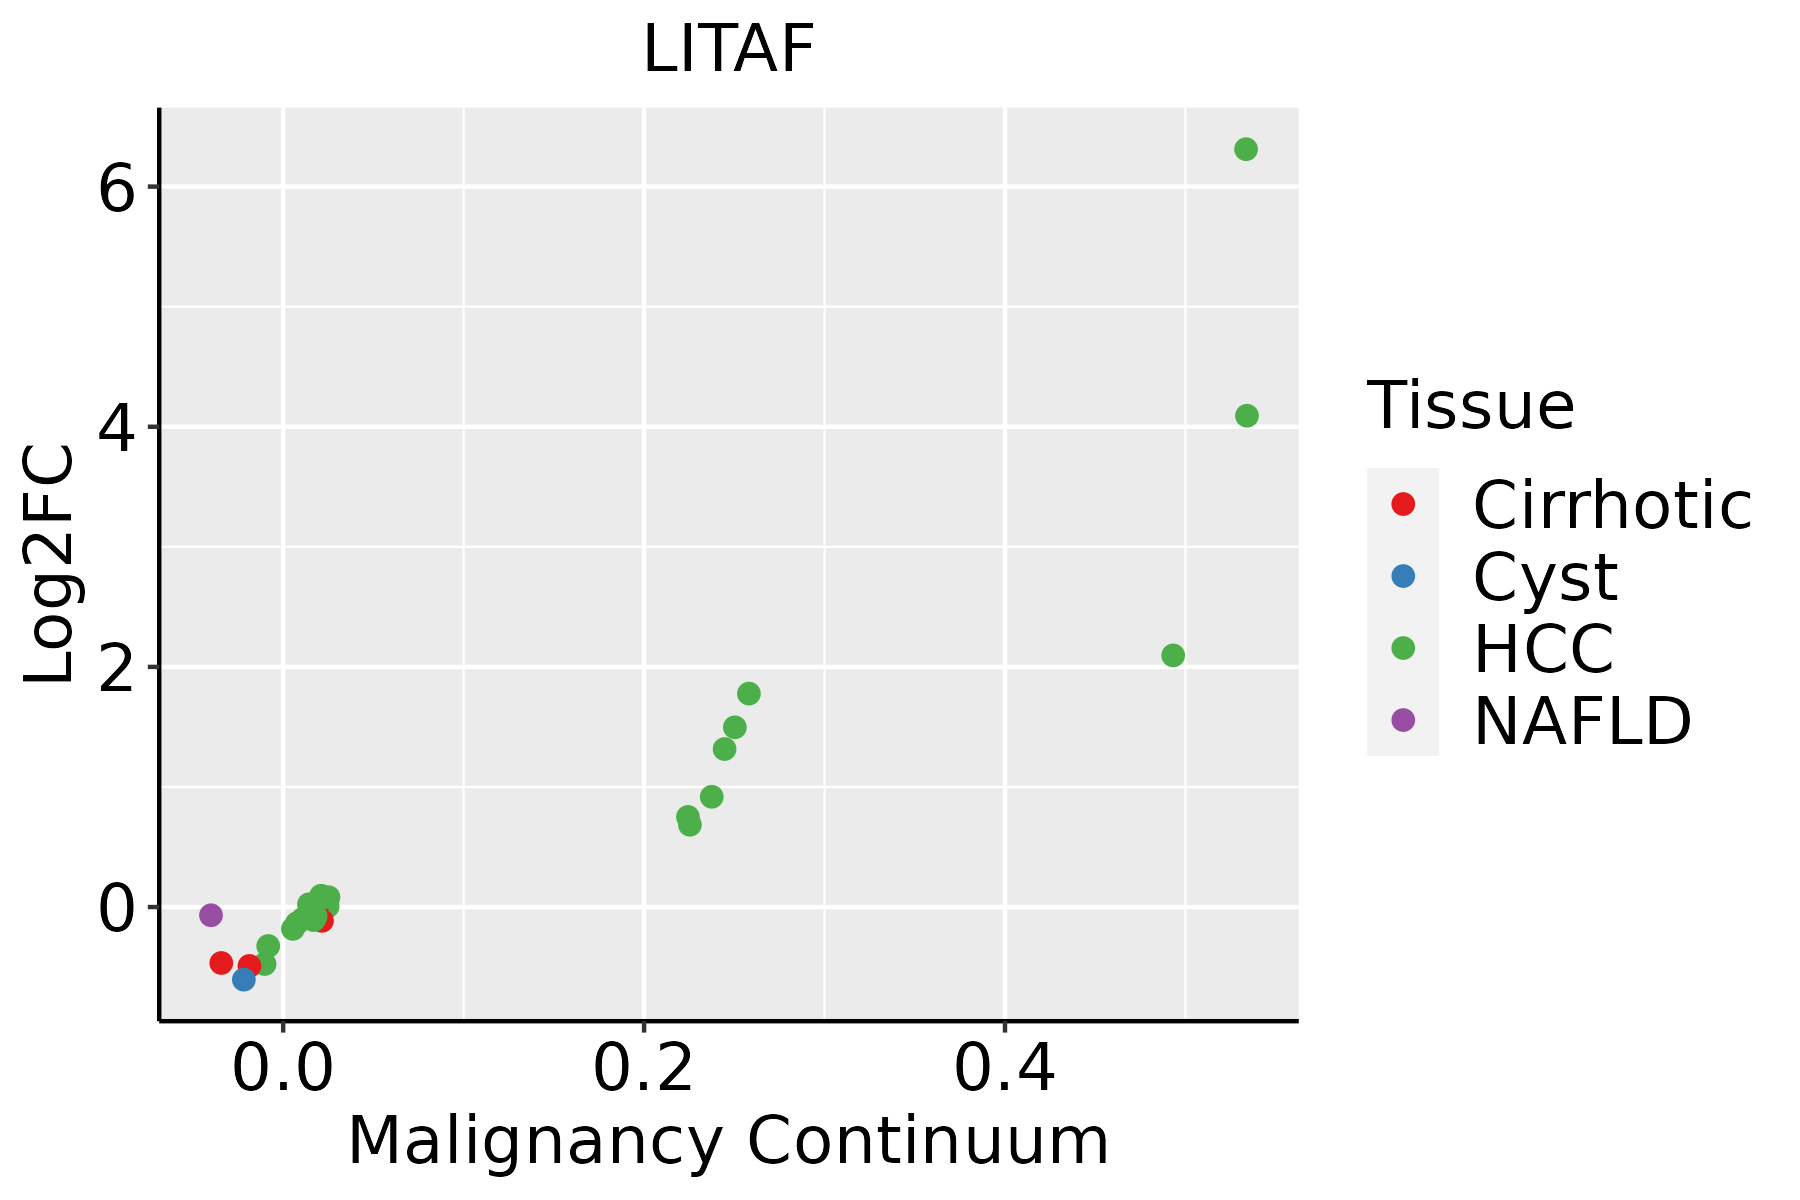 | HCC: Hepatocellular carcinoma |
| NAFLD: Non-alcoholic fatty liver disease | ||
| Oral Cavity |  | EOLP: Erosive Oral lichen planus |
| LP: leukoplakia | ||
| NEOLP: Non-erosive oral lichen planus | ||
| OSCC: Oral squamous cell carcinoma | ||
| Prostate | 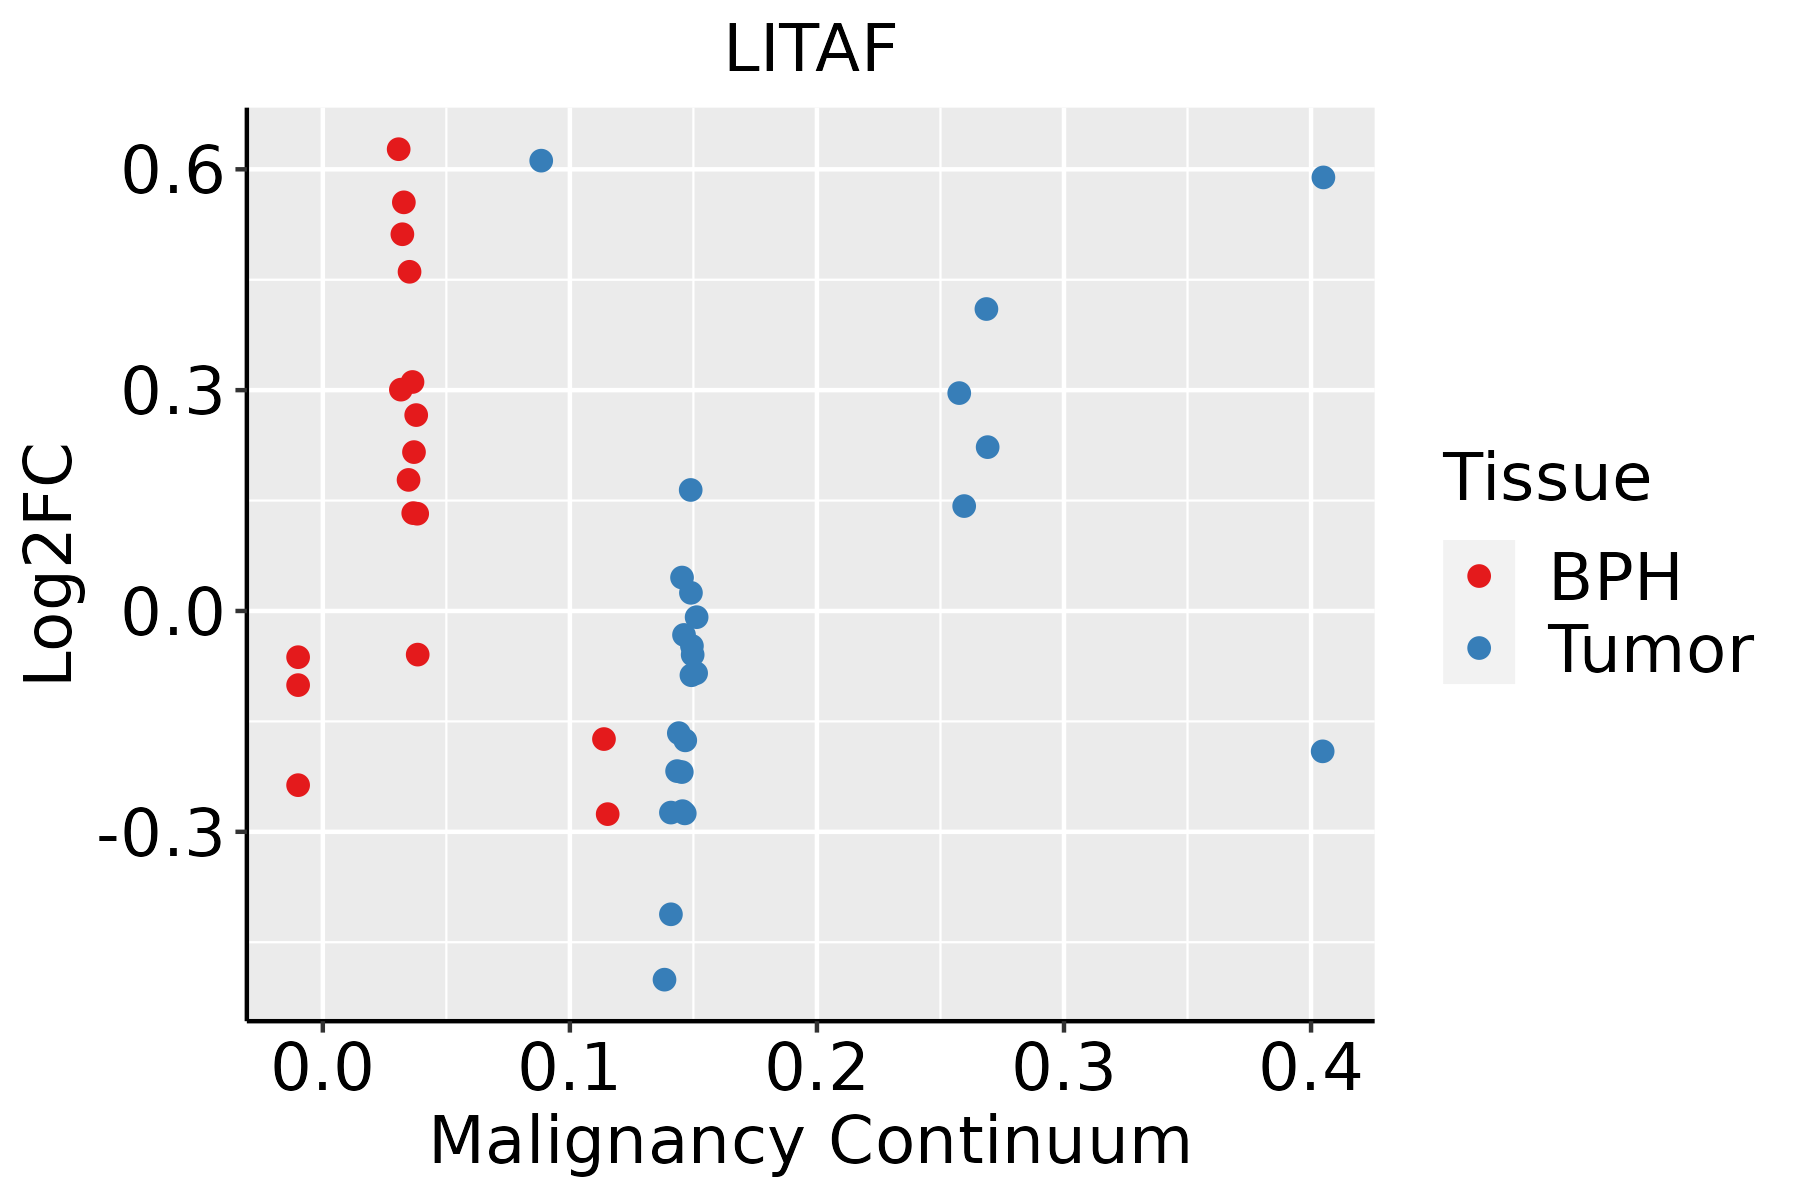 | BPH: Benign Prostatic Hyperplasia |
| Skin |  | AK: Actinic keratosis |
| cSCC: Cutaneous squamous cell carcinoma | ||
| SCCIS:squamous cell carcinoma in situ | ||
| Thyroid | 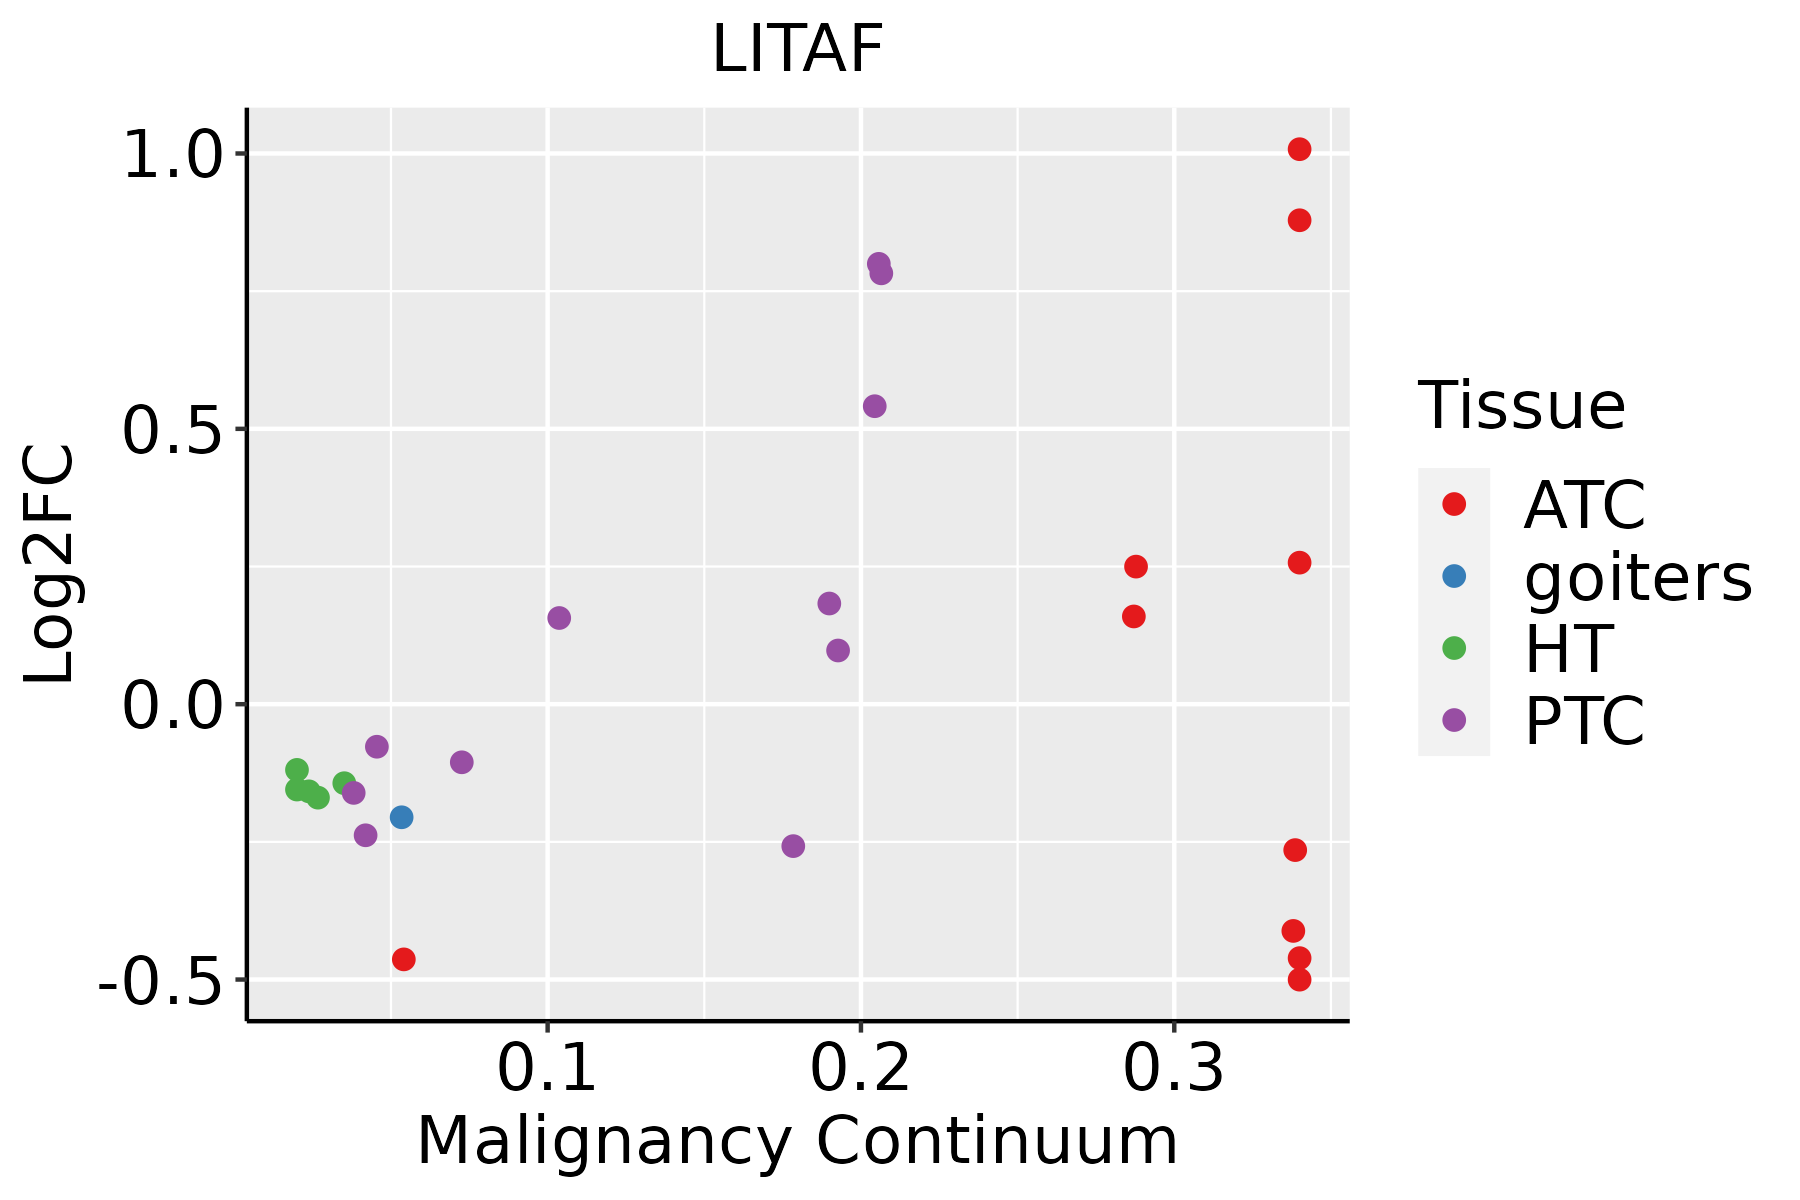 | ATC: Anaplastic thyroid cancer |
| HT: Hashimoto's thyroiditis | ||
| PTC: Papillary thyroid cancer |
| ∗log2FC in expression of this searched gene in stem-like cells from each diseased tissue sample relative to stem-like cells in normal samples in each tissue plotted against the malignancy continuum. Samples are colored based on if they are from different disease stage. |
Top |
Malignant transformation related pathway analysis |
| Find out the enriched GO biological processes and KEGG pathways involved in transition from healthy to precancer to cancer |
| Tissue | Disease Stage | Enriched GO biological Processes |
| Colorectum | AD |  |
| Colorectum | SER |  |
| Colorectum | MSS |  |
| Colorectum | MSI-H |  |
| Colorectum | FAP |  |
| ∗Top 15 enriched GO BP terms are showed in the bar plot of each disease state in each tissue. Each row represents a significant GO biological process which is colored according to the -log10(p.adjust). |
| Page: 1 2 3 4 5 6 7 8 9 |
| GO ID | Tissue | Disease Stage | Description | Gene Ratio | Bg Ratio | pvalue | p.adjust | Count |
| GO:000756813 | Breast | IDC | aging | 52/1434 | 339/18723 | 1.14e-06 | 5.10e-05 | 52 |
| GO:003249612 | Breast | IDC | response to lipopolysaccharide | 47/1434 | 343/18723 | 7.13e-05 | 1.43e-03 | 47 |
| GO:000223712 | Breast | IDC | response to molecule of bacterial origin | 49/1434 | 363/18723 | 7.40e-05 | 1.47e-03 | 49 |
| GO:00431227 | Breast | IDC | regulation of I-kappaB kinase/NF-kappaB signaling | 34/1434 | 249/18723 | 7.18e-04 | 8.77e-03 | 34 |
| GO:000724914 | Breast | IDC | I-kappaB kinase/NF-kappaB signaling | 37/1434 | 281/18723 | 8.58e-04 | 9.98e-03 | 37 |
| GO:00431236 | Breast | IDC | positive regulation of I-kappaB kinase/NF-kappaB signaling | 26/1434 | 186/18723 | 2.06e-03 | 1.95e-02 | 26 |
| GO:007122211 | Breast | IDC | cellular response to lipopolysaccharide | 28/1434 | 209/18723 | 2.68e-03 | 2.39e-02 | 28 |
| GO:007121611 | Breast | IDC | cellular response to biotic stimulus | 31/1434 | 246/18723 | 4.23e-03 | 3.31e-02 | 31 |
| GO:007121911 | Breast | IDC | cellular response to molecule of bacterial origin | 28/1434 | 221/18723 | 5.88e-03 | 4.24e-02 | 28 |
| GO:000756823 | Breast | DCIS | aging | 50/1390 | 339/18723 | 2.38e-06 | 8.46e-05 | 50 |
| GO:003249621 | Breast | DCIS | response to lipopolysaccharide | 46/1390 | 343/18723 | 6.83e-05 | 1.35e-03 | 46 |
| GO:000223722 | Breast | DCIS | response to molecule of bacterial origin | 48/1390 | 363/18723 | 6.84e-05 | 1.35e-03 | 48 |
| GO:004312214 | Breast | DCIS | regulation of I-kappaB kinase/NF-kappaB signaling | 32/1390 | 249/18723 | 1.67e-03 | 1.66e-02 | 32 |
| GO:000724923 | Breast | DCIS | I-kappaB kinase/NF-kappaB signaling | 35/1390 | 281/18723 | 1.80e-03 | 1.74e-02 | 35 |
| GO:007122221 | Breast | DCIS | cellular response to lipopolysaccharide | 27/1390 | 209/18723 | 3.43e-03 | 2.86e-02 | 27 |
| GO:007121621 | Breast | DCIS | cellular response to biotic stimulus | 30/1390 | 246/18723 | 4.99e-03 | 3.72e-02 | 30 |
| GO:004312313 | Breast | DCIS | positive regulation of I-kappaB kinase/NF-kappaB signaling | 24/1390 | 186/18723 | 5.66e-03 | 4.09e-02 | 24 |
| GO:007121921 | Breast | DCIS | cellular response to molecule of bacterial origin | 27/1390 | 221/18723 | 7.29e-03 | 4.92e-02 | 27 |
| GO:0043123 | Colorectum | AD | positive regulation of I-kappaB kinase/NF-kappaB signaling | 60/3918 | 186/18723 | 1.91e-04 | 2.56e-03 | 60 |
| GO:0043122 | Colorectum | AD | regulation of I-kappaB kinase/NF-kappaB signaling | 76/3918 | 249/18723 | 2.17e-04 | 2.85e-03 | 76 |
| Page: 1 2 3 4 5 6 7 8 |
| Pathway ID | Tissue | Disease Stage | Description | Gene Ratio | Bg Ratio | pvalue | p.adjust | qvalue | Count |
| hsa04142 | Colorectum | SER | Lysosome | 38/1580 | 132/8465 | 2.87e-03 | 2.03e-02 | 1.47e-02 | 38 |
| hsa041421 | Colorectum | SER | Lysosome | 38/1580 | 132/8465 | 2.87e-03 | 2.03e-02 | 1.47e-02 | 38 |
| hsa0414222 | Esophagus | ESCC | Lysosome | 102/4205 | 132/8465 | 5.11e-11 | 7.13e-10 | 3.65e-10 | 102 |
| hsa0414232 | Esophagus | ESCC | Lysosome | 102/4205 | 132/8465 | 5.11e-11 | 7.13e-10 | 3.65e-10 | 102 |
| hsa041424 | Liver | Cirrhotic | Lysosome | 68/2530 | 132/8465 | 1.34e-07 | 1.97e-06 | 1.21e-06 | 68 |
| hsa0414211 | Liver | Cirrhotic | Lysosome | 68/2530 | 132/8465 | 1.34e-07 | 1.97e-06 | 1.21e-06 | 68 |
| hsa041422 | Liver | HCC | Lysosome | 100/4020 | 132/8465 | 2.32e-11 | 4.31e-10 | 2.40e-10 | 100 |
| hsa041423 | Liver | HCC | Lysosome | 100/4020 | 132/8465 | 2.32e-11 | 4.31e-10 | 2.40e-10 | 100 |
| hsa041425 | Oral cavity | OSCC | Lysosome | 87/3704 | 132/8465 | 1.97e-07 | 1.35e-06 | 6.86e-07 | 87 |
| hsa0414212 | Oral cavity | OSCC | Lysosome | 87/3704 | 132/8465 | 1.97e-07 | 1.35e-06 | 6.86e-07 | 87 |
| hsa0414221 | Oral cavity | LP | Lysosome | 67/2418 | 132/8465 | 5.13e-08 | 7.77e-07 | 5.01e-07 | 67 |
| hsa0414231 | Oral cavity | LP | Lysosome | 67/2418 | 132/8465 | 5.13e-08 | 7.77e-07 | 5.01e-07 | 67 |
| Page: 1 |
Top |
Cell-cell communication analysis |
| Identification of potential cell-cell interactions between two cell types and their ligand-receptor pairs for different disease states |
| Ligand | Receptor | LRpair | Pathway | Tissue | Disease Stage |
| Page: 1 |
Top |
Single-cell gene regulatory network inference analysis |
| Find out the significant the regulons (TFs) and the target genes of each regulon across cell types for different disease states |
| TF | Cell Type | Tissue | Disease Stage | Target Gene | RSS | Regulon Activity |
| ∗The dot plots of a searched regulon are shown for all cell subpopulations in each disease state of each tissue based on the regulon specific score inferred using pySCENIC and by calculating the average expression. |
| Page: 1 |
Top |
Somatic mutation of malignant transformation related genes |
| Annotation of somatic variants for genes involved in malignant transformation |
| Hugo Symbol | Variant Class | Variant Classification | dbSNP RS | HGVSc | HGVSp | HGVSp Short | SWISSPROT | BIOTYPE | SIFT | PolyPhen | Tumor Sample Barcode | Tissue | Histology | Sex | Age | Stage | Therapy Types | Drugs | Outcome |
| LITAF | insertion | In_Frame_Ins | novel | c.318_319insGCCCCCACCCGCTTAATGCTAGGAGCACCACGCTCC | p.Gln106_Leu107insAlaProThrArgLeuMetLeuGlyAlaProArgSer | p.Q106_L107insAPTRLMLGAPRS | Q99732 | protein_coding | TCGA-BH-A0HF-01 | Breast | breast invasive carcinoma | Female | >=65 | I/II | Hormone Therapy | arimidex | SD | ||
| LITAF | SNV | Missense_Mutation | rs864622744 | c.479N>A | p.Arg160His | p.R160H | Q99732 | protein_coding | deleterious(0) | probably_damaging(0.966) | TCGA-AP-A056-01 | Endometrium | uterine corpus endometrioid carcinoma | Female | <65 | I/II | Unknown | Unknown | SD |
| LITAF | SNV | Missense_Mutation | c.370N>A | p.Leu124Met | p.L124M | Q99732 | protein_coding | deleterious(0.01) | probably_damaging(0.985) | TCGA-AP-A0LE-01 | Endometrium | uterine corpus endometrioid carcinoma | Female | <65 | I/II | Unknown | Unknown | SD | |
| LITAF | SNV | Missense_Mutation | novel | c.376G>T | p.Gly126Trp | p.G126W | Q99732 | protein_coding | deleterious(0) | probably_damaging(1) | TCGA-AP-A1DK-01 | Endometrium | uterine corpus endometrioid carcinoma | Female | <65 | I/II | Unknown | Unknown | SD |
| LITAF | SNV | Missense_Mutation | rs748017885 | c.478N>T | p.Arg160Cys | p.R160C | Q99732 | protein_coding | deleterious(0.02) | benign(0.156) | TCGA-AX-A1CE-01 | Endometrium | uterine corpus endometrioid carcinoma | Female | <65 | I/II | Unspecific | Paclitaxel | SD |
| LITAF | SNV | Missense_Mutation | novel | c.107N>A | p.Pro36His | p.P36H | Q99732 | protein_coding | deleterious(0.02) | benign(0.005) | TCGA-B5-A3FC-01 | Endometrium | uterine corpus endometrioid carcinoma | Female | <65 | I/II | Unknown | Unknown | SD |
| LITAF | SNV | Missense_Mutation | novel | c.383T>C | p.Ile128Thr | p.I128T | Q99732 | protein_coding | tolerated(0.07) | benign(0.038) | TCGA-BG-A220-01 | Endometrium | uterine corpus endometrioid carcinoma | Female | >=65 | I/II | Unknown | Unknown | SD |
| LITAF | SNV | Missense_Mutation | c.454N>G | p.Arg152Gly | p.R152G | Q99732 | protein_coding | tolerated(0.14) | benign(0.024) | TCGA-BS-A0UJ-01 | Endometrium | uterine corpus endometrioid carcinoma | Female | >=65 | I/II | Unknown | Unknown | SD | |
| LITAF | SNV | Missense_Mutation | novel | c.148G>T | p.Gly50Trp | p.G50W | Q99732 | protein_coding | tolerated(0.07) | probably_damaging(0.962) | TCGA-EY-A215-01 | Endometrium | uterine corpus endometrioid carcinoma | Female | <65 | I/II | Unknown | Unknown | SD |
| LITAF | SNV | Missense_Mutation | rs753060675 | c.55G>A | p.Ala19Thr | p.A19T | Q99732 | protein_coding | deleterious(0.01) | benign(0.278) | TCGA-FI-A2D5-01 | Endometrium | uterine corpus endometrioid carcinoma | Female | <65 | III/IV | Chemotherapy | carboplatinum | PD |
| Page: 1 2 |
Top |
Related drugs of malignant transformation related genes |
| Identification of chemicals and drugs interact with genes involved in malignant transfromation |
| (DGIdb 4.0) |
| Entrez ID | Symbol | Category | Interaction Types | Drug Claim Name | Drug Name | PMIDs |
| Page: 1 |

Copyright 2023-Present -The University of Texas Health Science Center at Houston |