Schematic overview of the cellular and molecular mechanisms involved in the cancer progression, including the proposed cellular and molecular mechanisms in cancer cells trajectory. AT1: alveolar type 1 cells; AT2: alveolar type 2 cells; AAH: atypical adenomatous hyperplasia; AIS: adenocarcinoma in situ; MIA: minimally invasive adenocarcinoma; IA: invasive adenocarcinoma; EMT: epithelial-mesenchymal transition

Home

Download

Statistics

Help

Contact

Center for Computational Systems Medicine
leaf

Gene summary

leaf

Malignant transformation analysis

leaf

Malignant transformation related pathway analysis

leaf

Cell-cell communication analysis

leaf

Single-cell gene regulatory network inference analysis

leaf

Somatic mutation of malignant transformation related genes

leaf

Related drugs of malignant transformation related genes

Gene: LIPH

Gene summary for LIPH

check button Gene summary.

Gene informationSpeciesHuman
Gene symbol

LIPH

Gene ID

200879

Gene namelipase H
Gene AliasAH
Cytomap3q27.2
Gene Typeprotein-coding
GO ID

GO:0006082

UniProtAcc

Q8WWY8


Top

Malignant transformation analysis

check button Identification of the aberrant gene expression in precancerous and cancerous lesions by comparing the gene expression of stem-like cells in diseased tissues with normal stem cells
check button Malignant transformation involving gene list.
Entrez IDSymbolReplicatesSpeciesOrganTissueAdj P-valueLog2FCMalignancy
200879LIPHHTA11_3410_2000001011HumanColorectumAD1.80e-02-3.81e-010.0155
200879LIPHHTA11_2487_2000001011HumanColorectumSER1.10e-024.05e-01-0.1808
200879LIPHHTA11_347_2000001011HumanColorectumAD1.04e-156.53e-01-0.1954
200879LIPHHTA11_411_2000001011HumanColorectumSER1.48e-041.09e+00-0.2602
200879LIPHHTA11_2112_2000001011HumanColorectumSER1.64e-048.83e-01-0.2196
200879LIPHHTA11_99999970781_79442HumanColorectumMSS4.61e-04-2.62e-010.294
200879LIPHHTA11_99999974143_84620HumanColorectumMSS3.65e-08-4.15e-010.3005
200879LIPHA002-C-010HumanColorectumFAP1.41e-03-2.28e-010.242
200879LIPHA015-C-203HumanColorectumFAP2.96e-16-3.16e-01-0.1294
200879LIPHA015-C-204HumanColorectumFAP4.73e-02-2.76e-01-0.0228
200879LIPHA002-C-201HumanColorectumFAP6.01e-08-3.97e-010.0324
200879LIPHA002-C-203HumanColorectumFAP2.69e-03-2.10e-010.2786
200879LIPHA001-C-119HumanColorectumFAP2.76e-03-1.33e-01-0.1557
200879LIPHA001-C-108HumanColorectumFAP7.00e-08-1.58e-01-0.0272
200879LIPHA002-C-205HumanColorectumFAP7.97e-11-3.33e-01-0.1236
200879LIPHA015-C-006HumanColorectumFAP5.43e-09-4.62e-01-0.0994
200879LIPHA015-C-106HumanColorectumFAP1.64e-07-2.10e-01-0.0511
200879LIPHA002-C-114HumanColorectumFAP6.89e-07-3.12e-01-0.1561
200879LIPHA015-C-104HumanColorectumFAP1.14e-19-3.85e-01-0.1899
200879LIPHA001-C-014HumanColorectumFAP1.18e-04-2.03e-010.0135
Page: 1 2 3 4 5 6 

check button Transcriptomic changes along malignancy continuum.
TissueExpression DynamicsAbbreviation
Colorectum (GSE201348)The image shows the transcriptomic changes along malignancy continuum.log2FC in expression of this searched gene in stem-like cells from each diseased tissue sample relative to stem-like cells in normal samples in each tissue plotted against the malignancy continuum. Samples are colored based on if they are from different disease stage.FAP: Familial adenomatous polyposis
CRC: Colorectal cancer
Colorectum (HTA11)The image shows the transcriptomic changes along malignancy continuum.log2FC in expression of this searched gene in stem-like cells from each diseased tissue sample relative to stem-like cells in normal samples in each tissue plotted against the malignancy continuum. Samples are colored based on if they are from different disease stage.AD: Adenomas
SER: Sessile serrated lesions
MSI-H: Microsatellite-high colorectal cancer
MSS: Microsatellite stable colorectal cancer
EsophagusThe image shows the transcriptomic changes along malignancy continuum.log2FC in expression of this searched gene in stem-like cells from each diseased tissue sample relative to stem-like cells in normal samples in each tissue plotted against the malignancy continuum. Samples are colored based on if they are from different disease stage.ESCC: Esophageal squamous cell carcinoma
HGIN: High-grade intraepithelial neoplasias
LGIN: Low-grade intraepithelial neoplasias
GCThe image shows the transcriptomic changes along malignancy continuum.log2FC in expression of this searched gene in stem-like cells from each diseased tissue sample relative to stem-like cells in normal samples in each tissue plotted against the malignancy continuum. Samples are colored based on if they are from different disease stage.
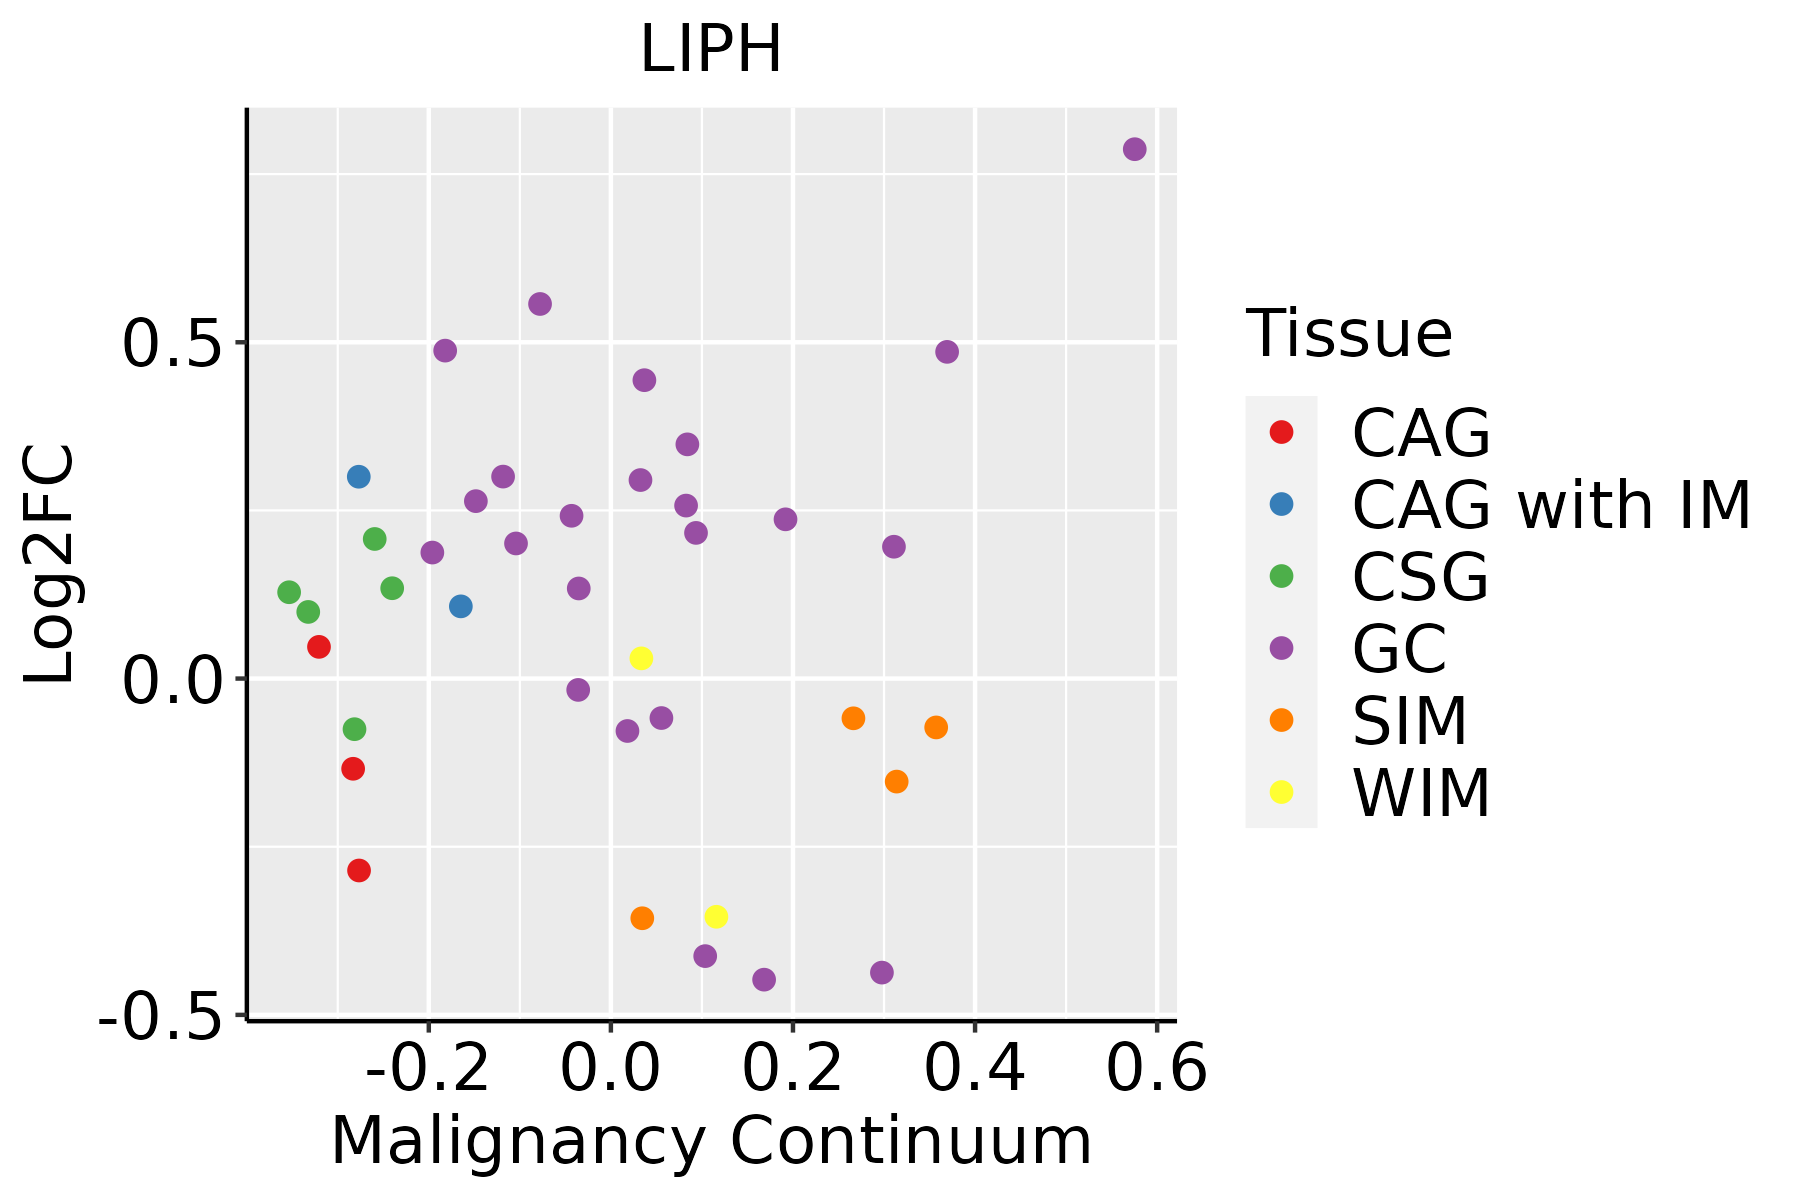
CAG: Chronic atrophic gastritis
CAG with IM: Chronic atrophic gastritis with intestinal metaplasia
CSG: Chronic superficial gastritis
GC: Gastric cancer
SIM: Severe intestinal metaplasia
WIM: Wild intestinal metaplasia
LiverThe image shows the transcriptomic changes along malignancy continuum.log2FC in expression of this searched gene in stem-like cells from each diseased tissue sample relative to stem-like cells in normal samples in each tissue plotted against the malignancy continuum. Samples are colored based on if they are from different disease stage.
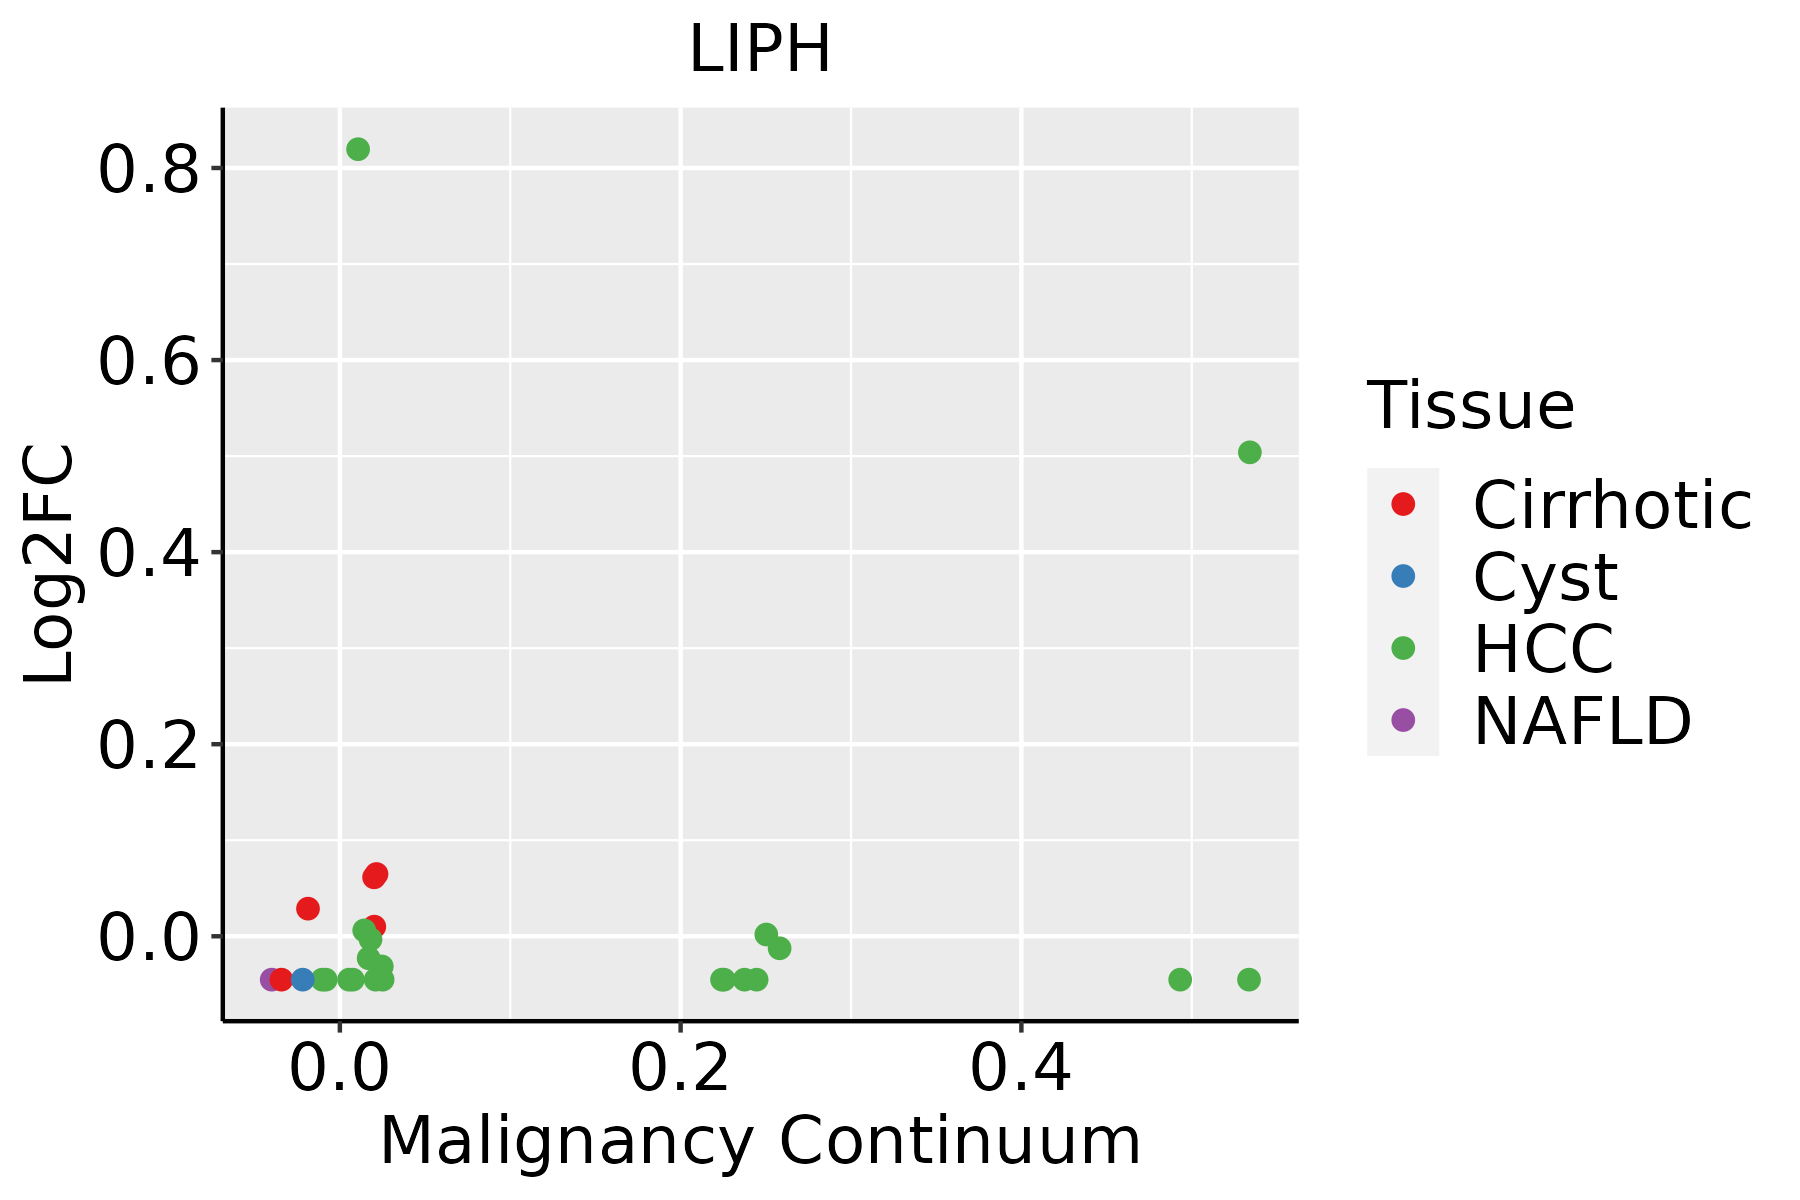
HCC: Hepatocellular carcinoma
NAFLD: Non-alcoholic fatty liver disease
LungThe image shows the transcriptomic changes along malignancy continuum.log2FC in expression of this searched gene in stem-like cells from each diseased tissue sample relative to stem-like cells in normal samples in each tissue plotted against the malignancy continuum. Samples are colored based on if they are from different disease stage.AAH: Atypical adenomatous hyperplasia
AIS: Adenocarcinoma in situ
IAC: Invasive lung adenocarcinoma
MIA: Minimally invasive adenocarcinoma
Oral CavityThe image shows the transcriptomic changes along malignancy continuum.log2FC in expression of this searched gene in stem-like cells from each diseased tissue sample relative to stem-like cells in normal samples in each tissue plotted against the malignancy continuum. Samples are colored based on if they are from different disease stage.EOLP: Erosive Oral lichen planus
LP: leukoplakia
NEOLP: Non-erosive oral lichen planus
OSCC: Oral squamous cell carcinoma
ProstateThe image shows the transcriptomic changes along malignancy continuum.log2FC in expression of this searched gene in stem-like cells from each diseased tissue sample relative to stem-like cells in normal samples in each tissue plotted against the malignancy continuum. Samples are colored based on if they are from different disease stage.
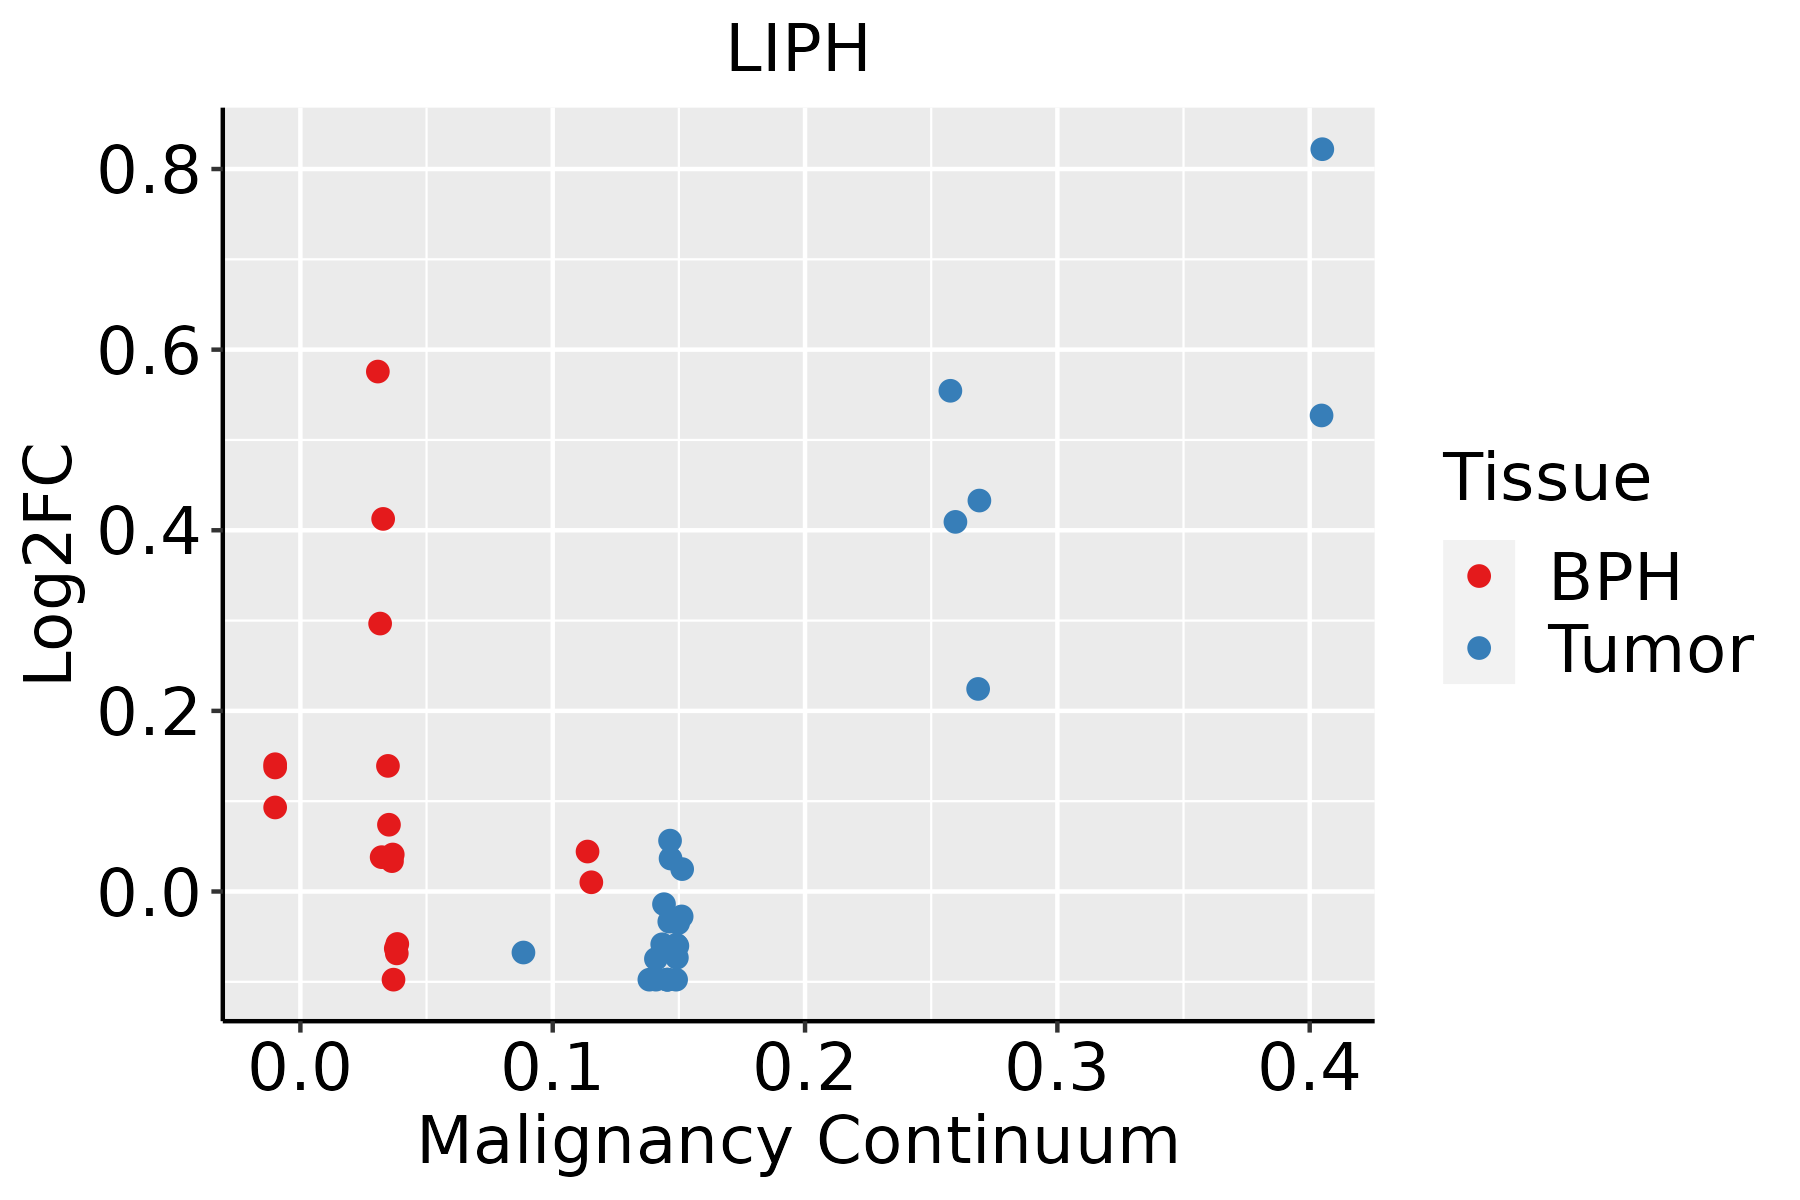
BPH: Benign Prostatic Hyperplasia
ThyroidThe image shows the transcriptomic changes along malignancy continuum.log2FC in expression of this searched gene in stem-like cells from each diseased tissue sample relative to stem-like cells in normal samples in each tissue plotted against the malignancy continuum. Samples are colored based on if they are from different disease stage.
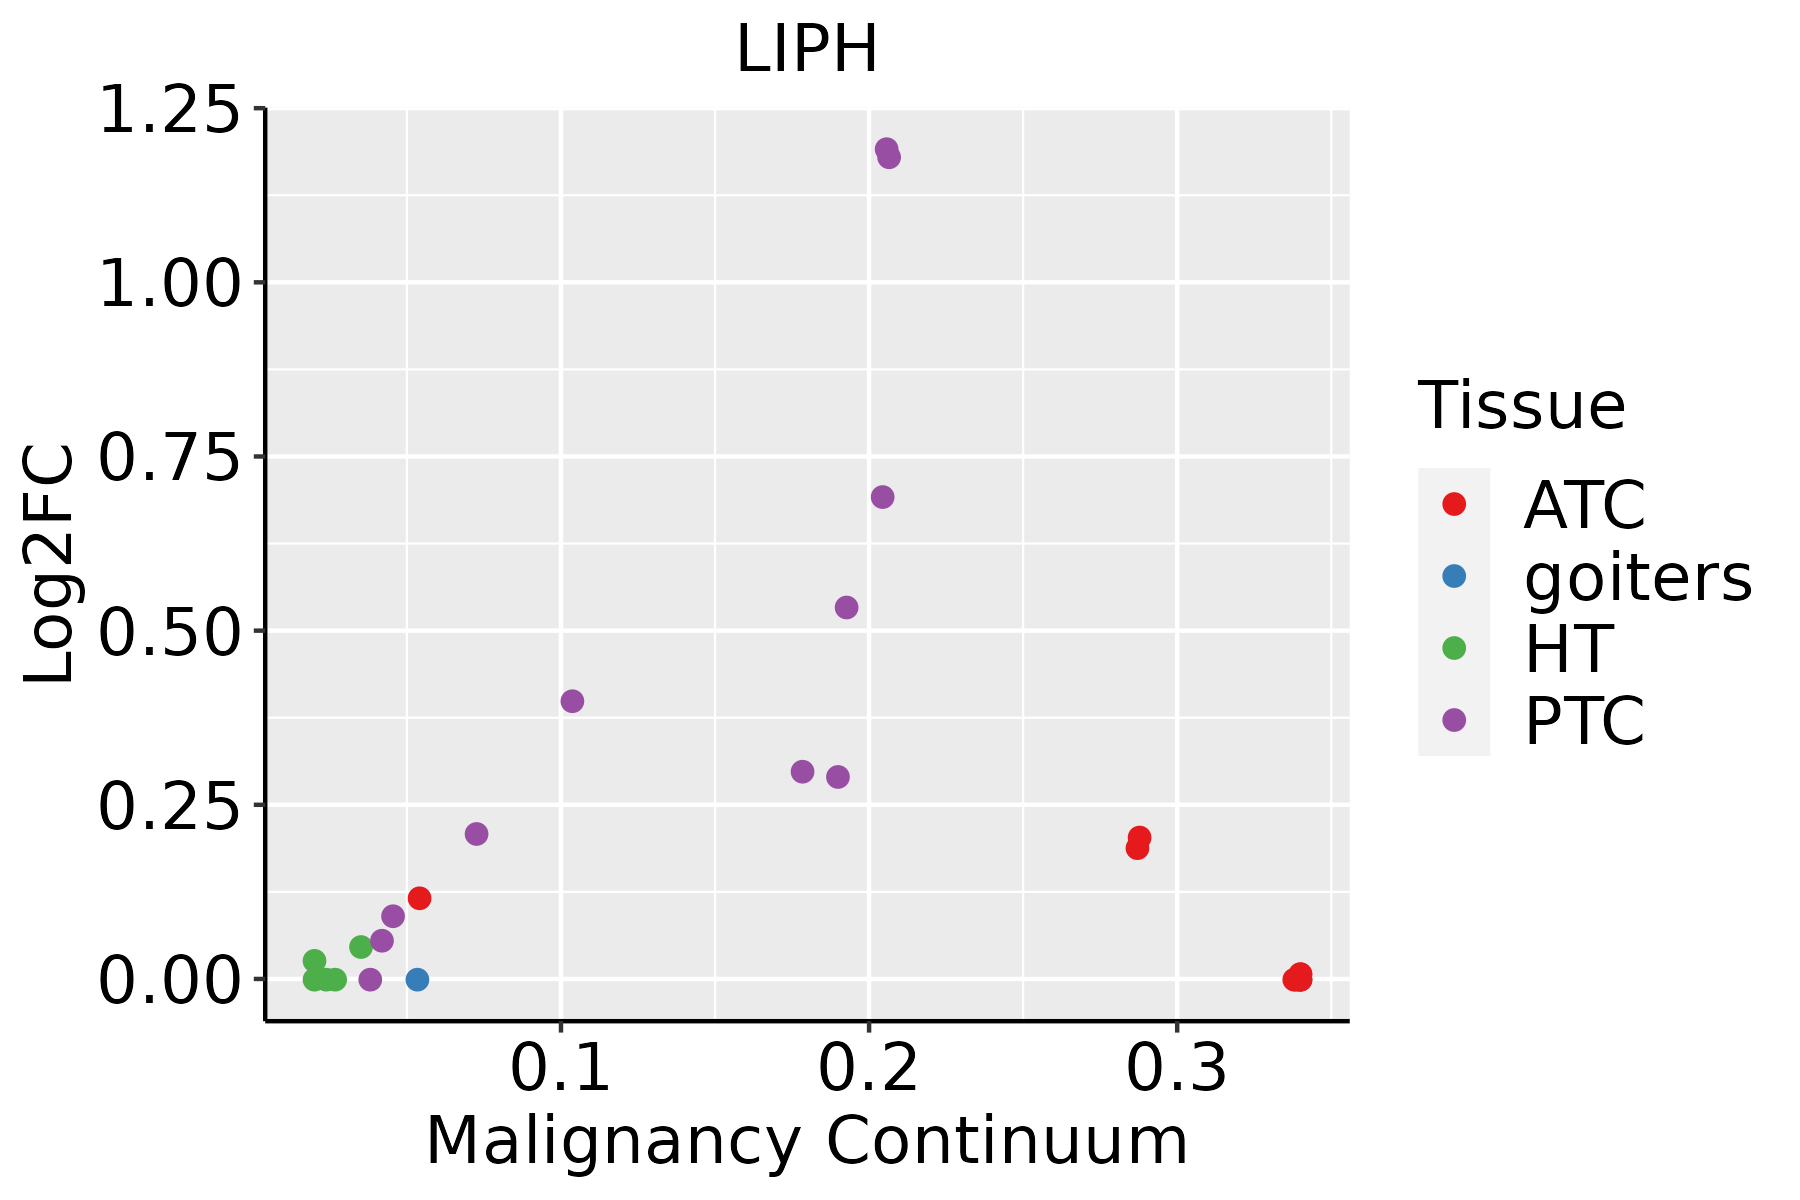
ATC: Anaplastic thyroid cancer
HT: Hashimoto's thyroiditis
PTC: Papillary thyroid cancer
∗log2FC in expression of this searched gene in stem-like cells from each diseased tissue sample relative to stem-like cells in normal samples in each tissue plotted against the malignancy continuum. Samples are colored based on if they are from different disease stage.

Top

Malignant transformation related pathway analysis

check buttonFind out the enriched GO biological processes and KEGG pathways involved in transition from healthy to precancer to cancer
check button Figure of enriched GO biological processes.
TissueDisease StageEnriched GO biological Processes
ColorectumADGO analysis - Figure of enriched GO biological processes: Top 15 enriched GO BP terms are showed in the bar plot of each disease state in each tissue. Each row represents a significant GO biological process which is colored according to the -log10(p.adjust).
ColorectumSERGO analysis - Figure of enriched GO biological processes: Top 15 enriched GO BP terms are showed in the bar plot of each disease state in each tissue. Each row represents a significant GO biological process which is colored according to the -log10(p.adjust).
ColorectumMSSGO analysis - Figure of enriched GO biological processes: Top 15 enriched GO BP terms are showed in the bar plot of each disease state in each tissue. Each row represents a significant GO biological process which is colored according to the -log10(p.adjust).
ColorectumMSI-HGO analysis - Figure of enriched GO biological processes: Top 15 enriched GO BP terms are showed in the bar plot of each disease state in each tissue. Each row represents a significant GO biological process which is colored according to the -log10(p.adjust).
ColorectumFAPGO analysis - Figure of enriched GO biological processes: Top 15 enriched GO BP terms are showed in the bar plot of each disease state in each tissue. Each row represents a significant GO biological process which is colored according to the -log10(p.adjust).
∗Top 15 enriched GO BP terms are showed in the bar plot of each disease state in each tissue. Each row represents a significant GO biological process which is colored according to the -log10(p.adjust).
Page: 1 2 3 4 5 6 7 8 9 

check button Enriched GO biological processes.
GO IDTissueDisease StageDescriptionGene RatioBg Ratiopvaluep.adjustCount
GO:0016042ColorectumADlipid catabolic process97/3918320/187234.31e-057.56e-0497
GO:0006631ColorectumADfatty acid metabolic process114/3918390/187235.58e-059.44e-04114
GO:0044242ColorectumADcellular lipid catabolic process66/3918214/187233.96e-044.50e-0366
GO:0006650ColorectumADglycerophospholipid metabolic process83/3918306/187235.40e-033.55e-0283
GO:0006644ColorectumADphospholipid metabolic process101/3918383/187235.80e-033.67e-02101
GO:0045017ColorectumADglycerolipid biosynthetic process69/3918252/187238.33e-034.88e-0269
GO:00160421ColorectumSERlipid catabolic process77/2897320/187233.52e-059.18e-0477
GO:00442421ColorectumSERcellular lipid catabolic process51/2897214/187238.60e-041.05e-0251
GO:0046486ColorectumSERglycerolipid metabolic process82/2897392/187232.26e-032.17e-0282
GO:00066441ColorectumSERphospholipid metabolic process79/2897383/187233.94e-033.24e-0279
GO:00450171ColorectumSERglycerolipid biosynthetic process55/2897252/187234.47e-033.56e-0255
GO:00066311ColorectumSERfatty acid metabolic process79/2897390/187236.34e-034.56e-0279
GO:00066501ColorectumSERglycerophospholipid metabolic process64/2897306/187236.41e-034.60e-0264
GO:00066312ColorectumMSSfatty acid metabolic process95/3467390/187232.20e-031.84e-0295
GO:0046394ColorectumMSScarboxylic acid biosynthetic process76/3467314/187236.71e-034.38e-0276
GO:00160422ColorectumMSSlipid catabolic process77/3467320/187237.43e-034.71e-0277
GO:0016053ColorectumMSSorganic acid biosynthetic process76/3467316/187237.88e-034.84e-0276
GO:00066313ColorectumFAPfatty acid metabolic process81/2622390/187231.43e-042.24e-0381
GO:00442422ColorectumFAPcellular lipid catabolic process49/2622214/187232.87e-043.77e-0349
GO:0008654ColorectumFAPphospholipid biosynthetic process54/2622253/187238.88e-049.08e-0354
Page: 1 2 3 4 5 

check button Enriched KEGG pathways.
Pathway IDTissueDisease StageDescriptionGene RatioBg Ratiopvaluep.adjustqvalueCount
Page: 1 

Top

Cell-cell communication analysis

check buttonIdentification of potential cell-cell interactions between two cell types and their ligand-receptor pairs for different disease states
LigandReceptorLRpairPathwayTissueDisease Stage
Page: 1 

Top

Single-cell gene regulatory network inference analysis

check buttonFind out the significant the regulons (TFs) and the target genes of each regulon across cell types for different disease states
TFCell TypeTissueDisease StageTarget GeneRSSRegulon Activity
∗The dot plots of a searched regulon are shown for all cell subpopulations in each disease state of each tissue based on the regulon specific score inferred using pySCENIC and by calculating the average expression.
Page: 1 

Top

Somatic mutation of malignant transformation related genes

check buttonAnnotation of somatic variants for genes involved in malignant transformation
Hugo SymbolVariant ClassVariant ClassificationdbSNP RSHGVScHGVSpHGVSp ShortSWISSPROTBIOTYPESIFTPolyPhenTumor Sample BarcodeTissueHistologySexAgeStageTherapy TypesDrugsOutcome
LIPHSNVMissense_Mutationnovelc.1208N>Ap.Gly403Aspp.G403DQ8WWY8protein_codingtolerated(0.1)possibly_damaging(0.564)TCGA-A7-A4SF-01Breastbreast invasive carcinomaFemale<65I/IIChemotherapycarboplatinCR
LIPHSNVMissense_Mutationc.932N>Gp.Pro311Argp.P311RQ8WWY8protein_codingtolerated(0.17)benign(0.208)TCGA-A8-A06U-01Breastbreast invasive carcinomaFemale>=65I/IIUnknownUnknownSD
LIPHSNVMissense_Mutationc.1093N>Gp.His365Aspp.H365DQ8WWY8protein_codingtolerated(0.09)benign(0.147)TCGA-GM-A2DO-01Breastbreast invasive carcinomaFemale<65I/IIHormone TherapytamoxiphenCR
LIPHSNVMissense_Mutationnovelc.1142N>Tp.Arg381Ilep.R381IQ8WWY8protein_codingdeleterious(0.04)possibly_damaging(0.65)TCGA-S3-AA15-01Breastbreast invasive carcinomaFemale<65I/IIChemotherapyadriamycinCR
LIPHSNVMissense_Mutationnovelc.912C>Gp.Asp304Glup.D304EQ8WWY8protein_codingtolerated(0.17)benign(0.03)TCGA-2W-A8YY-01Cervixcervical & endocervical cancerFemale<65I/IIChemotherapycisplatinCR
LIPHSNVMissense_Mutationnovelc.481G>Ap.Gly161Argp.G161RQ8WWY8protein_codingdeleterious(0)probably_damaging(1)TCGA-2W-A8YY-01Cervixcervical & endocervical cancerFemale<65I/IIChemotherapycisplatinCR
LIPHSNVMissense_Mutationc.841N>Cp.Cys281Argp.C281RQ8WWY8protein_codingdeleterious(0)probably_damaging(0.999)TCGA-EK-A2RC-01Cervixcervical & endocervical cancerFemale<65I/IIUnknownUnknownSD
LIPHSNVMissense_Mutationc.1049N>Cp.Lys350Thrp.K350TQ8WWY8protein_codingdeleterious(0.03)possibly_damaging(0.855)TCGA-FU-A3HZ-01Cervixcervical & endocervical cancerFemale<65I/IIChemotherapycisplatinCR
LIPHSNVMissense_Mutationc.362N>Gp.Ser121Cysp.S121CQ8WWY8protein_codingdeleterious(0.01)possibly_damaging(0.852)TCGA-FU-A5XV-01Cervixcervical & endocervical cancerFemale<65III/IVUnknownUnknownSD
LIPHSNVMissense_Mutationnovelc.248N>Gp.Ser83Cysp.S83CQ8WWY8protein_codingdeleterious(0)probably_damaging(0.996)TCGA-VS-A8EB-01Cervixcervical & endocervical cancerFemale<65III/IVUnknownUnknownPD
Page: 1 2 3 4 5 6 

Top

Related drugs of malignant transformation related genes

check buttonIdentification of chemicals and drugs interact with genes involved in malignant transfromation
(DGIdb 4.0)
Entrez IDSymbolCategoryInteraction TypesDrug Claim NameDrug NamePMIDs
Page: 1