
|
|||||
|
 | |
| |
| |
| |
| |
| |
|
Gene: LIPF |
Gene summary for LIPF |
| Gene information | Species | Human | Gene symbol | LIPF | Gene ID | 8513 |
| Gene name | lipase F, gastric type | |
| Gene Alias | GL | |
| Cytomap | 10q23.31 | |
| Gene Type | protein-coding | GO ID | GO:0006082 | UniProtAcc | P07098 |
Top |
Malignant transformation analysis |
| Identification of the aberrant gene expression in precancerous and cancerous lesions by comparing the gene expression of stem-like cells in diseased tissues with normal stem cells |
| Entrez ID | Symbol | Replicates | Species | Organ | Tissue | Adj P-value | Log2FC | Malignancy |
| 8513 | LIPF | Pat01-B | Human | Stomach | GC | 7.75e-21 | -1.13e+00 | 0.5754 |
| 8513 | LIPF | Pat02-B | Human | Stomach | GC | 1.88e-25 | -1.13e+00 | 0.0368 |
| 8513 | LIPF | Pat03-B | Human | Stomach | GC | 2.23e-09 | -8.81e-01 | 0.3693 |
| 8513 | LIPF | Pat04-B | Human | Stomach | GC | 3.23e-07 | -1.11e+00 | -0.1483 |
| 8513 | LIPF | Pat05-B | Human | Stomach | GC | 1.58e-21 | -7.48e-01 | -0.0353 |
| 8513 | LIPF | Pat06-B | Human | Stomach | GC | 5.89e-51 | -1.50e-01 | -0.1961 |
| 8513 | LIPF | Pat08-B | Human | Stomach | GC | 1.19e-10 | -8.17e-01 | 0.0182 |
| 8513 | LIPF | Pat09-B | Human | Stomach | GC | 1.23e-13 | -8.13e-01 | -0.0359 |
| 8513 | LIPF | Pat11-B | Human | Stomach | GC | 2.40e-14 | -6.02e-01 | -0.182 |
| 8513 | LIPF | Pat12-B | Human | Stomach | GC | 1.10e-14 | -1.00e+00 | 0.0325 |
| 8513 | LIPF | Pat13-B | Human | Stomach | GC | 5.57e-08 | -1.18e+00 | 0.0555 |
| 8513 | LIPF | Pat15-B | Human | Stomach | GC | 1.51e-53 | 1.99e-01 | -0.0778 |
| 8513 | LIPF | Pat16-B | Human | Stomach | GC | 2.64e-21 | -1.14e+00 | 0.1918 |
| 8513 | LIPF | Pat17-B | Human | Stomach | GC | 4.68e-21 | -1.15e+00 | 0.3109 |
| 8513 | LIPF | Pat18-B | Human | Stomach | GC | 2.77e-17 | -9.41e-01 | -0.0432 |
| 8513 | LIPF | Pat19-B | Human | Stomach | GC | 3.69e-24 | -8.25e-01 | 0.0826 |
| 8513 | LIPF | Pat22-B | Human | Stomach | GC | 1.23e-15 | -1.15e+00 | -0.1042 |
| 8513 | LIPF | Pat24-B | Human | Stomach | GC | 4.50e-60 | 2.76e-01 | -0.1184 |
| 8513 | LIPF | Pat25-A | Human | Stomach | CAG with IM | 1.01e-28 | -7.36e-01 | -0.1648 |
| 8513 | LIPF | Pat26-A | Human | Stomach | CSG | 7.93e-25 | -1.13e+00 | -0.2402 |
| Page: 1 2 |
| Tissue | Expression Dynamics | Abbreviation |
| GC | 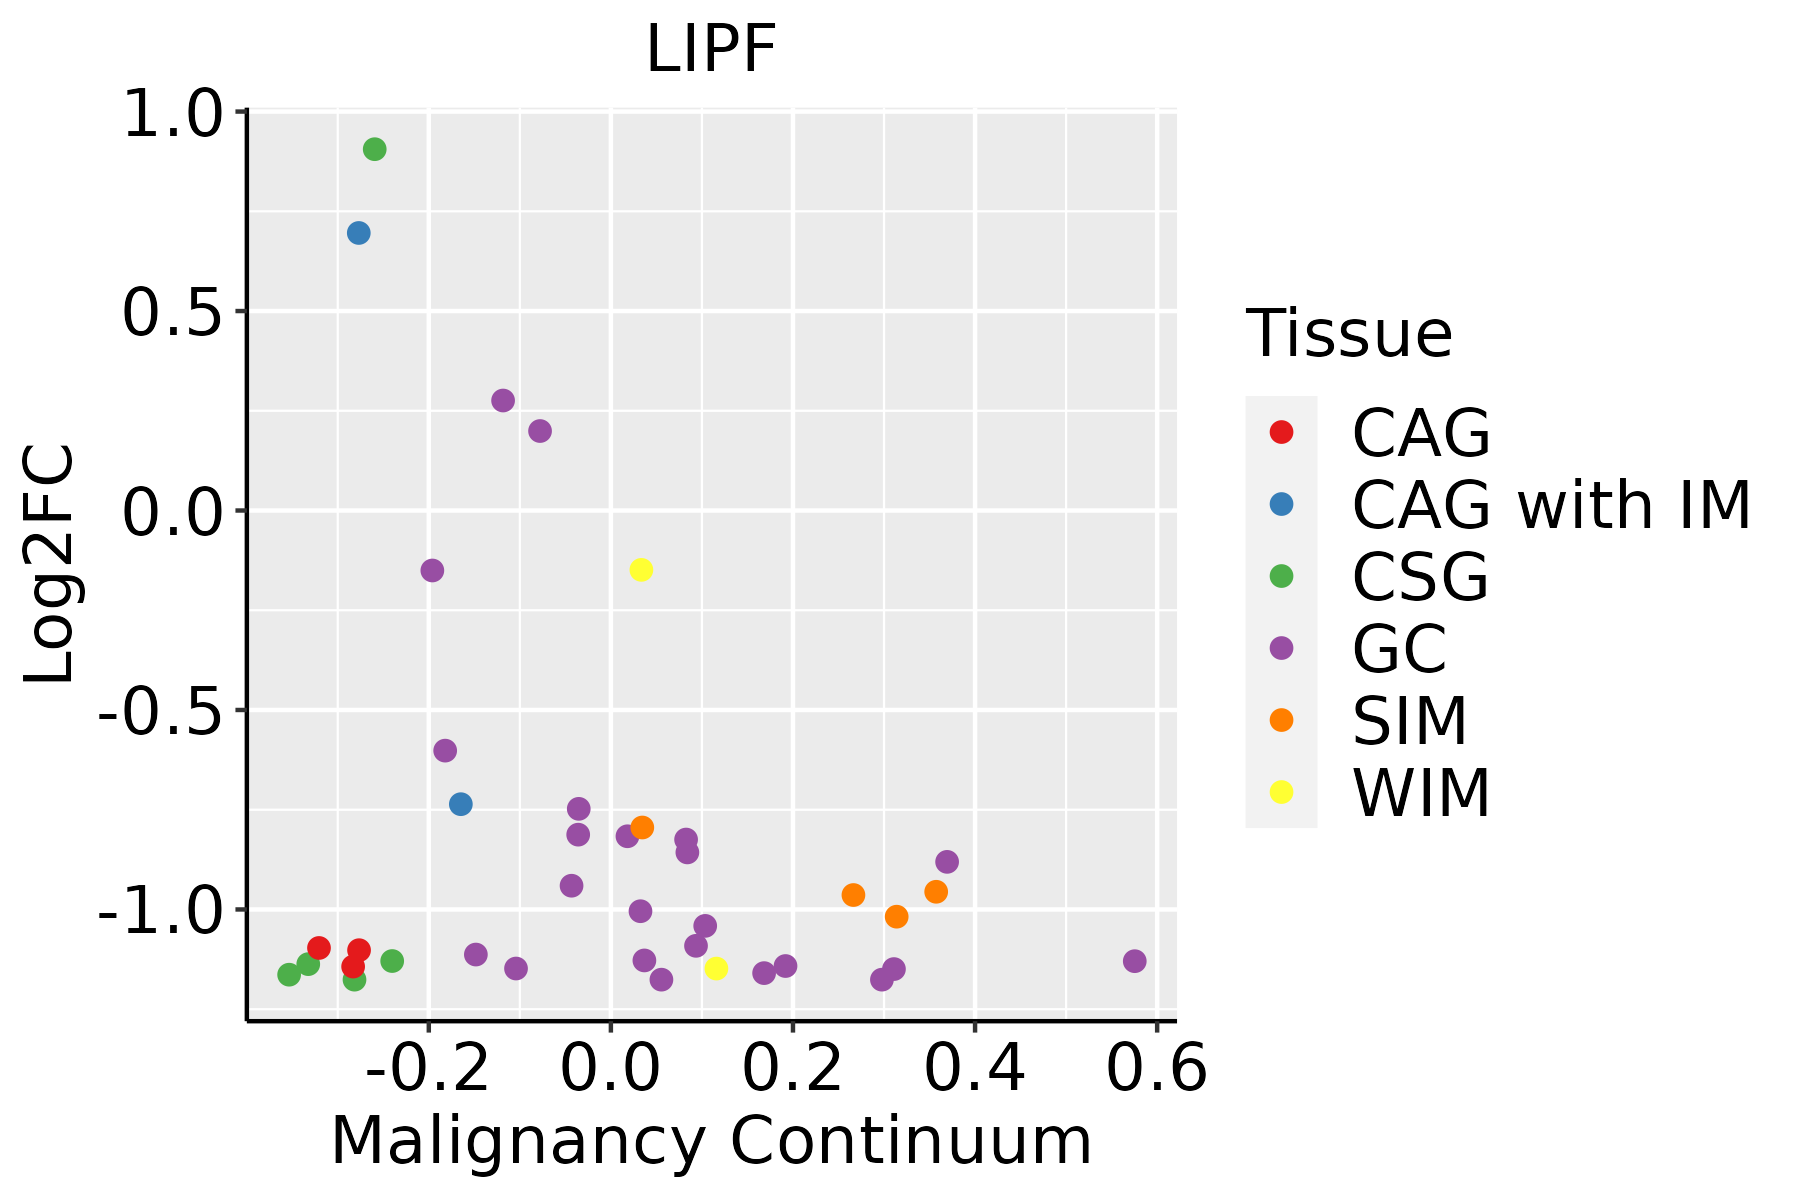 | CAG: Chronic atrophic gastritis |
| CAG with IM: Chronic atrophic gastritis with intestinal metaplasia | ||
| CSG: Chronic superficial gastritis | ||
| GC: Gastric cancer | ||
| SIM: Severe intestinal metaplasia | ||
| WIM: Wild intestinal metaplasia |
| ∗log2FC in expression of this searched gene in stem-like cells from each diseased tissue sample relative to stem-like cells in normal samples in each tissue plotted against the malignancy continuum. Samples are colored based on if they are from different disease stage. |
Top |
Malignant transformation related pathway analysis |
| Find out the enriched GO biological processes and KEGG pathways involved in transition from healthy to precancer to cancer |
| Tissue | Disease Stage | Enriched GO biological Processes |
| Colorectum | AD |  |
| Colorectum | SER |  |
| Colorectum | MSS |  |
| Colorectum | MSI-H |  |
| Colorectum | FAP |  |
| ∗Top 15 enriched GO BP terms are showed in the bar plot of each disease state in each tissue. Each row represents a significant GO biological process which is colored according to the -log10(p.adjust). |
| Page: 1 2 3 4 5 6 7 8 9 |
| GO ID | Tissue | Disease Stage | Description | Gene Ratio | Bg Ratio | pvalue | p.adjust | Count |
| GO:0006641 | Stomach | GC | triglyceride metabolic process | 23/1159 | 100/18723 | 3.27e-08 | 2.44e-06 | 23 |
| GO:0006639 | Stomach | GC | acylglycerol metabolic process | 24/1159 | 128/18723 | 9.59e-07 | 4.53e-05 | 24 |
| GO:0006638 | Stomach | GC | neutral lipid metabolic process | 24/1159 | 129/18723 | 1.11e-06 | 5.20e-05 | 24 |
| GO:00160425 | Stomach | GC | lipid catabolic process | 41/1159 | 320/18723 | 7.84e-06 | 2.80e-04 | 41 |
| GO:00464862 | Stomach | GC | glycerolipid metabolic process | 38/1159 | 392/18723 | 4.15e-03 | 3.47e-02 | 38 |
| GO:00066411 | Stomach | SIM | triglyceride metabolic process | 16/708 | 100/18723 | 1.03e-06 | 5.84e-05 | 16 |
| GO:00066391 | Stomach | SIM | acylglycerol metabolic process | 16/708 | 128/18723 | 2.67e-05 | 8.13e-04 | 16 |
| GO:00066381 | Stomach | SIM | neutral lipid metabolic process | 16/708 | 129/18723 | 2.95e-05 | 8.85e-04 | 16 |
| GO:001604211 | Stomach | SIM | lipid catabolic process | 25/708 | 320/18723 | 5.21e-04 | 8.27e-03 | 25 |
| Page: 1 |
| Pathway ID | Tissue | Disease Stage | Description | Gene Ratio | Bg Ratio | pvalue | p.adjust | qvalue | Count |
| hsa04975 | Stomach | GC | Fat digestion and absorption | 14/708 | 43/8465 | 5.71e-06 | 8.30e-05 | 5.84e-05 | 14 |
| hsa005614 | Stomach | GC | Glycerolipid metabolism | 12/708 | 63/8465 | 5.36e-03 | 3.01e-02 | 2.12e-02 | 12 |
| hsa049751 | Stomach | GC | Fat digestion and absorption | 14/708 | 43/8465 | 5.71e-06 | 8.30e-05 | 5.84e-05 | 14 |
| hsa0056111 | Stomach | GC | Glycerolipid metabolism | 12/708 | 63/8465 | 5.36e-03 | 3.01e-02 | 2.12e-02 | 12 |
| hsa049752 | Stomach | SIM | Fat digestion and absorption | 12/465 | 43/8465 | 2.11e-06 | 3.05e-05 | 2.45e-05 | 12 |
| hsa0056121 | Stomach | SIM | Glycerolipid metabolism | 9/465 | 63/8465 | 7.07e-03 | 4.30e-02 | 3.45e-02 | 9 |
| hsa049753 | Stomach | SIM | Fat digestion and absorption | 12/465 | 43/8465 | 2.11e-06 | 3.05e-05 | 2.45e-05 | 12 |
| hsa0056131 | Stomach | SIM | Glycerolipid metabolism | 9/465 | 63/8465 | 7.07e-03 | 4.30e-02 | 3.45e-02 | 9 |
| Page: 1 |
Top |
Cell-cell communication analysis |
| Identification of potential cell-cell interactions between two cell types and their ligand-receptor pairs for different disease states |
| Ligand | Receptor | LRpair | Pathway | Tissue | Disease Stage |
| Page: 1 |
Top |
Single-cell gene regulatory network inference analysis |
| Find out the significant the regulons (TFs) and the target genes of each regulon across cell types for different disease states |
| TF | Cell Type | Tissue | Disease Stage | Target Gene | RSS | Regulon Activity |
| ∗The dot plots of a searched regulon are shown for all cell subpopulations in each disease state of each tissue based on the regulon specific score inferred using pySCENIC and by calculating the average expression. |
| Page: 1 |
Top |
Somatic mutation of malignant transformation related genes |
| Annotation of somatic variants for genes involved in malignant transformation |
| Hugo Symbol | Variant Class | Variant Classification | dbSNP RS | HGVSc | HGVSp | HGVSp Short | SWISSPROT | BIOTYPE | SIFT | PolyPhen | Tumor Sample Barcode | Tissue | Histology | Sex | Age | Stage | Therapy Types | Drugs | Outcome |
| LIPF | SNV | Missense_Mutation | c.539N>T | p.Gly180Val | p.G180V | P07098 | protein_coding | deleterious(0.01) | probably_damaging(1) | TCGA-A2-A25A-01 | Breast | breast invasive carcinoma | Female | <65 | I/II | Unspecific | Cytoxan | SD | |
| LIPF | SNV | Missense_Mutation | c.227A>G | p.Tyr76Cys | p.Y76C | P07098 | protein_coding | deleterious(0.04) | benign(0.027) | TCGA-D8-A1Y3-01 | Breast | breast invasive carcinoma | Female | <65 | III/IV | Chemotherapy | doxorubicine+cyclophosphamide | SD | |
| LIPF | deletion | Frame_Shift_Del | novel | c.315delC | p.Asn106ThrfsTer63 | p.N106Tfs*63 | P07098 | protein_coding | TCGA-EW-A2FV-01 | Breast | breast invasive carcinoma | Female | <65 | III/IV | Chemotherapy | docetaxel | SD | ||
| LIPF | SNV | Missense_Mutation | c.602N>T | p.Arg201Ile | p.R201I | P07098 | protein_coding | deleterious(0) | probably_damaging(0.922) | TCGA-AA-A010-01 | Colorectum | colon adenocarcinoma | Female | <65 | I/II | Chemotherapy | folinic | CR | |
| LIPF | SNV | Missense_Mutation | c.203N>G | p.Ile68Ser | p.I68S | P07098 | protein_coding | deleterious(0) | probably_damaging(0.992) | TCGA-AG-3892-01 | Colorectum | rectum adenocarcinoma | Female | <65 | I/II | Unknown | Unknown | SD | |
| LIPF | SNV | Missense_Mutation | novel | c.356N>T | p.Ala119Val | p.A119V | P07098 | protein_coding | deleterious(0.01) | benign(0.319) | TCGA-AG-A002-01 | Colorectum | rectum adenocarcinoma | Male | <65 | I/II | Unknown | Unknown | SD |
| LIPF | SNV | Missense_Mutation | novel | c.566T>G | p.Phe189Cys | p.F189C | P07098 | protein_coding | deleterious(0) | probably_damaging(0.996) | TCGA-F5-6814-01 | Colorectum | rectum adenocarcinoma | Male | <65 | I/II | Unknown | Unknown | SD |
| LIPF | SNV | Missense_Mutation | c.1088N>C | p.Leu363Pro | p.L363P | P07098 | protein_coding | tolerated(0.34) | benign(0.195) | TCGA-A5-A0GI-01 | Endometrium | uterine corpus endometrioid carcinoma | Female | <65 | I/II | Unknown | Unknown | SD | |
| LIPF | SNV | Missense_Mutation | novel | c.934N>G | p.Lys312Glu | p.K312E | P07098 | protein_coding | tolerated(0.9) | benign(0.001) | TCGA-A5-A2K5-01 | Endometrium | uterine corpus endometrioid carcinoma | Female | >=65 | I/II | Unknown | Unknown | SD |
| LIPF | SNV | Missense_Mutation | rs755027503 | c.1025N>G | p.Asn342Ser | p.N342S | P07098 | protein_coding | tolerated(0.52) | benign(0) | TCGA-AJ-A3EL-01 | Endometrium | uterine corpus endometrioid carcinoma | Female | <65 | I/II | Unknown | Unknown | SD |
| Page: 1 2 3 4 5 6 |
Top |
Related drugs of malignant transformation related genes |
| Identification of chemicals and drugs interact with genes involved in malignant transfromation |
| (DGIdb 4.0) |
| Entrez ID | Symbol | Category | Interaction Types | Drug Claim Name | Drug Name | PMIDs |
| 8513 | LIPF | ENZYME, DRUGGABLE GENOME | GT 389-255 | |||
| 8513 | LIPF | ENZYME, DRUGGABLE GENOME | Cetilistat | CETILISTAT | ||
| 8513 | LIPF | ENZYME, DRUGGABLE GENOME | inhibitor | CHEMBL175247 | ORLISTAT | |
| 8513 | LIPF | ENZYME, DRUGGABLE GENOME | ORLISTAT | ORLISTAT |
| Page: 1 |

Copyright 2023-Present -The University of Texas Health Science Center at Houston |