
|
|||||
|
 | |
| |
| |
| |
| |
| |
|
Gene: LIPA |
Gene summary for LIPA |
| Gene information | Species | Human | Gene symbol | LIPA | Gene ID | 3988 |
| Gene name | lipase A, lysosomal acid type | |
| Gene Alias | CESD | |
| Cytomap | 10q23.31 | |
| Gene Type | protein-coding | GO ID | GO:0000902 | UniProtAcc | P38571 |
Top |
Malignant transformation analysis |
| Identification of the aberrant gene expression in precancerous and cancerous lesions by comparing the gene expression of stem-like cells in diseased tissues with normal stem cells |
| Entrez ID | Symbol | Replicates | Species | Organ | Tissue | Adj P-value | Log2FC | Malignancy |
| 3988 | LIPA | LZE4T | Human | Esophagus | ESCC | 2.89e-13 | 3.17e-01 | 0.0811 |
| 3988 | LIPA | LZE8T | Human | Esophagus | ESCC | 1.59e-03 | 1.26e-02 | 0.067 |
| 3988 | LIPA | LZE20T | Human | Esophagus | ESCC | 2.69e-02 | 8.70e-02 | 0.0662 |
| 3988 | LIPA | LZE24T | Human | Esophagus | ESCC | 3.91e-22 | 6.83e-01 | 0.0596 |
| 3988 | LIPA | LZE6T | Human | Esophagus | ESCC | 1.79e-04 | 7.22e-02 | 0.0845 |
| 3988 | LIPA | P2T-E | Human | Esophagus | ESCC | 7.00e-24 | 4.05e-01 | 0.1177 |
| 3988 | LIPA | P4T-E | Human | Esophagus | ESCC | 9.45e-19 | 4.18e-01 | 0.1323 |
| 3988 | LIPA | P5T-E | Human | Esophagus | ESCC | 4.23e-04 | 1.14e-01 | 0.1327 |
| 3988 | LIPA | P8T-E | Human | Esophagus | ESCC | 1.73e-20 | 3.80e-01 | 0.0889 |
| 3988 | LIPA | P9T-E | Human | Esophagus | ESCC | 2.17e-11 | 1.15e-01 | 0.1131 |
| 3988 | LIPA | P10T-E | Human | Esophagus | ESCC | 2.62e-15 | 1.63e-01 | 0.116 |
| 3988 | LIPA | P11T-E | Human | Esophagus | ESCC | 2.34e-18 | 7.52e-01 | 0.1426 |
| 3988 | LIPA | P12T-E | Human | Esophagus | ESCC | 1.05e-12 | 2.90e-01 | 0.1122 |
| 3988 | LIPA | P15T-E | Human | Esophagus | ESCC | 4.95e-22 | 4.08e-01 | 0.1149 |
| 3988 | LIPA | P16T-E | Human | Esophagus | ESCC | 1.98e-15 | 3.28e-01 | 0.1153 |
| 3988 | LIPA | P17T-E | Human | Esophagus | ESCC | 1.20e-06 | 3.24e-01 | 0.1278 |
| 3988 | LIPA | P19T-E | Human | Esophagus | ESCC | 1.07e-07 | 5.66e-01 | 0.1662 |
| 3988 | LIPA | P20T-E | Human | Esophagus | ESCC | 1.56e-22 | 3.91e-01 | 0.1124 |
| 3988 | LIPA | P21T-E | Human | Esophagus | ESCC | 4.18e-18 | 3.10e-01 | 0.1617 |
| 3988 | LIPA | P22T-E | Human | Esophagus | ESCC | 2.14e-07 | 8.99e-02 | 0.1236 |
| Page: 1 2 3 4 5 |
| Tissue | Expression Dynamics | Abbreviation |
| Esophagus | 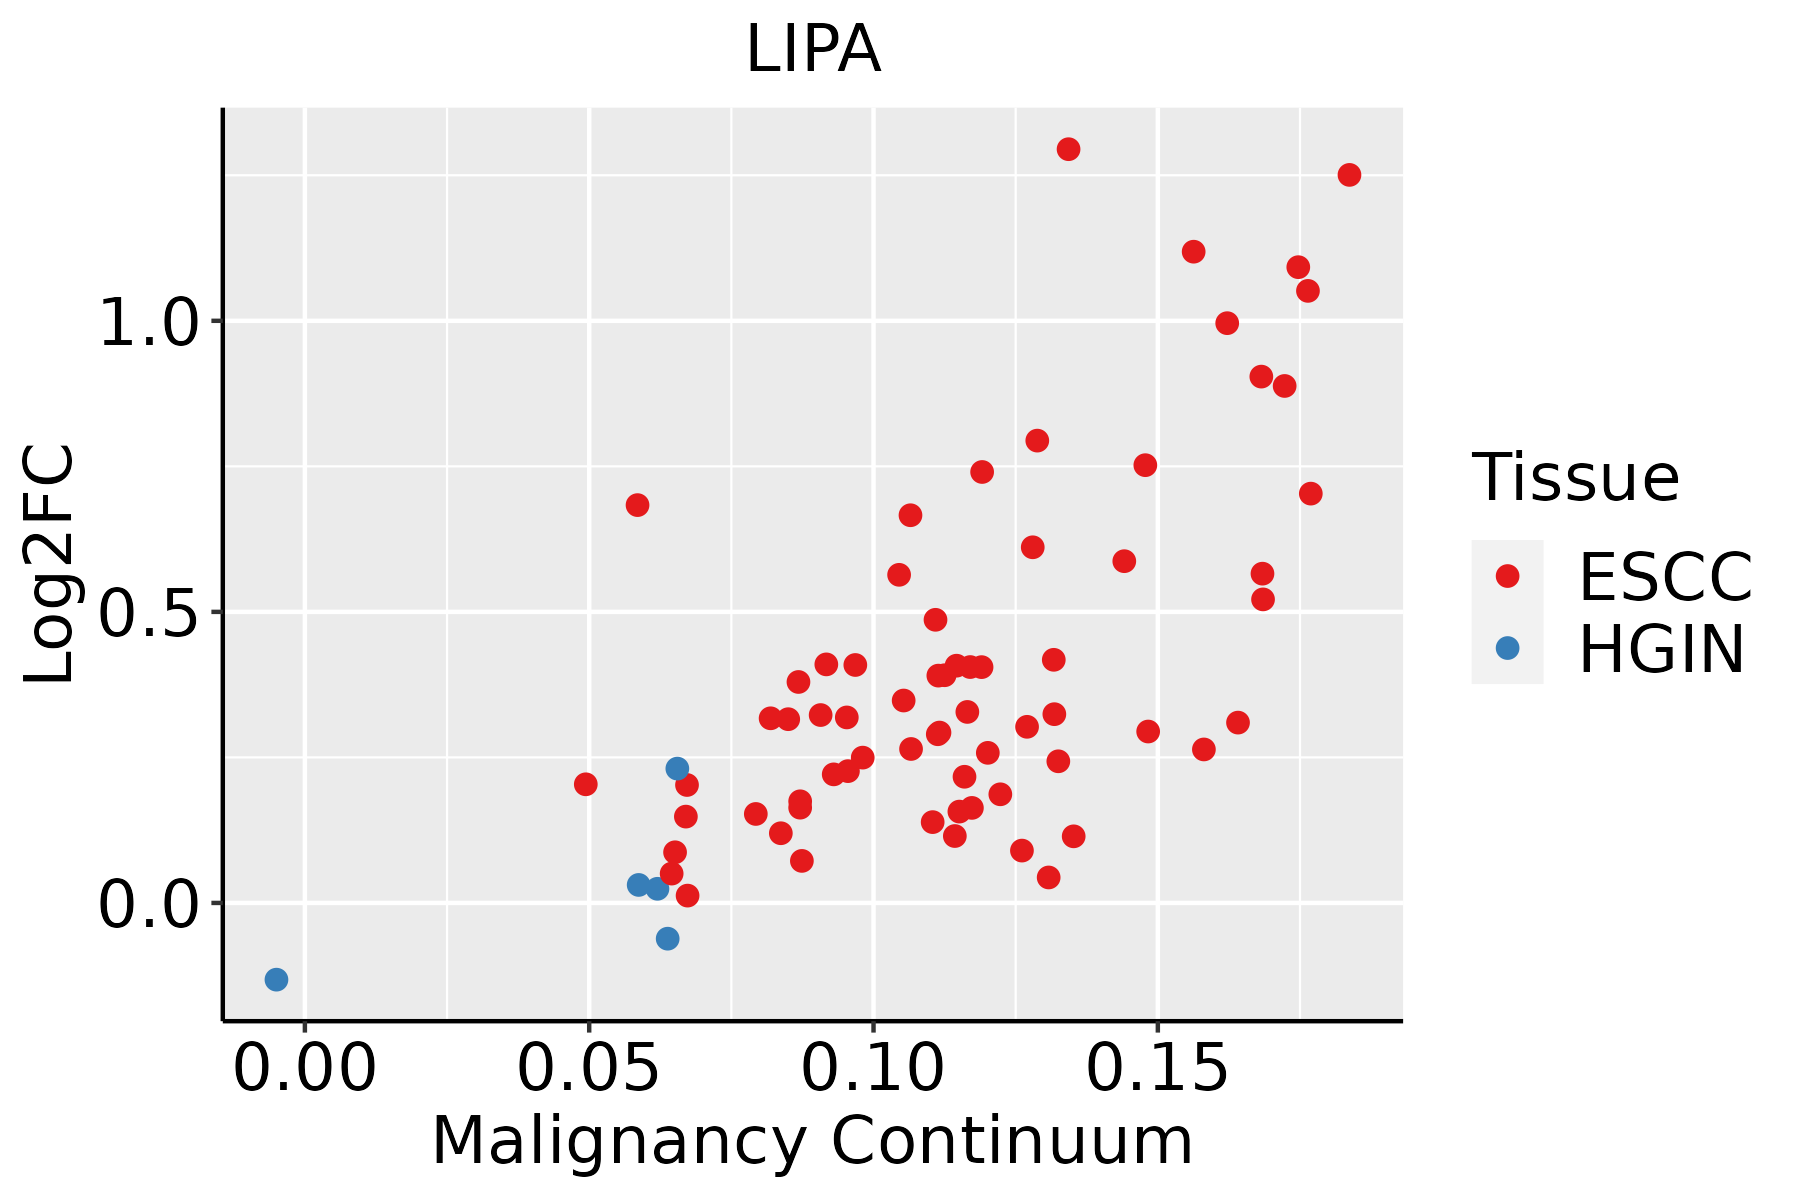 | ESCC: Esophageal squamous cell carcinoma |
| HGIN: High-grade intraepithelial neoplasias | ||
| LGIN: Low-grade intraepithelial neoplasias | ||
| Liver |  | HCC: Hepatocellular carcinoma |
| NAFLD: Non-alcoholic fatty liver disease | ||
| Oral Cavity |  | EOLP: Erosive Oral lichen planus |
| LP: leukoplakia | ||
| NEOLP: Non-erosive oral lichen planus | ||
| OSCC: Oral squamous cell carcinoma | ||
| Skin |  | AK: Actinic keratosis |
| cSCC: Cutaneous squamous cell carcinoma | ||
| SCCIS:squamous cell carcinoma in situ |
| ∗log2FC in expression of this searched gene in stem-like cells from each diseased tissue sample relative to stem-like cells in normal samples in each tissue plotted against the malignancy continuum. Samples are colored based on if they are from different disease stage. |
Top |
Malignant transformation related pathway analysis |
| Find out the enriched GO biological processes and KEGG pathways involved in transition from healthy to precancer to cancer |
| Tissue | Disease Stage | Enriched GO biological Processes |
| Colorectum | AD |  |
| Colorectum | SER |  |
| Colorectum | MSS |  |
| Colorectum | MSI-H |  |
| Colorectum | FAP |  |
| ∗Top 15 enriched GO BP terms are showed in the bar plot of each disease state in each tissue. Each row represents a significant GO biological process which is colored according to the -log10(p.adjust). |
| Page: 1 2 3 4 5 6 7 8 9 |
| GO ID | Tissue | Disease Stage | Description | Gene Ratio | Bg Ratio | pvalue | p.adjust | Count |
| GO:0048872111 | Esophagus | ESCC | homeostasis of number of cells | 163/8552 | 272/18723 | 1.40e-06 | 1.69e-05 | 163 |
| GO:00303239 | Esophagus | ESCC | respiratory tube development | 112/8552 | 181/18723 | 7.82e-06 | 7.69e-05 | 112 |
| GO:00605417 | Esophagus | ESCC | respiratory system development | 123/8552 | 203/18723 | 1.26e-05 | 1.15e-04 | 123 |
| GO:00303249 | Esophagus | ESCC | lung development | 109/8552 | 177/18723 | 1.40e-05 | 1.27e-04 | 109 |
| GO:00161254 | Esophagus | ESCC | sterol metabolic process | 86/8552 | 152/18723 | 4.37e-03 | 1.73e-02 | 86 |
| GO:00160427 | Esophagus | ESCC | lipid catabolic process | 168/8552 | 320/18723 | 7.97e-03 | 2.84e-02 | 168 |
| GO:000820211 | Liver | Cirrhotic | steroid metabolic process | 143/4634 | 319/18723 | 2.79e-15 | 3.18e-13 | 143 |
| GO:00161251 | Liver | Cirrhotic | sterol metabolic process | 75/4634 | 152/18723 | 4.54e-11 | 2.61e-09 | 75 |
| GO:001604212 | Liver | Cirrhotic | lipid catabolic process | 112/4634 | 320/18723 | 2.31e-05 | 3.03e-04 | 112 |
| GO:00303242 | Liver | Cirrhotic | lung development | 65/4634 | 177/18723 | 2.49e-04 | 2.25e-03 | 65 |
| GO:00303232 | Liver | Cirrhotic | respiratory tube development | 66/4634 | 181/18723 | 2.82e-04 | 2.49e-03 | 66 |
| GO:004887212 | Liver | Cirrhotic | homeostasis of number of cells | 89/4634 | 272/18723 | 1.76e-03 | 1.12e-02 | 89 |
| GO:00487711 | Liver | Cirrhotic | tissue remodeling | 60/4634 | 175/18723 | 2.86e-03 | 1.65e-02 | 60 |
| GO:00605411 | Liver | Cirrhotic | respiratory system development | 67/4634 | 203/18723 | 4.81e-03 | 2.52e-02 | 67 |
| GO:00082022 | Liver | HCC | steroid metabolic process | 188/7958 | 319/18723 | 1.96e-09 | 5.63e-08 | 188 |
| GO:00161252 | Liver | HCC | sterol metabolic process | 101/7958 | 152/18723 | 1.99e-09 | 5.63e-08 | 101 |
| GO:001604221 | Liver | HCC | lipid catabolic process | 175/7958 | 320/18723 | 6.50e-06 | 7.88e-05 | 175 |
| GO:004887222 | Liver | HCC | homeostasis of number of cells | 147/7958 | 272/18723 | 7.48e-05 | 6.70e-04 | 147 |
| GO:003032311 | Liver | HCC | respiratory tube development | 95/7958 | 181/18723 | 4.15e-03 | 1.81e-02 | 95 |
| GO:003032411 | Liver | HCC | lung development | 91/7958 | 177/18723 | 1.01e-02 | 3.80e-02 | 91 |
| Page: 1 2 |
| Pathway ID | Tissue | Disease Stage | Description | Gene Ratio | Bg Ratio | pvalue | p.adjust | qvalue | Count |
| hsa0414222 | Esophagus | ESCC | Lysosome | 102/4205 | 132/8465 | 5.11e-11 | 7.13e-10 | 3.65e-10 | 102 |
| hsa001005 | Esophagus | ESCC | Steroid biosynthesis | 18/4205 | 20/8465 | 1.78e-04 | 6.79e-04 | 3.48e-04 | 18 |
| hsa0414232 | Esophagus | ESCC | Lysosome | 102/4205 | 132/8465 | 5.11e-11 | 7.13e-10 | 3.65e-10 | 102 |
| hsa0010012 | Esophagus | ESCC | Steroid biosynthesis | 18/4205 | 20/8465 | 1.78e-04 | 6.79e-04 | 3.48e-04 | 18 |
| hsa041424 | Liver | Cirrhotic | Lysosome | 68/2530 | 132/8465 | 1.34e-07 | 1.97e-06 | 1.21e-06 | 68 |
| hsa049792 | Liver | Cirrhotic | Cholesterol metabolism | 30/2530 | 51/8465 | 1.59e-05 | 1.39e-04 | 8.60e-05 | 30 |
| hsa00100 | Liver | Cirrhotic | Steroid biosynthesis | 12/2530 | 20/8465 | 4.92e-03 | 1.76e-02 | 1.09e-02 | 12 |
| hsa0414211 | Liver | Cirrhotic | Lysosome | 68/2530 | 132/8465 | 1.34e-07 | 1.97e-06 | 1.21e-06 | 68 |
| hsa049793 | Liver | Cirrhotic | Cholesterol metabolism | 30/2530 | 51/8465 | 1.59e-05 | 1.39e-04 | 8.60e-05 | 30 |
| hsa001001 | Liver | Cirrhotic | Steroid biosynthesis | 12/2530 | 20/8465 | 4.92e-03 | 1.76e-02 | 1.09e-02 | 12 |
| hsa041422 | Liver | HCC | Lysosome | 100/4020 | 132/8465 | 2.32e-11 | 4.31e-10 | 2.40e-10 | 100 |
| hsa049794 | Liver | HCC | Cholesterol metabolism | 41/4020 | 51/8465 | 1.33e-06 | 1.35e-05 | 7.49e-06 | 41 |
| hsa001002 | Liver | HCC | Steroid biosynthesis | 15/4020 | 20/8465 | 1.17e-02 | 2.97e-02 | 1.65e-02 | 15 |
| hsa041423 | Liver | HCC | Lysosome | 100/4020 | 132/8465 | 2.32e-11 | 4.31e-10 | 2.40e-10 | 100 |
| hsa049795 | Liver | HCC | Cholesterol metabolism | 41/4020 | 51/8465 | 1.33e-06 | 1.35e-05 | 7.49e-06 | 41 |
| hsa001003 | Liver | HCC | Steroid biosynthesis | 15/4020 | 20/8465 | 1.17e-02 | 2.97e-02 | 1.65e-02 | 15 |
| hsa041425 | Oral cavity | OSCC | Lysosome | 87/3704 | 132/8465 | 1.97e-07 | 1.35e-06 | 6.86e-07 | 87 |
| hsa001004 | Oral cavity | OSCC | Steroid biosynthesis | 15/3704 | 20/8465 | 4.62e-03 | 1.13e-02 | 5.75e-03 | 15 |
| hsa0414212 | Oral cavity | OSCC | Lysosome | 87/3704 | 132/8465 | 1.97e-07 | 1.35e-06 | 6.86e-07 | 87 |
| hsa0010011 | Oral cavity | OSCC | Steroid biosynthesis | 15/3704 | 20/8465 | 4.62e-03 | 1.13e-02 | 5.75e-03 | 15 |
| Page: 1 2 |
Top |
Cell-cell communication analysis |
| Identification of potential cell-cell interactions between two cell types and their ligand-receptor pairs for different disease states |
| Ligand | Receptor | LRpair | Pathway | Tissue | Disease Stage |
| Page: 1 |
Top |
Single-cell gene regulatory network inference analysis |
| Find out the significant the regulons (TFs) and the target genes of each regulon across cell types for different disease states |
| TF | Cell Type | Tissue | Disease Stage | Target Gene | RSS | Regulon Activity |
| ∗The dot plots of a searched regulon are shown for all cell subpopulations in each disease state of each tissue based on the regulon specific score inferred using pySCENIC and by calculating the average expression. |
| Page: 1 |
Top |
Somatic mutation of malignant transformation related genes |
| Annotation of somatic variants for genes involved in malignant transformation |
| Hugo Symbol | Variant Class | Variant Classification | dbSNP RS | HGVSc | HGVSp | HGVSp Short | SWISSPROT | BIOTYPE | SIFT | PolyPhen | Tumor Sample Barcode | Tissue | Histology | Sex | Age | Stage | Therapy Types | Drugs | Outcome |
| LIPA | SNV | Missense_Mutation | novel | c.194N>A | p.Arg65Gln | p.R65Q | P38571 | protein_coding | deleterious(0.01) | probably_damaging(0.972) | TCGA-AN-A046-01 | Breast | breast invasive carcinoma | Female | >=65 | I/II | Unknown | Unknown | SD |
| LIPA | SNV | Missense_Mutation | c.488N>T | p.Thr163Ile | p.T163I | P38571 | protein_coding | deleterious(0.01) | probably_damaging(0.999) | TCGA-BH-A0BZ-01 | Breast | breast invasive carcinoma | Female | <65 | III/IV | Chemotherapy | doxorubicin | CR | |
| LIPA | SNV | Missense_Mutation | c.620N>T | p.Ala207Val | p.A207V | P38571 | protein_coding | deleterious(0.01) | benign(0.015) | TCGA-C5-A1ML-01 | Cervix | cervical & endocervical cancer | Female | <65 | I/II | Unknown | Unknown | PD | |
| LIPA | SNV | Missense_Mutation | novel | c.194N>A | p.Arg65Gln | p.R65Q | P38571 | protein_coding | deleterious(0.01) | probably_damaging(0.972) | TCGA-AA-3984-01 | Colorectum | colon adenocarcinoma | Female | <65 | I/II | Unknown | Unknown | SD |
| LIPA | SNV | Missense_Mutation | rs140686447 | c.379N>T | p.Arg127Trp | p.R127W | P38571 | protein_coding | deleterious(0.01) | probably_damaging(0.997) | TCGA-AJ-A3BH-01 | Endometrium | uterine corpus endometrioid carcinoma | Female | Unknown | I/II | Unknown | Unknown | SD |
| LIPA | SNV | Missense_Mutation | c.1188N>T | p.Arg396Ser | p.R396S | P38571 | protein_coding | tolerated(0.1) | benign(0.01) | TCGA-AP-A059-01 | Endometrium | uterine corpus endometrioid carcinoma | Female | >=65 | I/II | Unknown | Unknown | SD | |
| LIPA | SNV | Missense_Mutation | novel | c.437N>C | p.Glu146Ala | p.E146A | P38571 | protein_coding | deleterious(0) | probably_damaging(1) | TCGA-AP-A059-01 | Endometrium | uterine corpus endometrioid carcinoma | Female | >=65 | I/II | Unknown | Unknown | SD |
| LIPA | SNV | Missense_Mutation | c.359N>A | p.Ser120Asn | p.S120N | P38571 | protein_coding | deleterious(0.02) | possibly_damaging(0.476) | TCGA-AP-A059-01 | Endometrium | uterine corpus endometrioid carcinoma | Female | >=65 | I/II | Unknown | Unknown | SD | |
| LIPA | SNV | Missense_Mutation | c.813N>G | p.Asn271Lys | p.N271K | P38571 | protein_coding | deleterious(0) | probably_damaging(0.986) | TCGA-AX-A05Z-01 | Endometrium | uterine corpus endometrioid carcinoma | Female | <65 | III/IV | Chemotherapy | adriamycin | SD | |
| LIPA | SNV | Missense_Mutation | rs199622801 | c.658C>T | p.Pro220Ser | p.P220S | P38571 | protein_coding | tolerated(0.21) | benign(0.243) | TCGA-AX-A06F-01 | Endometrium | uterine corpus endometrioid carcinoma | Female | <65 | III/IV | Chemotherapy | carboplatin | SD |
| Page: 1 2 3 |
Top |
Related drugs of malignant transformation related genes |
| Identification of chemicals and drugs interact with genes involved in malignant transfromation |
| (DGIdb 4.0) |
| Entrez ID | Symbol | Category | Interaction Types | Drug Claim Name | Drug Name | PMIDs |
| 3988 | LIPA | ENZYME, DRUGGABLE GENOME | TRIFLUOPERAZINE | TRIFLUOPERAZINE | 9270979 | |
| 3988 | LIPA | ENZYME, DRUGGABLE GENOME | TRIIODOTHYRONINE | LIOTHYRONINE SODIUM | 6713293 | |
| 3988 | LIPA | ENZYME, DRUGGABLE GENOME | HORMONES | 6543190,7272337,7056842 | ||
| 3988 | LIPA | ENZYME, DRUGGABLE GENOME | LOVASTATIN | LOVASTATIN | 11380065 | |
| 3988 | LIPA | ENZYME, DRUGGABLE GENOME | SBC-102 | SEBELIPASE ALFA | ||
| 3988 | LIPA | ENZYME, DRUGGABLE GENOME | GLUCAGON | GLUCAGON | 8900456 |
| Page: 1 |

Copyright 2023-Present -The University of Texas Health Science Center at Houston |