
|
|||||
|
 | |
| |
| |
| |
| |
| |
|
Gene: LINGO1 |
Gene summary for LINGO1 |
| Gene information | Species | Human | Gene symbol | LINGO1 | Gene ID | 84894 |
| Gene name | leucine rich repeat and Ig domain containing 1 | |
| Gene Alias | LERN1 | |
| Cytomap | 15q24.3 | |
| Gene Type | protein-coding | GO ID | GO:0005575 | UniProtAcc | Q96FE5 |
Top |
Malignant transformation analysis |
| Identification of the aberrant gene expression in precancerous and cancerous lesions by comparing the gene expression of stem-like cells in diseased tissues with normal stem cells |
| Entrez ID | Symbol | Replicates | Species | Organ | Tissue | Adj P-value | Log2FC | Malignancy |
| 84894 | LINGO1 | HTA11_3410_2000001011 | Human | Colorectum | AD | 1.02e-08 | -5.02e-01 | 0.0155 |
| 84894 | LINGO1 | HTA11_2951_2000001011 | Human | Colorectum | AD | 3.47e-02 | 3.37e-01 | 0.0216 |
| 84894 | LINGO1 | HTA11_78_2000001011 | Human | Colorectum | AD | 2.89e-05 | -2.35e-01 | -0.1088 |
| 84894 | LINGO1 | HTA11_347_2000001011 | Human | Colorectum | AD | 3.73e-07 | -2.81e-01 | -0.1954 |
| 84894 | LINGO1 | HTA11_3361_2000001011 | Human | Colorectum | AD | 4.96e-12 | 7.14e-01 | -0.1207 |
| 84894 | LINGO1 | HTA11_866_2000001011 | Human | Colorectum | AD | 1.28e-06 | 9.97e-02 | -0.1001 |
| 84894 | LINGO1 | HTA11_1391_2000001011 | Human | Colorectum | AD | 1.94e-02 | 5.66e-02 | -0.059 |
| 84894 | LINGO1 | HTA11_866_3004761011 | Human | Colorectum | AD | 4.59e-05 | -4.63e-01 | 0.096 |
| 84894 | LINGO1 | HTA11_10623_2000001011 | Human | Colorectum | AD | 2.24e-03 | -6.45e-01 | -0.0177 |
| 84894 | LINGO1 | HTA11_10711_2000001011 | Human | Colorectum | AD | 7.35e-05 | -5.92e-01 | 0.0338 |
| 84894 | LINGO1 | HTA11_7696_3000711011 | Human | Colorectum | AD | 5.82e-15 | -5.97e-01 | 0.0674 |
| 84894 | LINGO1 | HTA11_6818_2000001021 | Human | Colorectum | AD | 9.55e-04 | -3.92e-01 | 0.0588 |
| 84894 | LINGO1 | HTA11_99999970781_79442 | Human | Colorectum | MSS | 3.05e-14 | -5.43e-01 | 0.294 |
| 84894 | LINGO1 | HTA11_99999965062_69753 | Human | Colorectum | MSI-H | 2.53e-03 | 5.24e-01 | 0.3487 |
| 84894 | LINGO1 | HTA11_99999965104_69814 | Human | Colorectum | MSS | 1.37e-07 | -6.45e-01 | 0.281 |
| 84894 | LINGO1 | HTA11_99999971662_82457 | Human | Colorectum | MSS | 7.98e-14 | -5.73e-01 | 0.3859 |
| 84894 | LINGO1 | HTA11_99999974143_84620 | Human | Colorectum | MSS | 1.31e-10 | -3.98e-01 | 0.3005 |
| 84894 | LINGO1 | A015-C-203 | Human | Colorectum | FAP | 6.02e-52 | 1.02e+00 | -0.1294 |
| 84894 | LINGO1 | A015-C-204 | Human | Colorectum | FAP | 5.76e-20 | 8.34e-01 | -0.0228 |
| 84894 | LINGO1 | A014-C-040 | Human | Colorectum | FAP | 1.43e-27 | 1.27e+00 | -0.1184 |
| Page: 1 2 |
| Tissue | Expression Dynamics | Abbreviation |
| Colorectum (GSE201348) |  | FAP: Familial adenomatous polyposis |
| CRC: Colorectal cancer | ||
| Colorectum (HTA11) | 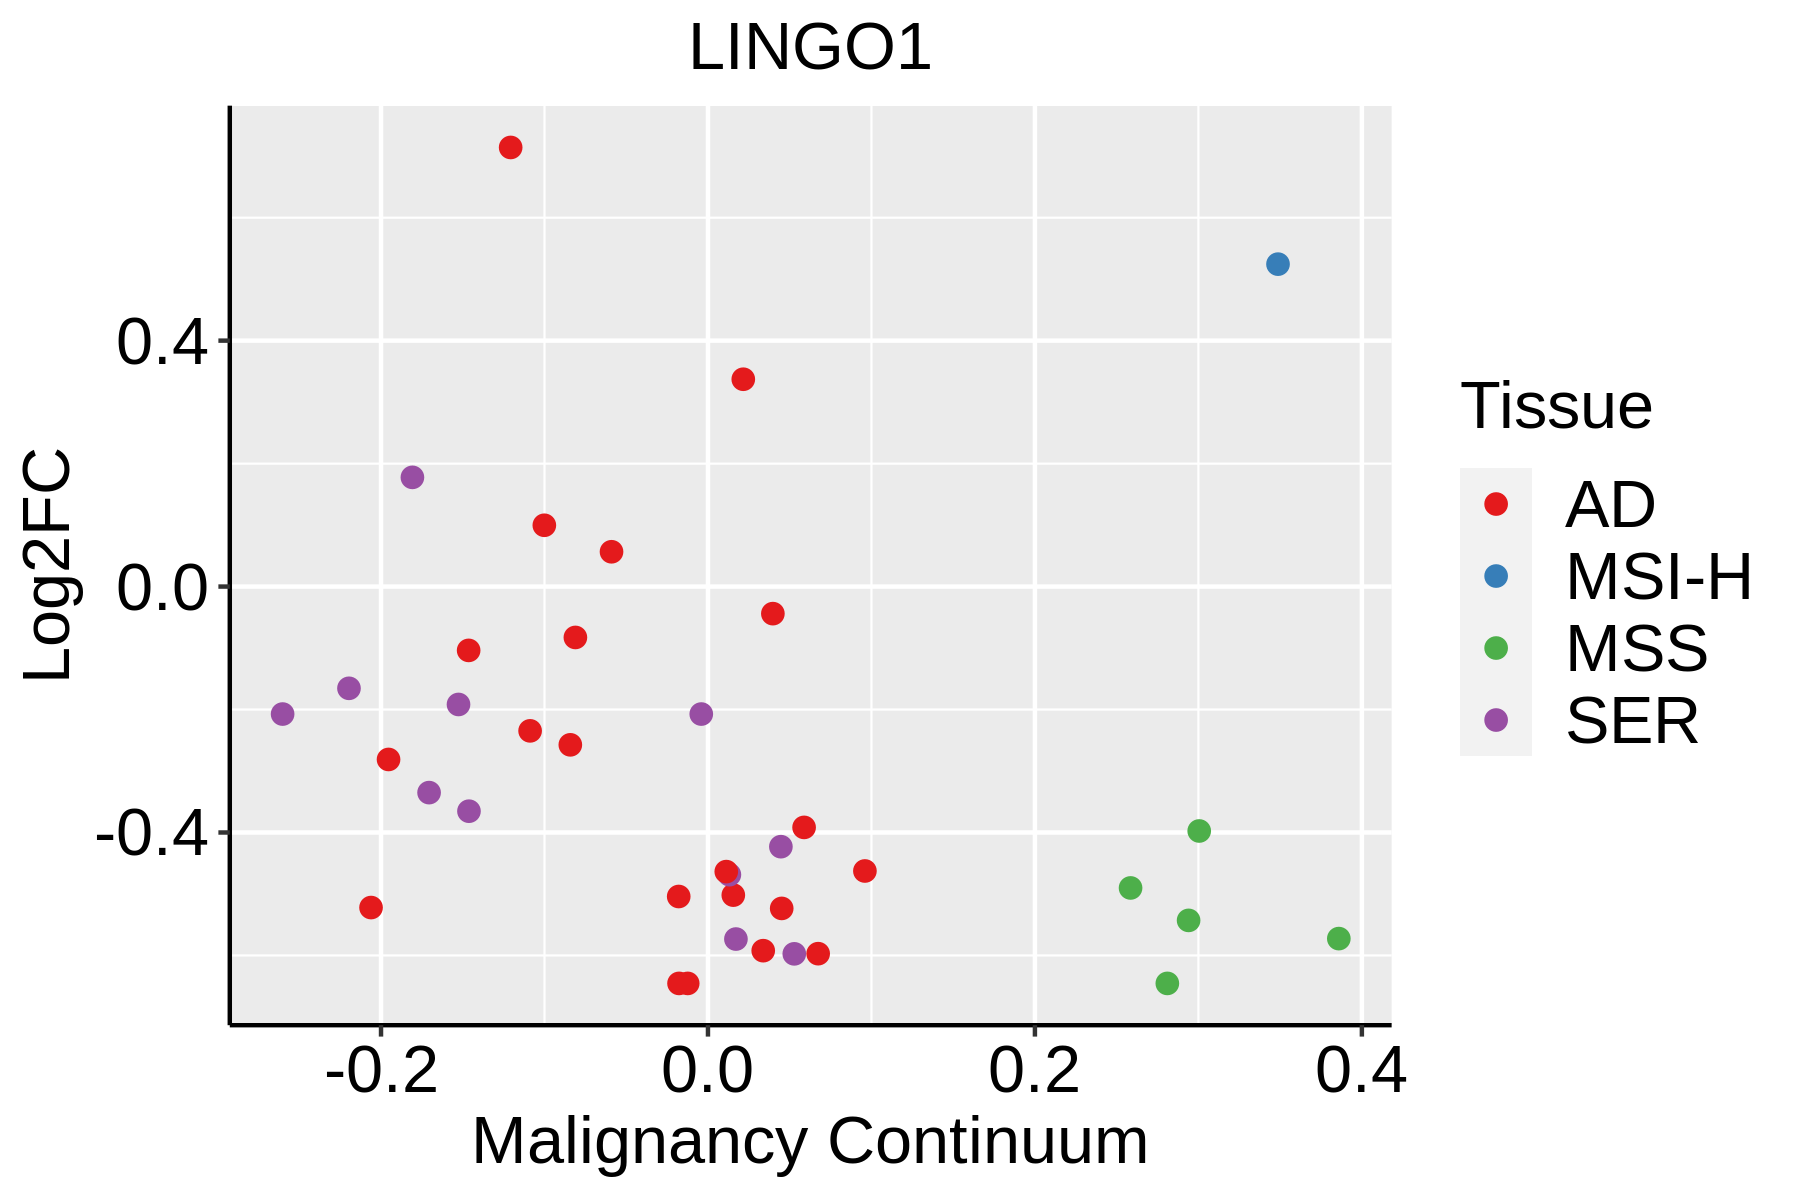 | AD: Adenomas |
| SER: Sessile serrated lesions | ||
| MSI-H: Microsatellite-high colorectal cancer | ||
| MSS: Microsatellite stable colorectal cancer | ||
| Liver | 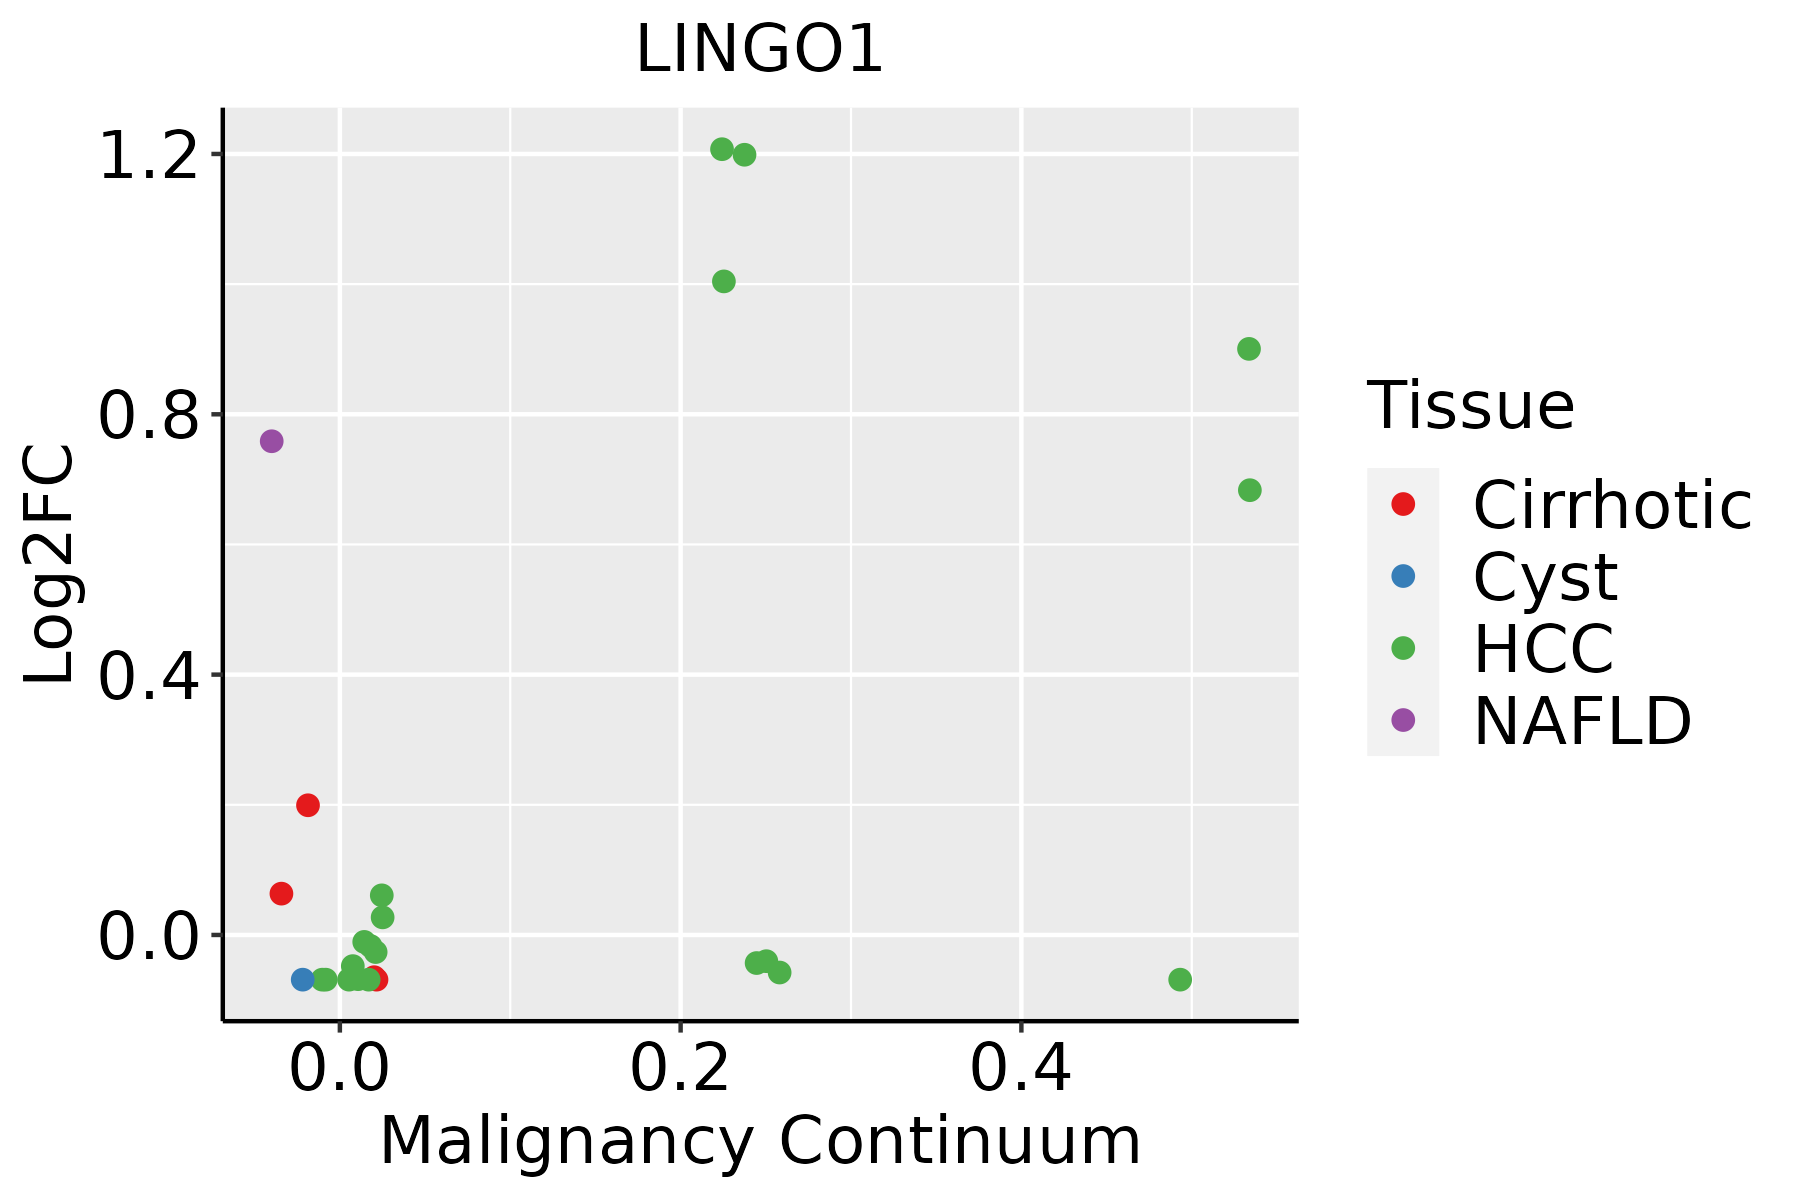 | HCC: Hepatocellular carcinoma |
| NAFLD: Non-alcoholic fatty liver disease |
| ∗log2FC in expression of this searched gene in stem-like cells from each diseased tissue sample relative to stem-like cells in normal samples in each tissue plotted against the malignancy continuum. Samples are colored based on if they are from different disease stage. |
Top |
Malignant transformation related pathway analysis |
| Find out the enriched GO biological processes and KEGG pathways involved in transition from healthy to precancer to cancer |
| Tissue | Disease Stage | Enriched GO biological Processes |
| Colorectum | AD |  |
| Colorectum | SER |  |
| Colorectum | MSS |  |
| Colorectum | MSI-H |  |
| Colorectum | FAP |  |
| ∗Top 15 enriched GO BP terms are showed in the bar plot of each disease state in each tissue. Each row represents a significant GO biological process which is colored according to the -log10(p.adjust). |
| Page: 1 2 3 4 5 6 7 8 9 |
| GO ID | Tissue | Disease Stage | Description | Gene Ratio | Bg Ratio | pvalue | p.adjust | Count |
| Page: 1 |
| Pathway ID | Tissue | Disease Stage | Description | Gene Ratio | Bg Ratio | pvalue | p.adjust | qvalue | Count |
| Page: 1 |
Top |
Cell-cell communication analysis |
| Identification of potential cell-cell interactions between two cell types and their ligand-receptor pairs for different disease states |
| Ligand | Receptor | LRpair | Pathway | Tissue | Disease Stage |
| Page: 1 |
Top |
Single-cell gene regulatory network inference analysis |
| Find out the significant the regulons (TFs) and the target genes of each regulon across cell types for different disease states |
| TF | Cell Type | Tissue | Disease Stage | Target Gene | RSS | Regulon Activity |
| ∗The dot plots of a searched regulon are shown for all cell subpopulations in each disease state of each tissue based on the regulon specific score inferred using pySCENIC and by calculating the average expression. |
| Page: 1 |
Top |
Somatic mutation of malignant transformation related genes |
| Annotation of somatic variants for genes involved in malignant transformation |
| Hugo Symbol | Variant Class | Variant Classification | dbSNP RS | HGVSc | HGVSp | HGVSp Short | SWISSPROT | BIOTYPE | SIFT | PolyPhen | Tumor Sample Barcode | Tissue | Histology | Sex | Age | Stage | Therapy Types | Drugs | Outcome |
| LINGO1 | SNV | Missense_Mutation | c.925G>C | p.Glu309Gln | p.E309Q | Q96FE5 | protein_coding | tolerated(0.12) | benign(0.001) | TCGA-AC-A23H-01 | Breast | breast invasive carcinoma | Female | >=65 | I/II | Unknown | Unknown | PD | |
| LINGO1 | SNV | Missense_Mutation | c.331G>A | p.Glu111Lys | p.E111K | Q96FE5 | protein_coding | deleterious(0) | probably_damaging(0.998) | TCGA-AC-A23H-01 | Breast | breast invasive carcinoma | Female | >=65 | I/II | Unknown | Unknown | PD | |
| LINGO1 | SNV | Missense_Mutation | c.526N>A | p.Asp176Asn | p.D176N | Q96FE5 | protein_coding | deleterious(0.02) | probably_damaging(0.993) | TCGA-BH-A0DE-01 | Breast | breast invasive carcinoma | Female | <65 | I/II | Unknown | Unknown | SD | |
| LINGO1 | SNV | Missense_Mutation | c.428N>A | p.Ser143Asn | p.S143N | Q96FE5 | protein_coding | tolerated(0.15) | benign(0.062) | TCGA-BH-A0HO-01 | Breast | breast invasive carcinoma | Female | <65 | I/II | Chemotherapy | cyclophosphamide | SD | |
| LINGO1 | SNV | Missense_Mutation | rs369718013 | c.847N>A | p.Val283Ile | p.V283I | Q96FE5 | protein_coding | tolerated(0.16) | benign(0) | TCGA-E2-A1B6-01 | Breast | breast invasive carcinoma | Female | <65 | I/II | Unspecific | Adriamycin | SD |
| LINGO1 | SNV | Missense_Mutation | c.1588N>A | p.Ala530Thr | p.A530T | Q96FE5 | protein_coding | tolerated(0.38) | benign(0.115) | TCGA-C5-A1M7-01 | Cervix | cervical & endocervical cancer | Female | <65 | I/II | Unknown | Unknown | SD | |
| LINGO1 | SNV | Missense_Mutation | c.646N>A | p.Gly216Ser | p.G216S | Q96FE5 | protein_coding | tolerated(0.84) | benign(0.023) | TCGA-JW-A5VJ-01 | Cervix | cervical & endocervical cancer | Female | <65 | I/II | Unknown | Unknown | PD | |
| LINGO1 | SNV | Missense_Mutation | c.733G>C | p.Glu245Gln | p.E245Q | Q96FE5 | protein_coding | tolerated(0.07) | benign(0.193) | TCGA-LP-A4AV-01 | Cervix | cervical & endocervical cancer | Female | <65 | I/II | Unknown | Unknown | SD | |
| LINGO1 | SNV | Missense_Mutation | c.1588N>A | p.Ala530Thr | p.A530T | Q96FE5 | protein_coding | tolerated(0.38) | benign(0.115) | TCGA-VS-A9UJ-01 | Cervix | cervical & endocervical cancer | Female | <65 | I/II | Unknown | Unknown | PD | |
| LINGO1 | SNV | Missense_Mutation | novel | c.1150N>T | p.Arg384Cys | p.R384C | Q96FE5 | protein_coding | deleterious(0) | probably_damaging(0.988) | TCGA-VS-A9UL-01 | Cervix | cervical & endocervical cancer | Female | >=65 | III/IV | Unknown | Unknown | PD |
| Page: 1 2 3 4 5 6 7 8 9 10 11 12 |
Top |
Related drugs of malignant transformation related genes |
| Identification of chemicals and drugs interact with genes involved in malignant transfromation |
| (DGIdb 4.0) |
| Entrez ID | Symbol | Category | Interaction Types | Drug Claim Name | Drug Name | PMIDs |
| 84894 | LINGO1 | DRUGGABLE GENOME | antibody | 310264704 | OPICINUMAB | |
| 84894 | LINGO1 | DRUGGABLE GENOME | inhibitor | CHEMBL3544922 | OPICINUMAB | |
| 84894 | LINGO1 | DRUGGABLE GENOME | BIIB-033 | OPICINUMAB |
| Page: 1 |

Copyright 2023-Present -The University of Texas Health Science Center at Houston |