
|
|||||
|
 | |
| |
| |
| |
| |
| |
|
Gene: LINC00675 |
Gene summary for LINC00675 |
| Gene information | Species | Human | Gene symbol | LINC00675 | Gene ID | 100289255 |
| Gene name | transmembrane protein 238 like | |
| Gene Alias | FORCP | |
| Cytomap | 17p13.1-p12 | |
| Gene Type | protein-coding | GO ID | GO:0005575 | UniProtAcc | NA |
Top |
Malignant transformation analysis |
| Identification of the aberrant gene expression in precancerous and cancerous lesions by comparing the gene expression of stem-like cells in diseased tissues with normal stem cells |
| Entrez ID | Symbol | Replicates | Species | Organ | Tissue | Adj P-value | Log2FC | Malignancy |
| 100289255 | LINC00675 | Pat01-B | Human | Stomach | GC | 1.11e-13 | -5.50e-01 | 0.5754 |
| 100289255 | LINC00675 | Pat02-B | Human | Stomach | GC | 1.39e-14 | -5.50e-01 | 0.0368 |
| 100289255 | LINC00675 | Pat03-B | Human | Stomach | GC | 2.56e-11 | -5.50e-01 | 0.3693 |
| 100289255 | LINC00675 | Pat04-B | Human | Stomach | GC | 9.48e-05 | -5.50e-01 | -0.1483 |
| 100289255 | LINC00675 | Pat05-B | Human | Stomach | GC | 3.38e-04 | -5.50e-01 | -0.0353 |
| 100289255 | LINC00675 | Pat06-B | Human | Stomach | GC | 2.84e-11 | -5.50e-01 | -0.1961 |
| 100289255 | LINC00675 | Pat08-B | Human | Stomach | GC | 3.02e-03 | -5.50e-01 | 0.0182 |
| 100289255 | LINC00675 | Pat09-B | Human | Stomach | GC | 2.47e-09 | -5.50e-01 | -0.0359 |
| 100289255 | LINC00675 | Pat11-B | Human | Stomach | GC | 1.44e-03 | -5.50e-01 | -0.182 |
| 100289255 | LINC00675 | Pat12-B | Human | Stomach | GC | 2.45e-12 | -5.50e-01 | 0.0325 |
| 100289255 | LINC00675 | Pat13-B | Human | Stomach | GC | 1.07e-05 | -5.50e-01 | 0.0555 |
| 100289255 | LINC00675 | Pat15-B | Human | Stomach | GC | 3.10e-09 | -5.50e-01 | -0.0778 |
| 100289255 | LINC00675 | Pat16-B | Human | Stomach | GC | 1.39e-14 | -5.50e-01 | 0.1918 |
| 100289255 | LINC00675 | Pat17-B | Human | Stomach | GC | 6.94e-14 | -5.50e-01 | 0.3109 |
| 100289255 | LINC00675 | Pat18-B | Human | Stomach | GC | 1.25e-10 | -5.50e-01 | -0.0432 |
| 100289255 | LINC00675 | Pat19-B | Human | Stomach | GC | 1.76e-07 | -5.50e-01 | 0.0826 |
| 100289255 | LINC00675 | Pat22-B | Human | Stomach | GC | 1.12e-09 | -5.50e-01 | -0.1042 |
| 100289255 | LINC00675 | Pat24-B | Human | Stomach | GC | 1.40e-05 | -5.50e-01 | -0.1184 |
| 100289255 | LINC00675 | Pat25-A | Human | Stomach | CAG with IM | 5.43e-16 | -5.50e-01 | -0.1648 |
| 100289255 | LINC00675 | Pat26-A | Human | Stomach | CSG | 6.94e-14 | -5.50e-01 | -0.2402 |
| Page: 1 2 |
| Tissue | Expression Dynamics | Abbreviation |
| GC | 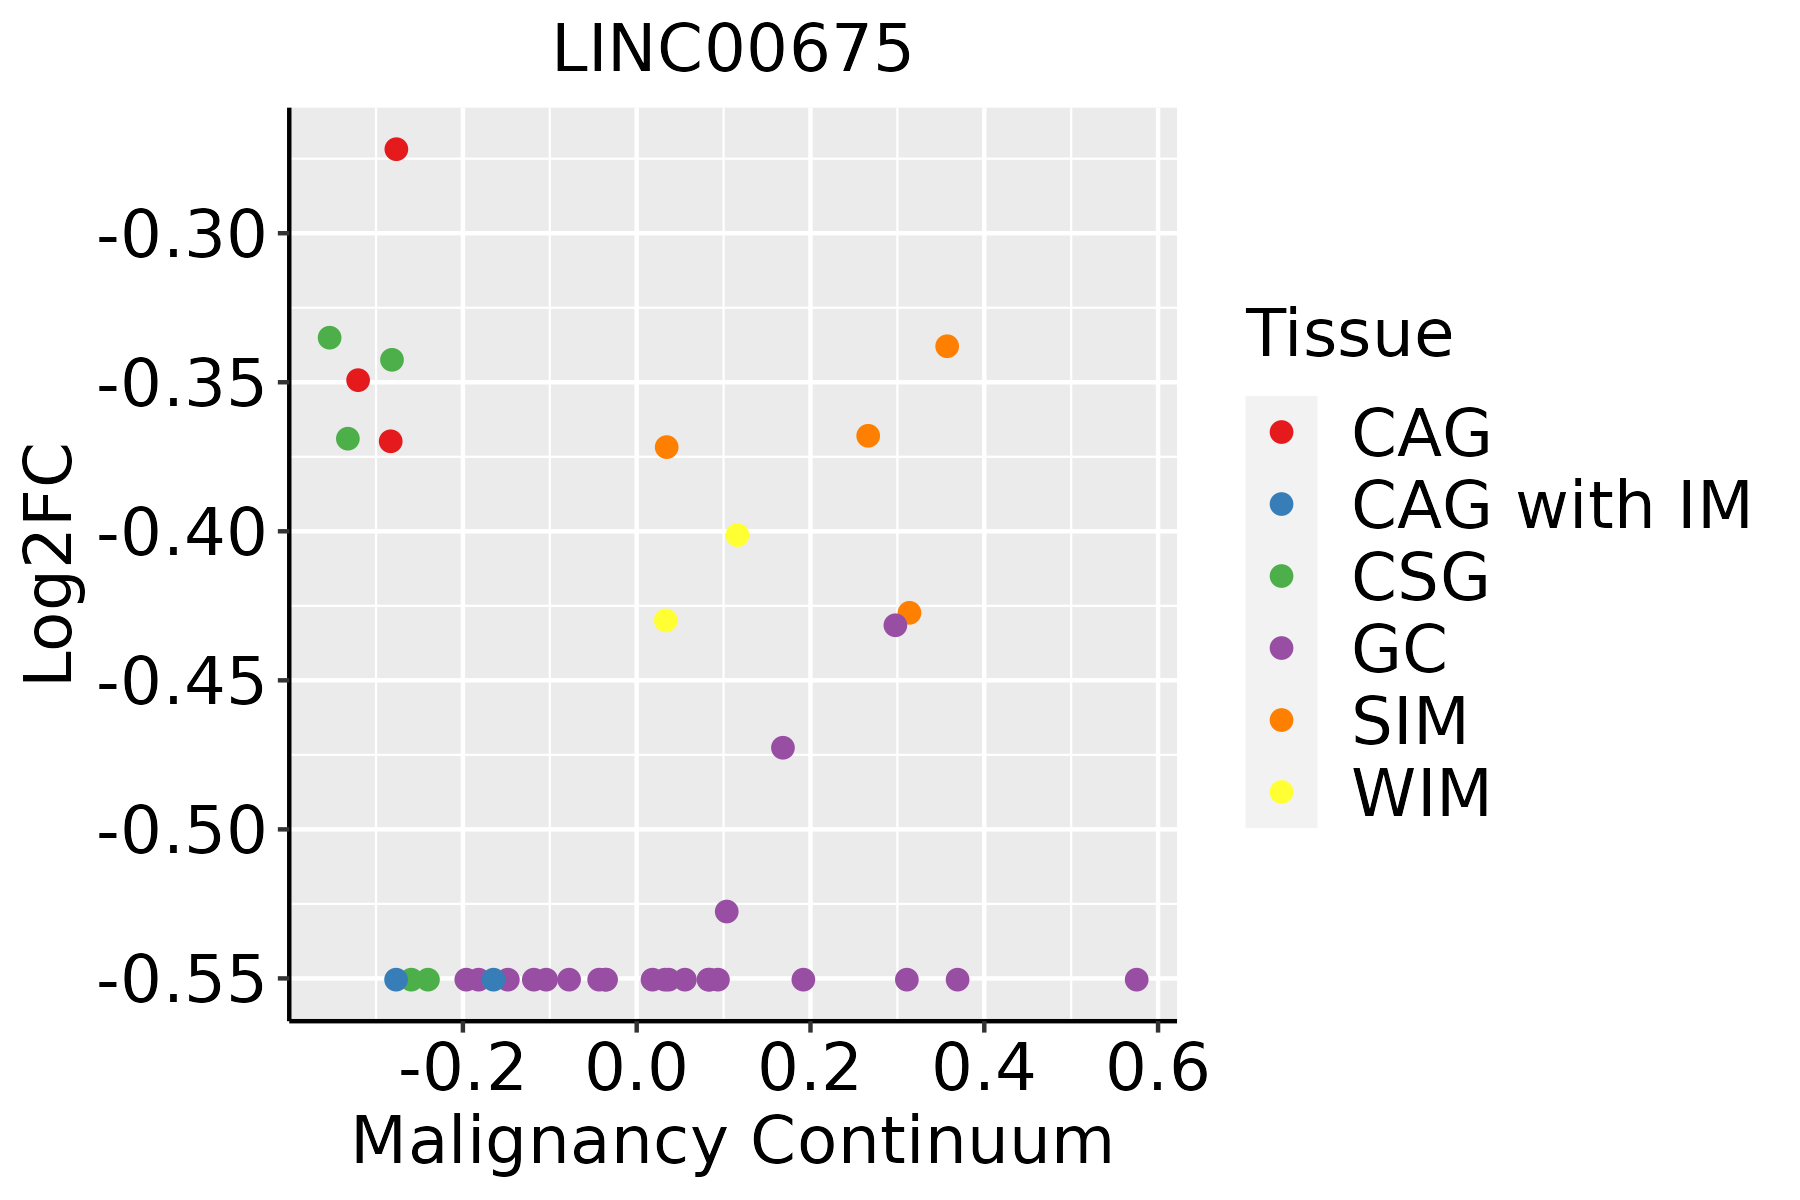 | CAG: Chronic atrophic gastritis |
| CAG with IM: Chronic atrophic gastritis with intestinal metaplasia | ||
| CSG: Chronic superficial gastritis | ||
| GC: Gastric cancer | ||
| SIM: Severe intestinal metaplasia | ||
| WIM: Wild intestinal metaplasia |
| ∗log2FC in expression of this searched gene in stem-like cells from each diseased tissue sample relative to stem-like cells in normal samples in each tissue plotted against the malignancy continuum. Samples are colored based on if they are from different disease stage. |
Top |
Malignant transformation related pathway analysis |
| Find out the enriched GO biological processes and KEGG pathways involved in transition from healthy to precancer to cancer |
| Tissue | Disease Stage | Enriched GO biological Processes |
| Colorectum | AD |  |
| Colorectum | SER |  |
| Colorectum | MSS |  |
| Colorectum | MSI-H |  |
| Colorectum | FAP |  |
| ∗Top 15 enriched GO BP terms are showed in the bar plot of each disease state in each tissue. Each row represents a significant GO biological process which is colored according to the -log10(p.adjust). |
| Page: 1 2 3 4 5 6 7 8 9 |
| GO ID | Tissue | Disease Stage | Description | Gene Ratio | Bg Ratio | pvalue | p.adjust | Count |
| Page: 1 |
| Pathway ID | Tissue | Disease Stage | Description | Gene Ratio | Bg Ratio | pvalue | p.adjust | qvalue | Count |
| Page: 1 |
Top |
Cell-cell communication analysis |
| Identification of potential cell-cell interactions between two cell types and their ligand-receptor pairs for different disease states |
| Ligand | Receptor | LRpair | Pathway | Tissue | Disease Stage |
| Page: 1 |
Top |
Single-cell gene regulatory network inference analysis |
| Find out the significant the regulons (TFs) and the target genes of each regulon across cell types for different disease states |
| TF | Cell Type | Tissue | Disease Stage | Target Gene | RSS | Regulon Activity |
| ∗The dot plots of a searched regulon are shown for all cell subpopulations in each disease state of each tissue based on the regulon specific score inferred using pySCENIC and by calculating the average expression. |
| Page: 1 |
Top |
Somatic mutation of malignant transformation related genes |
| Annotation of somatic variants for genes involved in malignant transformation |
| Hugo Symbol | Variant Class | Variant Classification | dbSNP RS | HGVSc | HGVSp | HGVSp Short | SWISSPROT | BIOTYPE | SIFT | PolyPhen | Tumor Sample Barcode | Tissue | Histology | Sex | Age | Stage | Therapy Types | Drugs | Outcome |
| LINC00675 | SNV | Missense_Mutation | rs759942658 | c.80N>T | p.Ala27Val | p.A27V | protein_coding | tolerated(1) | benign(0) | TCGA-2W-A8YY-01 | Cervix | cervical & endocervical cancer | Female | <65 | I/II | Chemotherapy | cisplatin | CR | |
| LINC00675 | SNV | Missense_Mutation | novel | c.169N>A | p.Leu57Ile | p.L57I | protein_coding | tolerated(0.11) | benign(0) | TCGA-EX-A449-01 | Cervix | cervical & endocervical cancer | Female | <65 | I/II | Chemotherapy | cisplatin | CR | |
| LINC00675 | SNV | Missense_Mutation | rs566922912 | c.65N>T | p.Ala22Val | p.A22V | protein_coding | deleterious(0) | possibly_damaging(0.871) | TCGA-BG-A222-01 | Endometrium | uterine corpus endometrioid carcinoma | Female | <65 | I/II | Unknown | Unknown | SD | |
| LINC00675 | SNV | Missense_Mutation | rs574640627 | c.64N>A | p.Ala22Thr | p.A22T | protein_coding | deleterious(0) | probably_damaging(0.911) | TCGA-FI-A2D0-01 | Endometrium | uterine corpus endometrioid carcinoma | Female | <65 | I/II | Unknown | Unknown | SD | |
| LINC00675 | SNV | Missense_Mutation | novel | c.148N>G | p.Thr50Ala | p.T50A | protein_coding | tolerated(0.71) | possibly_damaging(0.807) | TCGA-FI-A2D5-01 | Endometrium | uterine corpus endometrioid carcinoma | Female | <65 | III/IV | Chemotherapy | carboplatinum | PD |
| Page: 1 |
Top |
Related drugs of malignant transformation related genes |
| Identification of chemicals and drugs interact with genes involved in malignant transfromation |
| (DGIdb 4.0) |
| Entrez ID | Symbol | Category | Interaction Types | Drug Claim Name | Drug Name | PMIDs |
| Page: 1 |

Copyright 2023-Present -The University of Texas Health Science Center at Houston |