
|
|||||
|
 | |
| |
| |
| |
| |
| |
|
Gene: LIN9 |
Gene summary for LIN9 |
| Gene information | Species | Human | Gene symbol | LIN9 | Gene ID | 286826 |
| Gene name | lin-9 DREAM MuvB core complex component | |
| Gene Alias | BARA | |
| Cytomap | 1q42.12 | |
| Gene Type | protein-coding | GO ID | GO:0000003 | UniProtAcc | Q5TKA1 |
Top |
Malignant transformation analysis |
| Identification of the aberrant gene expression in precancerous and cancerous lesions by comparing the gene expression of stem-like cells in diseased tissues with normal stem cells |
| Entrez ID | Symbol | Replicates | Species | Organ | Tissue | Adj P-value | Log2FC | Malignancy |
| 286826 | LIN9 | CCI_1 | Human | Cervix | CC | 4.33e-08 | 5.42e-01 | 0.528 |
| 286826 | LIN9 | CCI_2 | Human | Cervix | CC | 1.70e-09 | 5.77e-01 | 0.5249 |
| 286826 | LIN9 | CCI_3 | Human | Cervix | CC | 7.96e-20 | 8.86e-01 | 0.516 |
| 286826 | LIN9 | LZE7T | Human | Esophagus | ESCC | 3.55e-02 | 1.67e-01 | 0.0667 |
| 286826 | LIN9 | LZE24T | Human | Esophagus | ESCC | 4.54e-03 | 7.46e-02 | 0.0596 |
| 286826 | LIN9 | P2T-E | Human | Esophagus | ESCC | 2.93e-15 | 2.69e-01 | 0.1177 |
| 286826 | LIN9 | P4T-E | Human | Esophagus | ESCC | 1.58e-05 | 9.20e-02 | 0.1323 |
| 286826 | LIN9 | P5T-E | Human | Esophagus | ESCC | 2.03e-09 | 1.88e-01 | 0.1327 |
| 286826 | LIN9 | P9T-E | Human | Esophagus | ESCC | 3.18e-07 | 1.12e-01 | 0.1131 |
| 286826 | LIN9 | P10T-E | Human | Esophagus | ESCC | 1.97e-10 | 2.28e-01 | 0.116 |
| 286826 | LIN9 | P12T-E | Human | Esophagus | ESCC | 1.51e-04 | 1.49e-01 | 0.1122 |
| 286826 | LIN9 | P15T-E | Human | Esophagus | ESCC | 4.40e-11 | 1.88e-01 | 0.1149 |
| 286826 | LIN9 | P16T-E | Human | Esophagus | ESCC | 2.06e-08 | 1.85e-01 | 0.1153 |
| 286826 | LIN9 | P17T-E | Human | Esophagus | ESCC | 4.94e-02 | 2.13e-01 | 0.1278 |
| 286826 | LIN9 | P20T-E | Human | Esophagus | ESCC | 5.20e-05 | 8.53e-02 | 0.1124 |
| 286826 | LIN9 | P22T-E | Human | Esophagus | ESCC | 4.17e-05 | 1.27e-01 | 0.1236 |
| 286826 | LIN9 | P23T-E | Human | Esophagus | ESCC | 1.39e-04 | 1.69e-01 | 0.108 |
| 286826 | LIN9 | P26T-E | Human | Esophagus | ESCC | 4.17e-05 | 1.38e-01 | 0.1276 |
| 286826 | LIN9 | P27T-E | Human | Esophagus | ESCC | 1.78e-03 | 1.28e-01 | 0.1055 |
| 286826 | LIN9 | P28T-E | Human | Esophagus | ESCC | 7.98e-13 | 2.51e-01 | 0.1149 |
| Page: 1 2 3 |
| Tissue | Expression Dynamics | Abbreviation |
| Cervix | 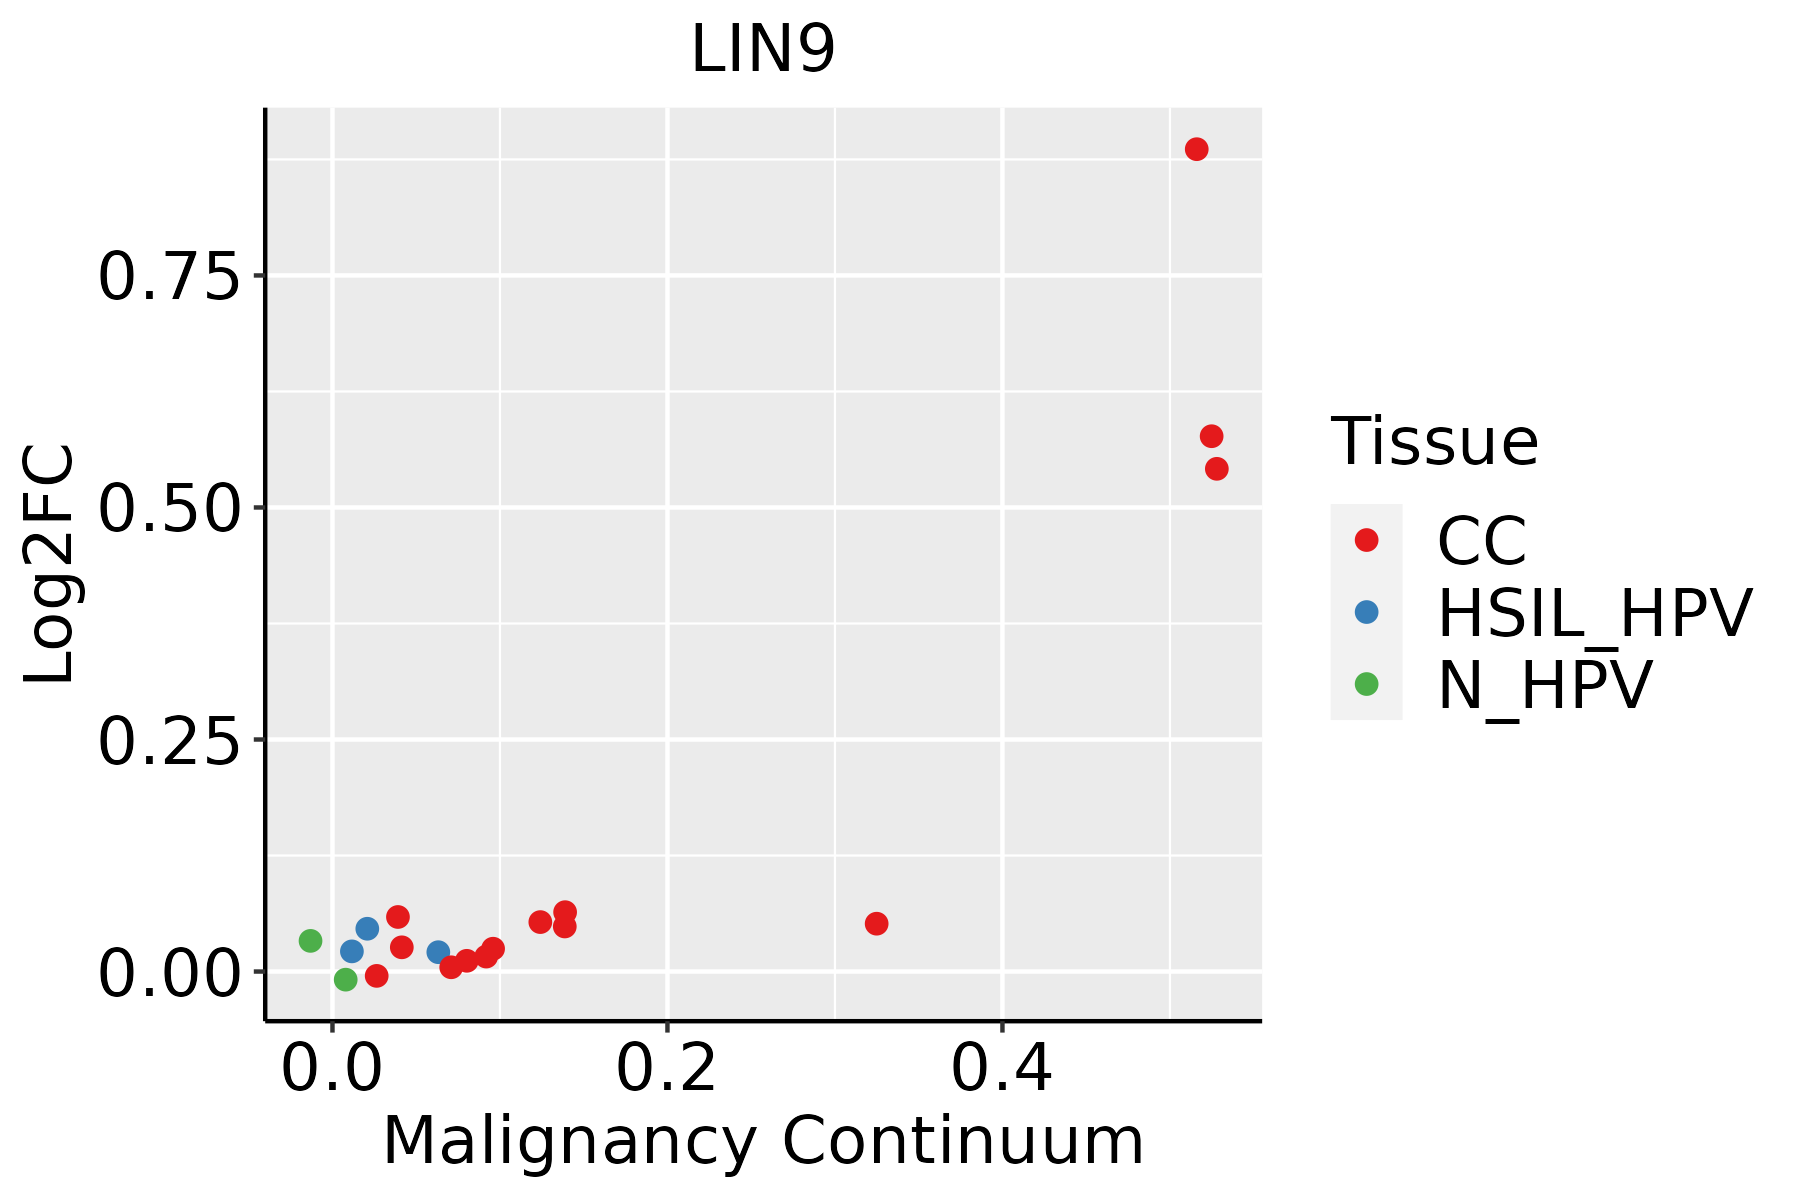 | CC: Cervix cancer |
| HSIL_HPV: HPV-infected high-grade squamous intraepithelial lesions | ||
| N_HPV: HPV-infected normal cervix | ||
| Esophagus | 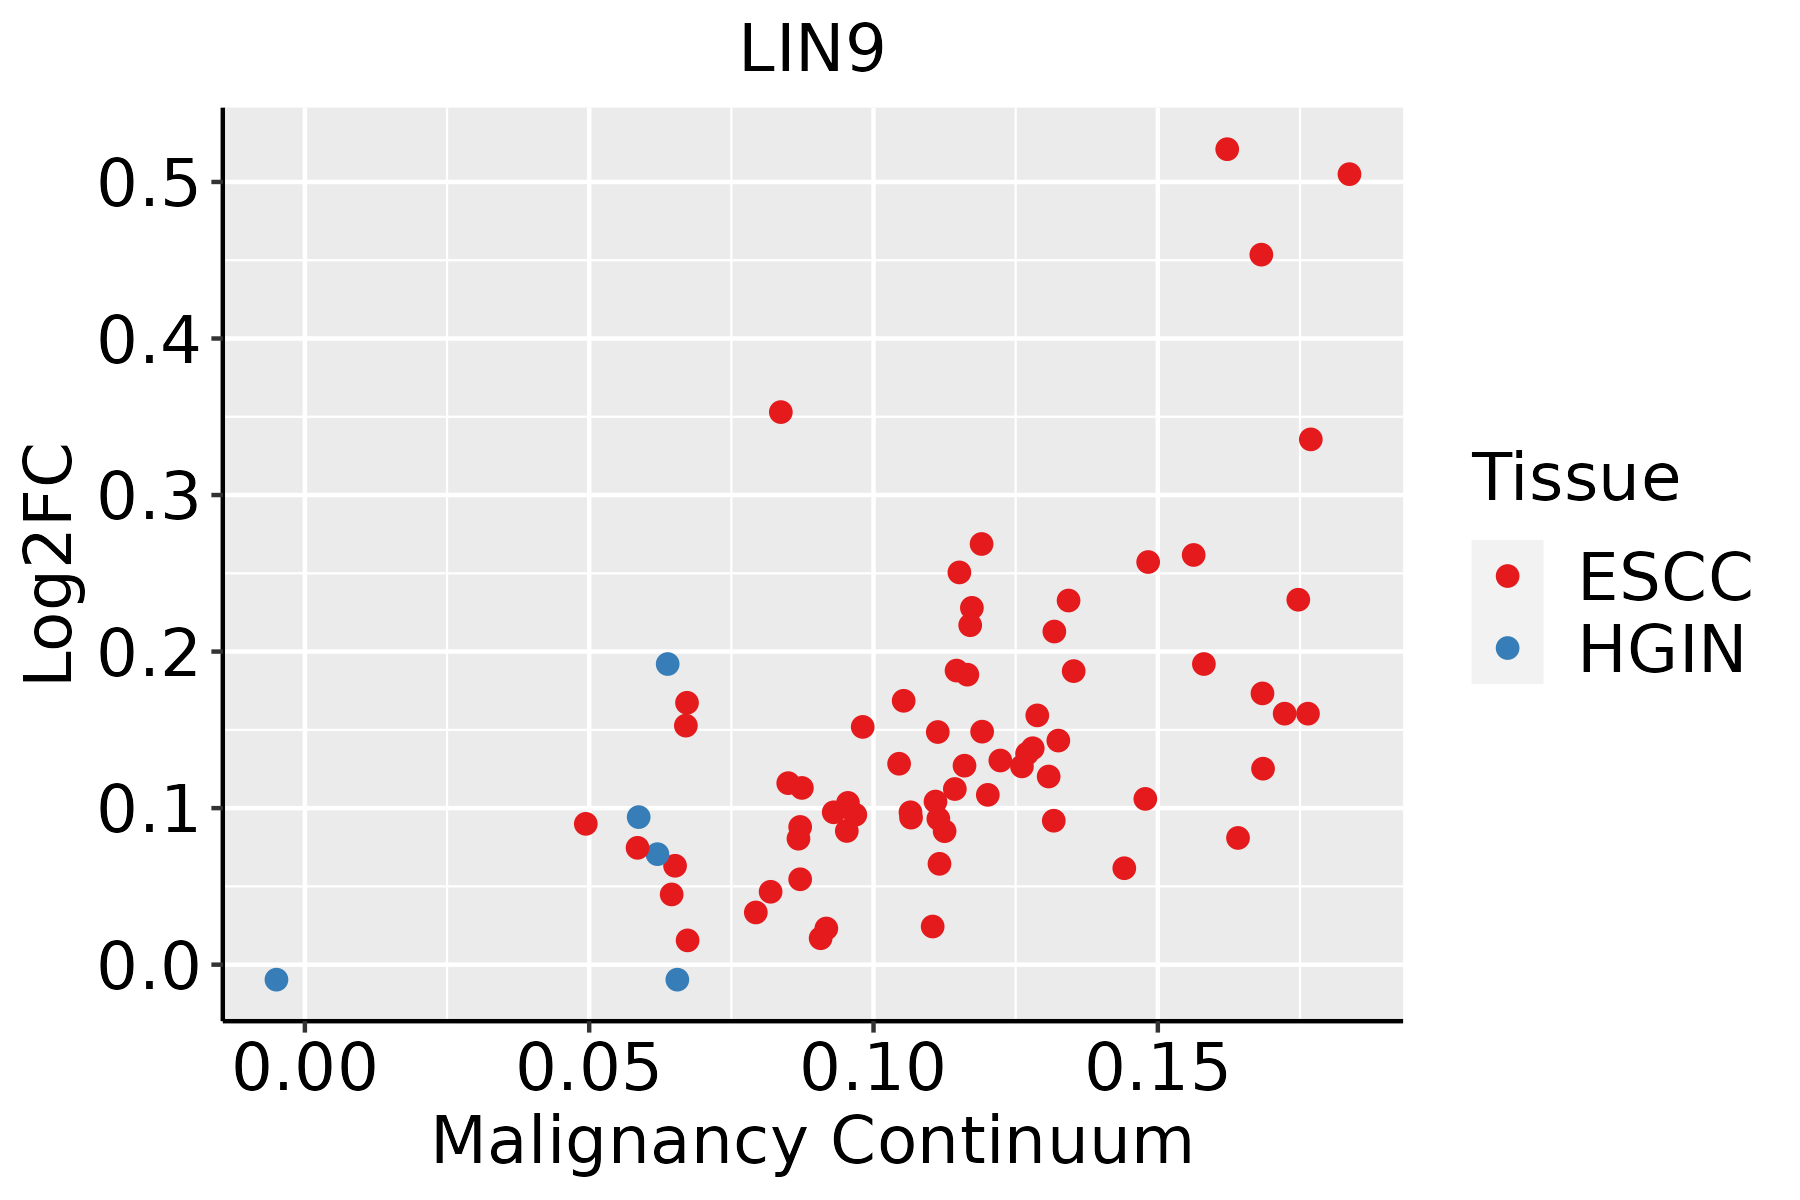 | ESCC: Esophageal squamous cell carcinoma |
| HGIN: High-grade intraepithelial neoplasias | ||
| LGIN: Low-grade intraepithelial neoplasias |
| ∗log2FC in expression of this searched gene in stem-like cells from each diseased tissue sample relative to stem-like cells in normal samples in each tissue plotted against the malignancy continuum. Samples are colored based on if they are from different disease stage. |
Top |
Malignant transformation related pathway analysis |
| Find out the enriched GO biological processes and KEGG pathways involved in transition from healthy to precancer to cancer |
| Tissue | Disease Stage | Enriched GO biological Processes |
| Colorectum | AD |  |
| Colorectum | SER |  |
| Colorectum | MSS |  |
| Colorectum | MSI-H |  |
| Colorectum | FAP |  |
| ∗Top 15 enriched GO BP terms are showed in the bar plot of each disease state in each tissue. Each row represents a significant GO biological process which is colored according to the -log10(p.adjust). |
| Page: 1 2 3 4 5 6 7 8 9 |
| GO ID | Tissue | Disease Stage | Description | Gene Ratio | Bg Ratio | pvalue | p.adjust | Count |
| GO:007189716 | Esophagus | ESCC | DNA biosynthetic process | 127/8552 | 180/18723 | 1.04e-11 | 3.85e-10 | 127 |
| Page: 1 |
| Pathway ID | Tissue | Disease Stage | Description | Gene Ratio | Bg Ratio | pvalue | p.adjust | qvalue | Count |
| hsa0421810 | Cervix | CC | Cellular senescence | 49/1267 | 156/8465 | 1.30e-07 | 1.63e-06 | 9.61e-07 | 49 |
| hsa0421815 | Cervix | CC | Cellular senescence | 49/1267 | 156/8465 | 1.30e-07 | 1.63e-06 | 9.61e-07 | 49 |
| hsa0421829 | Esophagus | ESCC | Cellular senescence | 119/4205 | 156/8465 | 5.89e-12 | 9.40e-11 | 4.81e-11 | 119 |
| hsa0421838 | Esophagus | ESCC | Cellular senescence | 119/4205 | 156/8465 | 5.89e-12 | 9.40e-11 | 4.81e-11 | 119 |
| Page: 1 |
Top |
Cell-cell communication analysis |
| Identification of potential cell-cell interactions between two cell types and their ligand-receptor pairs for different disease states |
| Ligand | Receptor | LRpair | Pathway | Tissue | Disease Stage |
| Page: 1 |
Top |
Single-cell gene regulatory network inference analysis |
| Find out the significant the regulons (TFs) and the target genes of each regulon across cell types for different disease states |
| TF | Cell Type | Tissue | Disease Stage | Target Gene | RSS | Regulon Activity |
| ∗The dot plots of a searched regulon are shown for all cell subpopulations in each disease state of each tissue based on the regulon specific score inferred using pySCENIC and by calculating the average expression. |
| Page: 1 |
Top |
Somatic mutation of malignant transformation related genes |
| Annotation of somatic variants for genes involved in malignant transformation |
| Hugo Symbol | Variant Class | Variant Classification | dbSNP RS | HGVSc | HGVSp | HGVSp Short | SWISSPROT | BIOTYPE | SIFT | PolyPhen | Tumor Sample Barcode | Tissue | Histology | Sex | Age | Stage | Therapy Types | Drugs | Outcome |
| LIN9 | SNV | Missense_Mutation | c.800N>T | p.Thr267Ile | p.T267I | Q5TKA1 | protein_coding | deleterious(0) | possibly_damaging(0.617) | TCGA-A2-A3XX-01 | Breast | breast invasive carcinoma | Female | <65 | I/II | Chemotherapy | cyclophosphamide | CR | |
| LIN9 | SNV | Missense_Mutation | c.452N>G | p.Leu151Arg | p.L151R | Q5TKA1 | protein_coding | deleterious(0) | probably_damaging(0.999) | TCGA-A8-A08F-01 | Breast | breast invasive carcinoma | Female | <65 | III/IV | Chemotherapy | 5-fluorouracil | CR | |
| LIN9 | SNV | Missense_Mutation | novel | c.320N>G | p.Thr107Arg | p.T107R | Q5TKA1 | protein_coding | tolerated(0.49) | benign(0.034) | TCGA-B6-A40C-01 | Breast | breast invasive carcinoma | Female | <65 | I/II | Hormone Therapy | cyclophosphamide | SD |
| LIN9 | deletion | Frame_Shift_Del | c.1418_1424delNNNNNNN | p.Asn473IlefsTer2 | p.N473Ifs*2 | Q5TKA1 | protein_coding | TCGA-AN-A0XN-01 | Breast | breast invasive carcinoma | Female | >=65 | III/IV | Unknown | Unknown | SD | |||
| LIN9 | deletion | Frame_Shift_Del | c.591delT | p.Phe197LeufsTer8 | p.F197Lfs*8 | Q5TKA1 | protein_coding | TCGA-D8-A27V-01 | Breast | breast invasive carcinoma | Female | <65 | I/II | Hormone Therapy | tamoxiphen | SD | |||
| LIN9 | SNV | Missense_Mutation | novel | c.73N>A | p.Asp25Asn | p.D25N | Q5TKA1 | protein_coding | deleterious_low_confidence(0.01) | benign(0.074) | TCGA-C5-A8YQ-01 | Cervix | cervical & endocervical cancer | Female | >=65 | I/II | Chemotherapy | cisplatin | PD |
| LIN9 | SNV | Missense_Mutation | novel | c.1525G>C | p.Asp509His | p.D509H | Q5TKA1 | protein_coding | deleterious(0.02) | possibly_damaging(0.795) | TCGA-EA-A3HU-01 | Cervix | cervical & endocervical cancer | Female | <65 | I/II | Unknown | Unknown | SD |
| LIN9 | SNV | Missense_Mutation | c.691G>A | p.Glu231Lys | p.E231K | Q5TKA1 | protein_coding | tolerated(0.05) | possibly_damaging(0.793) | TCGA-EA-A3QD-01 | Cervix | cervical & endocervical cancer | Female | <65 | III/IV | Chemotherapy | cisplatin | CR | |
| LIN9 | SNV | Missense_Mutation | rs754175670 | c.1542C>G | p.Ile514Met | p.I514M | Q5TKA1 | protein_coding | deleterious(0) | possibly_damaging(0.758) | TCGA-EA-A5ZF-01 | Cervix | cervical & endocervical cancer | Female | <65 | I/II | Unknown | Unknown | PD |
| LIN9 | SNV | Missense_Mutation | rs755213060 | c.739C>T | p.Arg247Cys | p.R247C | Q5TKA1 | protein_coding | deleterious(0) | possibly_damaging(0.817) | TCGA-EK-A2R9-01 | Cervix | cervical & endocervical cancer | Female | <65 | I/II | Unknown | Unknown | SD |
| Page: 1 2 3 4 5 6 7 8 |
Top |
Related drugs of malignant transformation related genes |
| Identification of chemicals and drugs interact with genes involved in malignant transfromation |
| (DGIdb 4.0) |
| Entrez ID | Symbol | Category | Interaction Types | Drug Claim Name | Drug Name | PMIDs |
| Page: 1 |

Copyright 2023-Present -The University of Texas Health Science Center at Houston |