
|
|||||
|
 | |
| |
| |
| |
| |
| |
|
Gene: LIN7C |
Gene summary for LIN7C |
| Gene information | Species | Human | Gene symbol | LIN7C | Gene ID | 55327 |
| Gene name | lin-7 homolog C, crumbs cell polarity complex component | |
| Gene Alias | LIN-7-C | |
| Cytomap | 11p14.1 | |
| Gene Type | protein-coding | GO ID | GO:0001505 | UniProtAcc | Q9NUP9 |
Top |
Malignant transformation analysis |
| Identification of the aberrant gene expression in precancerous and cancerous lesions by comparing the gene expression of stem-like cells in diseased tissues with normal stem cells |
| Entrez ID | Symbol | Replicates | Species | Organ | Tissue | Adj P-value | Log2FC | Malignancy |
| 55327 | LIN7C | HTA11_1938_2000001011 | Human | Colorectum | AD | 8.01e-06 | 3.41e-01 | -0.0811 |
| 55327 | LIN7C | HTA11_347_2000001011 | Human | Colorectum | AD | 1.03e-14 | 4.30e-01 | -0.1954 |
| 55327 | LIN7C | HTA11_1391_2000001011 | Human | Colorectum | AD | 7.67e-05 | 2.38e-01 | -0.059 |
| 55327 | LIN7C | HTA11_7862_2000001011 | Human | Colorectum | AD | 1.38e-06 | 4.11e-01 | -0.0179 |
| 55327 | LIN7C | HTA11_866_3004761011 | Human | Colorectum | AD | 2.55e-03 | 2.01e-01 | 0.096 |
| 55327 | LIN7C | HTA11_6801_2000001011 | Human | Colorectum | SER | 2.86e-02 | 4.76e-01 | 0.0171 |
| 55327 | LIN7C | HTA11_99999970781_79442 | Human | Colorectum | MSS | 1.32e-10 | 4.13e-01 | 0.294 |
| 55327 | LIN7C | HTA11_99999965104_69814 | Human | Colorectum | MSS | 6.21e-05 | 3.18e-01 | 0.281 |
| 55327 | LIN7C | HTA11_99999971662_82457 | Human | Colorectum | MSS | 4.98e-04 | 3.25e-01 | 0.3859 |
| 55327 | LIN7C | LZE4T | Human | Esophagus | ESCC | 1.02e-09 | 2.48e-01 | 0.0811 |
| 55327 | LIN7C | LZE5T | Human | Esophagus | ESCC | 6.77e-03 | 2.65e-01 | 0.0514 |
| 55327 | LIN7C | LZE7T | Human | Esophagus | ESCC | 3.01e-05 | 2.81e-01 | 0.0667 |
| 55327 | LIN7C | LZE24T | Human | Esophagus | ESCC | 5.74e-17 | 2.36e-01 | 0.0596 |
| 55327 | LIN7C | P1T-E | Human | Esophagus | ESCC | 1.71e-05 | 1.28e-01 | 0.0875 |
| 55327 | LIN7C | P2T-E | Human | Esophagus | ESCC | 2.46e-12 | 1.67e-01 | 0.1177 |
| 55327 | LIN7C | P4T-E | Human | Esophagus | ESCC | 8.52e-20 | 2.88e-01 | 0.1323 |
| 55327 | LIN7C | P5T-E | Human | Esophagus | ESCC | 2.62e-17 | 1.06e-01 | 0.1327 |
| 55327 | LIN7C | P8T-E | Human | Esophagus | ESCC | 5.13e-10 | 1.21e-01 | 0.0889 |
| 55327 | LIN7C | P9T-E | Human | Esophagus | ESCC | 4.71e-09 | 1.65e-01 | 0.1131 |
| 55327 | LIN7C | P10T-E | Human | Esophagus | ESCC | 3.86e-19 | 3.38e-01 | 0.116 |
| Page: 1 2 3 4 5 6 |
| Tissue | Expression Dynamics | Abbreviation |
| Colorectum (GSE201348) |  | FAP: Familial adenomatous polyposis |
| CRC: Colorectal cancer | ||
| Colorectum (HTA11) |  | AD: Adenomas |
| SER: Sessile serrated lesions | ||
| MSI-H: Microsatellite-high colorectal cancer | ||
| MSS: Microsatellite stable colorectal cancer | ||
| Esophagus |  | ESCC: Esophageal squamous cell carcinoma |
| HGIN: High-grade intraepithelial neoplasias | ||
| LGIN: Low-grade intraepithelial neoplasias | ||
| Liver | 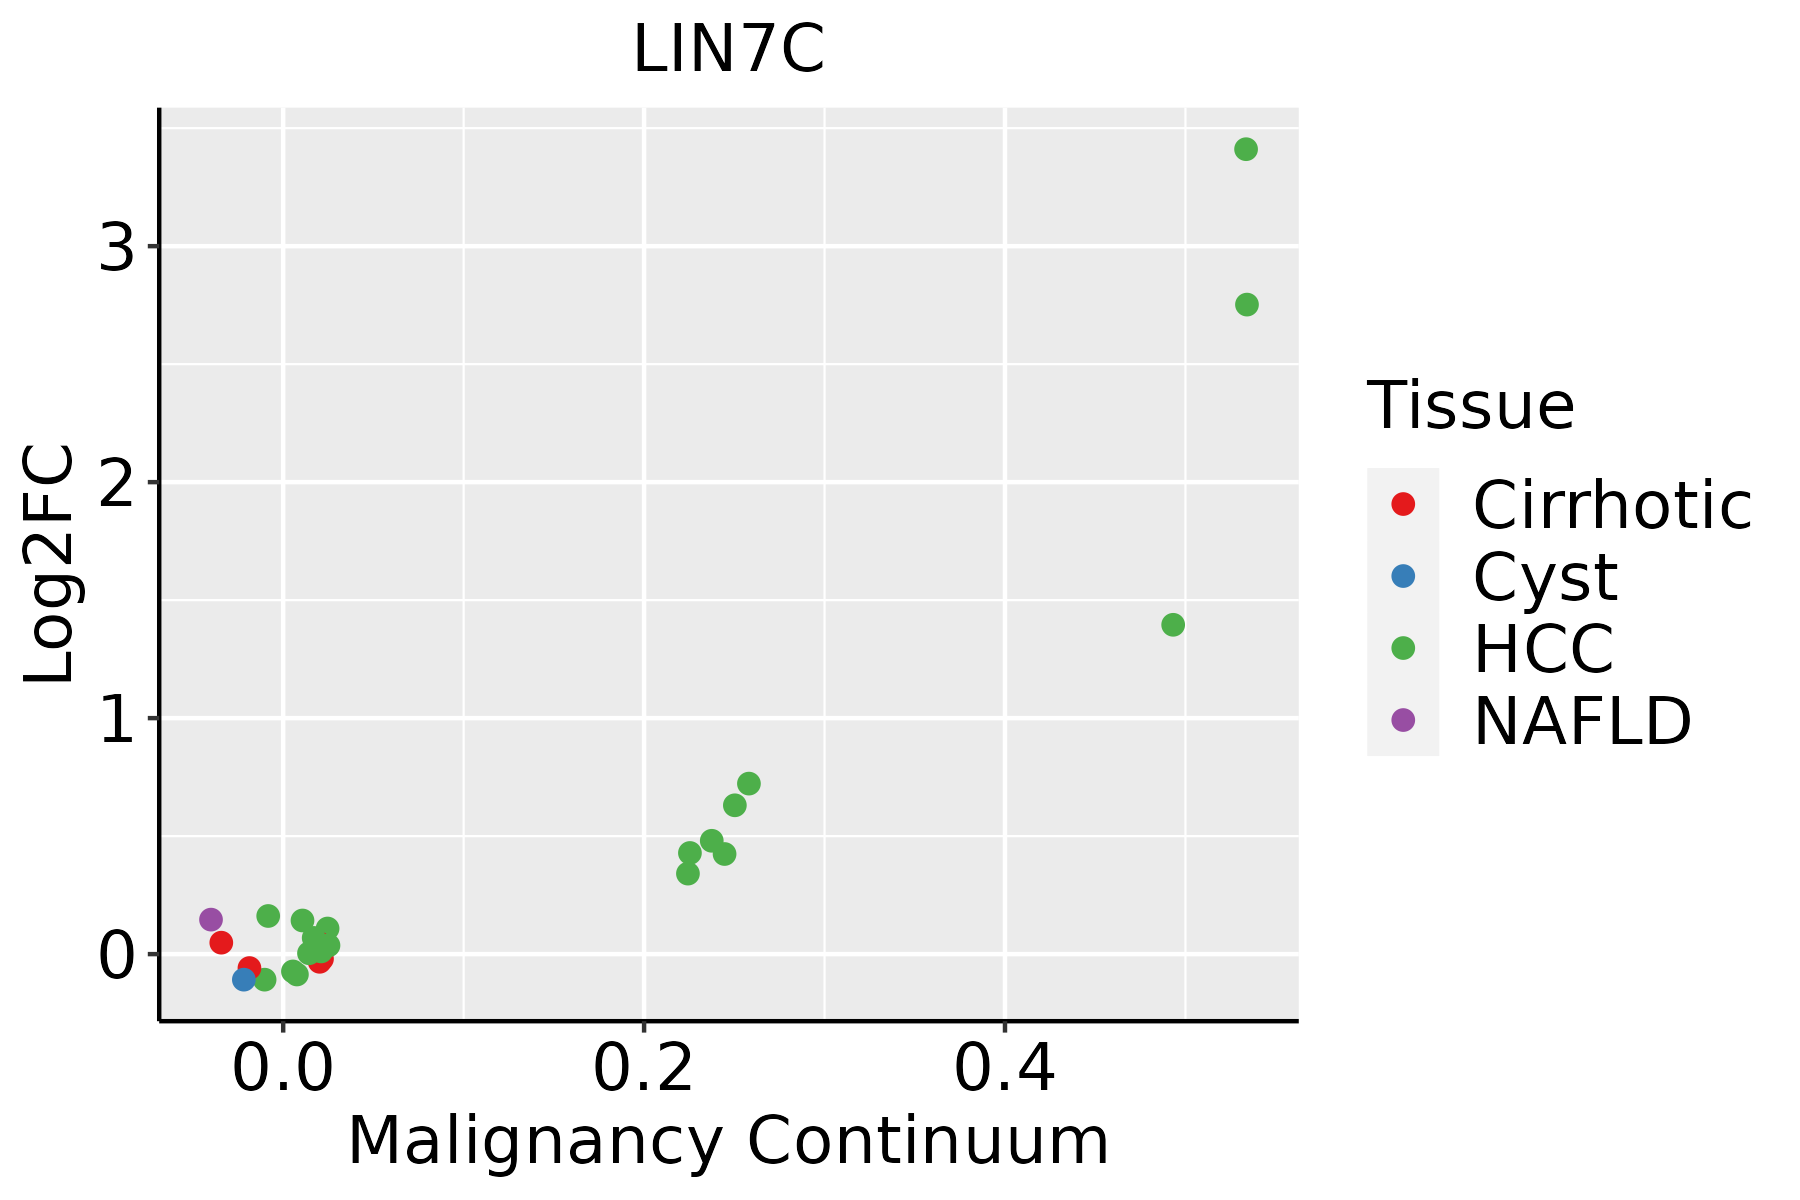 | HCC: Hepatocellular carcinoma |
| NAFLD: Non-alcoholic fatty liver disease | ||
| Oral Cavity | 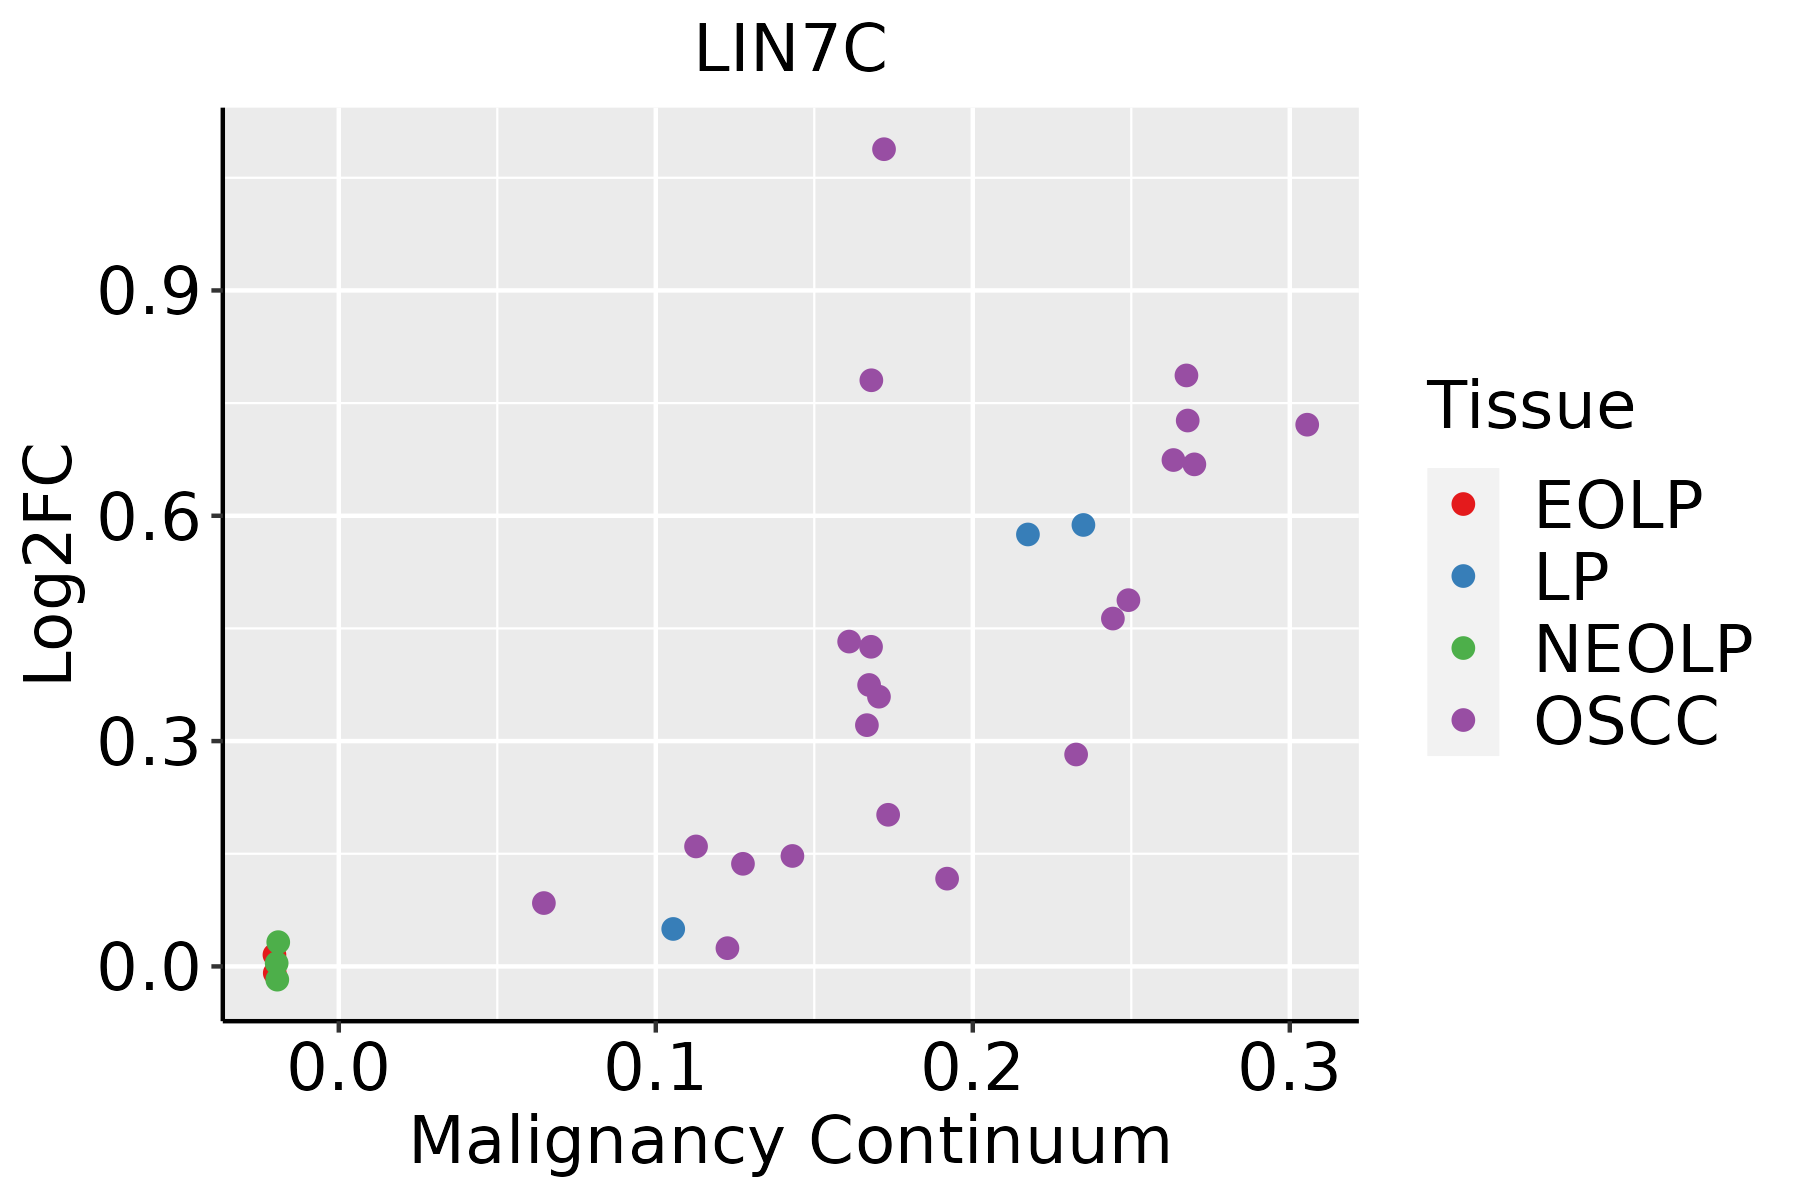 | EOLP: Erosive Oral lichen planus |
| LP: leukoplakia | ||
| NEOLP: Non-erosive oral lichen planus | ||
| OSCC: Oral squamous cell carcinoma | ||
| Skin | 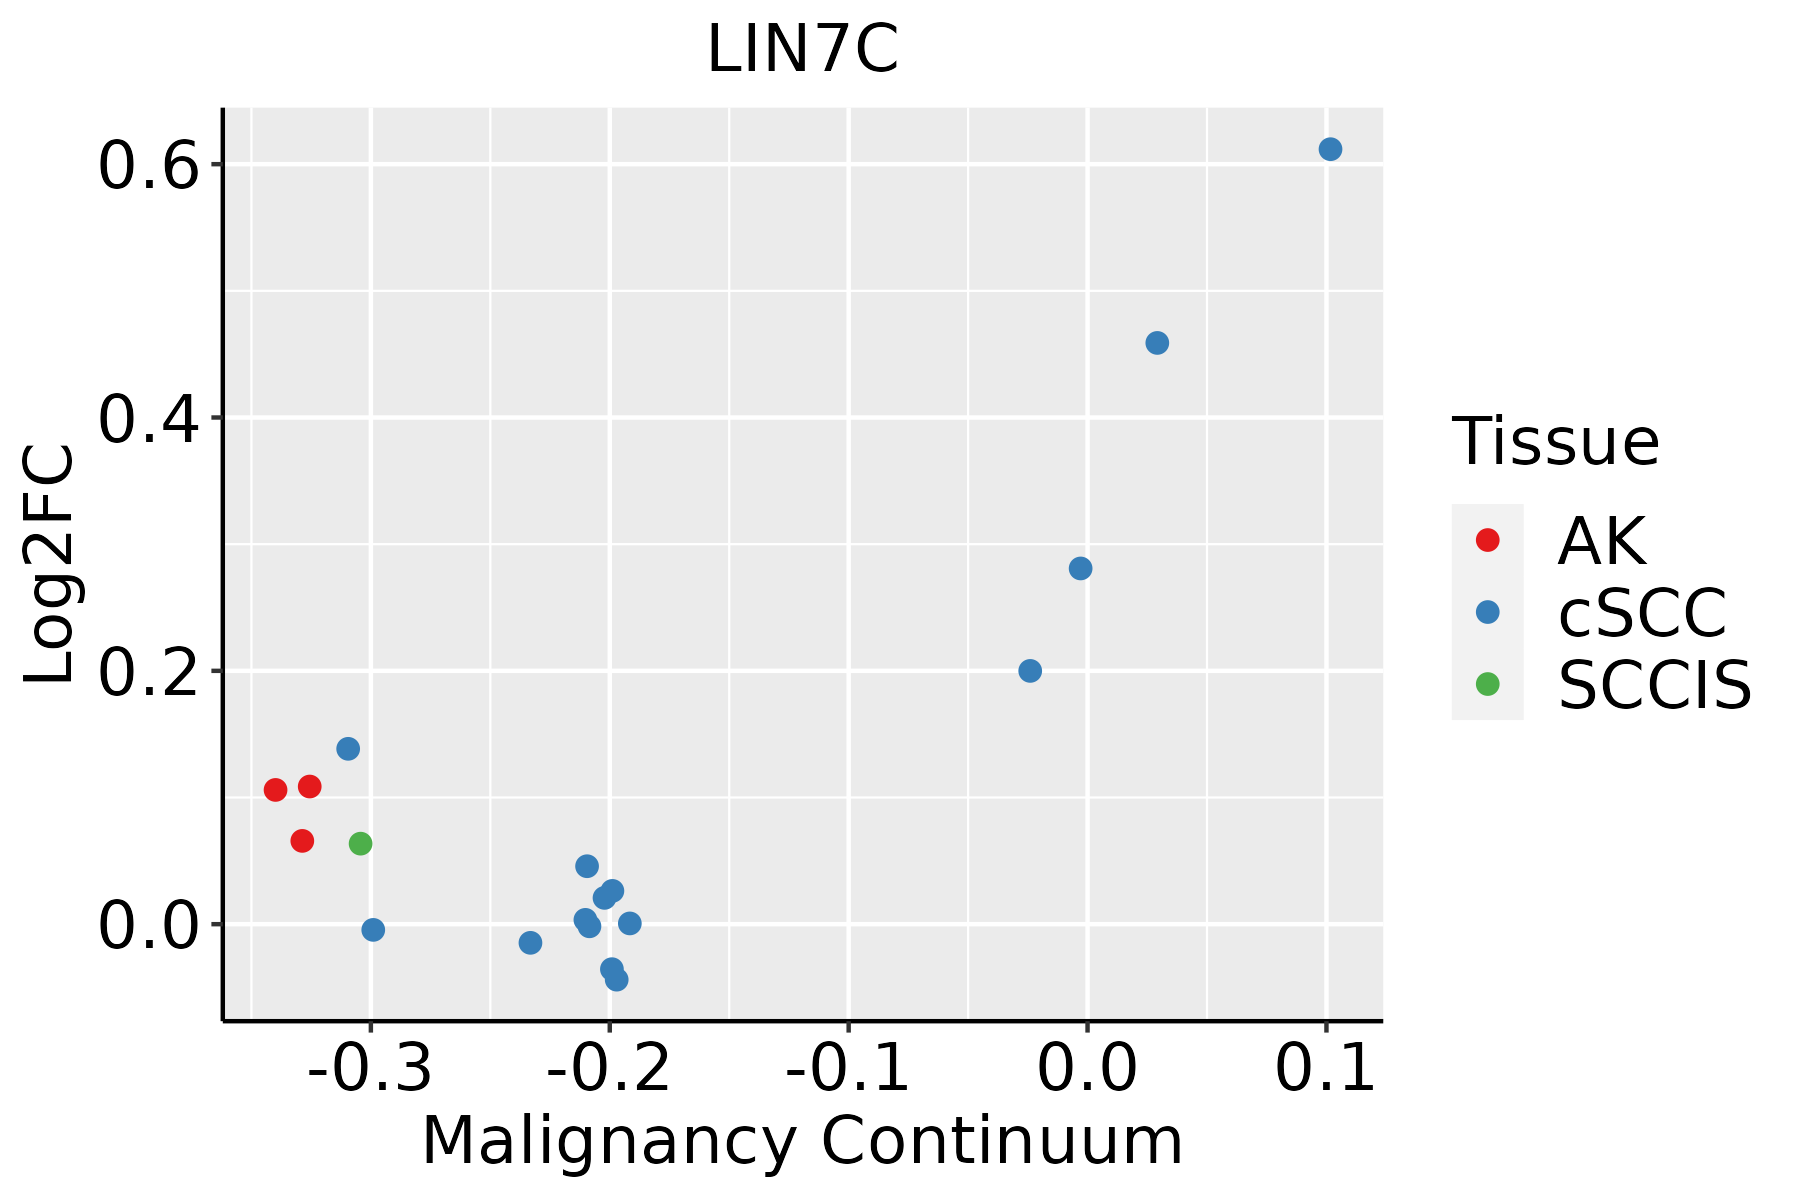 | AK: Actinic keratosis |
| cSCC: Cutaneous squamous cell carcinoma | ||
| SCCIS:squamous cell carcinoma in situ | ||
| Thyroid | 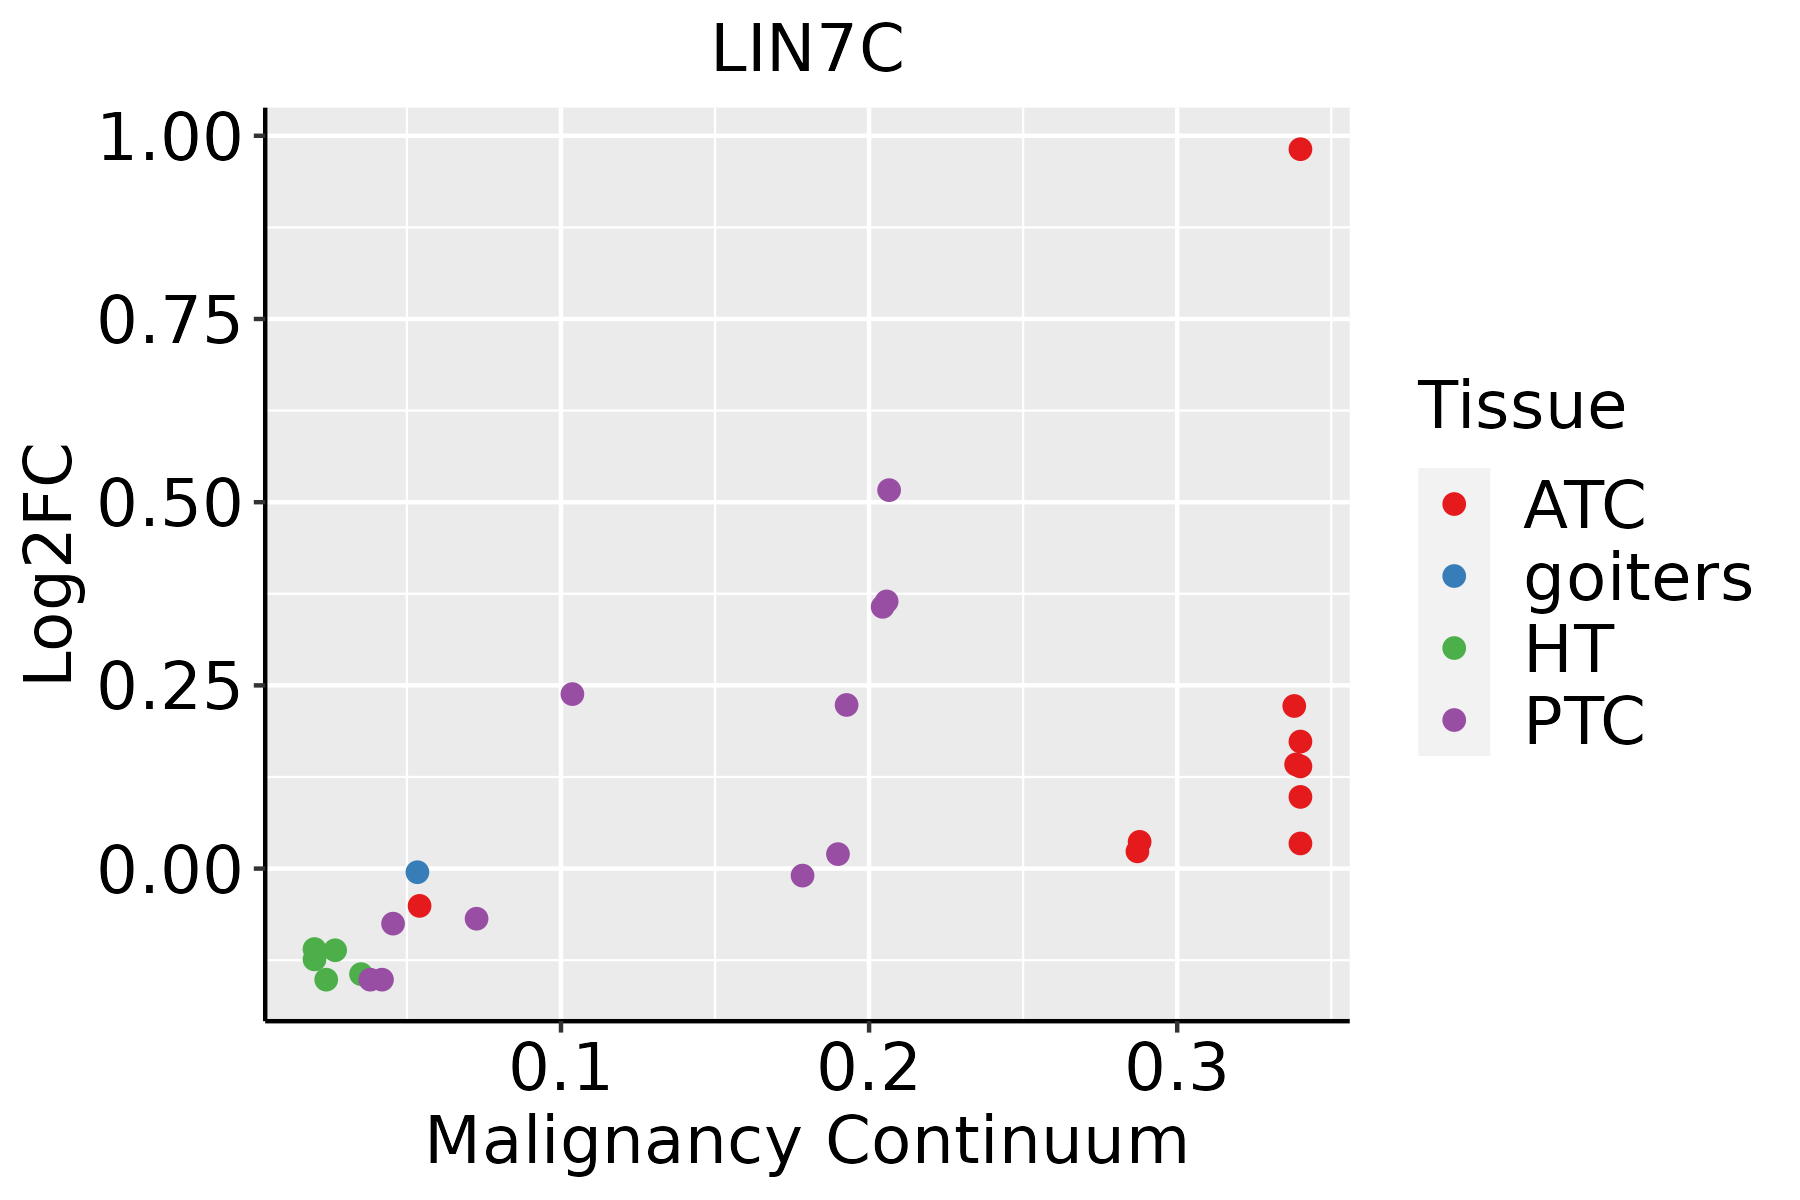 | ATC: Anaplastic thyroid cancer |
| HT: Hashimoto's thyroiditis | ||
| PTC: Papillary thyroid cancer |
| ∗log2FC in expression of this searched gene in stem-like cells from each diseased tissue sample relative to stem-like cells in normal samples in each tissue plotted against the malignancy continuum. Samples are colored based on if they are from different disease stage. |
Top |
Malignant transformation related pathway analysis |
| Find out the enriched GO biological processes and KEGG pathways involved in transition from healthy to precancer to cancer |
| Tissue | Disease Stage | Enriched GO biological Processes |
| Colorectum | AD |  |
| Colorectum | SER |  |
| Colorectum | MSS |  |
| Colorectum | MSI-H |  |
| Colorectum | FAP |  |
| ∗Top 15 enriched GO BP terms are showed in the bar plot of each disease state in each tissue. Each row represents a significant GO biological process which is colored according to the -log10(p.adjust). |
| Page: 1 2 3 4 5 6 7 8 9 |
| GO ID | Tissue | Disease Stage | Description | Gene Ratio | Bg Ratio | pvalue | p.adjust | Count |
| GO:1990778 | Colorectum | AD | protein localization to cell periphery | 129/3918 | 333/18723 | 5.51e-14 | 1.15e-11 | 129 |
| GO:0007163 | Colorectum | AD | establishment or maintenance of cell polarity | 77/3918 | 218/18723 | 5.72e-07 | 2.08e-05 | 77 |
| GO:0045197 | Colorectum | AD | establishment or maintenance of epithelial cell apical/basal polarity | 20/3918 | 44/18723 | 2.26e-04 | 2.94e-03 | 20 |
| GO:0035088 | Colorectum | AD | establishment or maintenance of apical/basal cell polarity | 21/3918 | 49/18723 | 4.31e-04 | 4.82e-03 | 21 |
| GO:0061245 | Colorectum | AD | establishment or maintenance of bipolar cell polarity | 21/3918 | 49/18723 | 4.31e-04 | 4.82e-03 | 21 |
| GO:0006887 | Colorectum | AD | exocytosis | 96/3918 | 352/18723 | 2.48e-03 | 1.90e-02 | 96 |
| GO:19907781 | Colorectum | SER | protein localization to cell periphery | 98/2897 | 333/18723 | 6.09e-11 | 9.57e-09 | 98 |
| GO:00071631 | Colorectum | SER | establishment or maintenance of cell polarity | 60/2897 | 218/18723 | 3.45e-06 | 1.33e-04 | 60 |
| GO:00451971 | Colorectum | SER | establishment or maintenance of epithelial cell apical/basal polarity | 16/2897 | 44/18723 | 5.64e-04 | 7.83e-03 | 16 |
| GO:00350881 | Colorectum | SER | establishment or maintenance of apical/basal cell polarity | 17/2897 | 49/18723 | 7.17e-04 | 9.44e-03 | 17 |
| GO:00612451 | Colorectum | SER | establishment or maintenance of bipolar cell polarity | 17/2897 | 49/18723 | 7.17e-04 | 9.44e-03 | 17 |
| GO:00068871 | Colorectum | SER | exocytosis | 75/2897 | 352/18723 | 2.05e-03 | 2.03e-02 | 75 |
| GO:0030011 | Colorectum | SER | maintenance of cell polarity | 8/2897 | 19/18723 | 4.95e-03 | 3.84e-02 | 8 |
| GO:19907782 | Colorectum | MSS | protein localization to cell periphery | 120/3467 | 333/18723 | 2.02e-14 | 5.47e-12 | 120 |
| GO:00071632 | Colorectum | MSS | establishment or maintenance of cell polarity | 72/3467 | 218/18723 | 1.90e-07 | 8.30e-06 | 72 |
| GO:00451972 | Colorectum | MSS | establishment or maintenance of epithelial cell apical/basal polarity | 19/3467 | 44/18723 | 1.38e-04 | 2.06e-03 | 19 |
| GO:00350882 | Colorectum | MSS | establishment or maintenance of apical/basal cell polarity | 20/3467 | 49/18723 | 2.36e-04 | 3.24e-03 | 20 |
| GO:00612452 | Colorectum | MSS | establishment or maintenance of bipolar cell polarity | 20/3467 | 49/18723 | 2.36e-04 | 3.24e-03 | 20 |
| GO:199077819 | Esophagus | ESCC | protein localization to cell periphery | 217/8552 | 333/18723 | 4.08e-13 | 1.88e-11 | 217 |
| GO:000716320 | Esophagus | ESCC | establishment or maintenance of cell polarity | 143/8552 | 218/18723 | 2.05e-09 | 4.65e-08 | 143 |
| Page: 1 2 3 |
| Pathway ID | Tissue | Disease Stage | Description | Gene Ratio | Bg Ratio | pvalue | p.adjust | qvalue | Count |
| Page: 1 |
Top |
Cell-cell communication analysis |
| Identification of potential cell-cell interactions between two cell types and their ligand-receptor pairs for different disease states |
| Ligand | Receptor | LRpair | Pathway | Tissue | Disease Stage |
| Page: 1 |
Top |
Single-cell gene regulatory network inference analysis |
| Find out the significant the regulons (TFs) and the target genes of each regulon across cell types for different disease states |
| TF | Cell Type | Tissue | Disease Stage | Target Gene | RSS | Regulon Activity |
| ∗The dot plots of a searched regulon are shown for all cell subpopulations in each disease state of each tissue based on the regulon specific score inferred using pySCENIC and by calculating the average expression. |
| Page: 1 |
Top |
Somatic mutation of malignant transformation related genes |
| Annotation of somatic variants for genes involved in malignant transformation |
| Hugo Symbol | Variant Class | Variant Classification | dbSNP RS | HGVSc | HGVSp | HGVSp Short | SWISSPROT | BIOTYPE | SIFT | PolyPhen | Tumor Sample Barcode | Tissue | Histology | Sex | Age | Stage | Therapy Types | Drugs | Outcome |
| LIN7C | SNV | Missense_Mutation | c.385N>C | p.Asp129His | p.D129H | Q9NUP9 | protein_coding | deleterious(0.02) | benign(0.151) | TCGA-EK-A2RN-01 | Cervix | cervical & endocervical cancer | Female | <65 | I/II | Unknown | Unknown | SD | |
| LIN7C | SNV | Missense_Mutation | c.392N>G | p.His131Arg | p.H131R | Q9NUP9 | protein_coding | deleterious(0.03) | benign(0.148) | TCGA-AA-3663-01 | Colorectum | colon adenocarcinoma | Male | <65 | I/II | Unknown | Unknown | SD | |
| LIN7C | SNV | Missense_Mutation | c.564N>T | p.Met188Ile | p.M188I | Q9NUP9 | protein_coding | tolerated(0.07) | benign(0.001) | TCGA-F4-6703-01 | Colorectum | colon adenocarcinoma | Male | <65 | I/II | Unknown | Unknown | SD | |
| LIN7C | SNV | Missense_Mutation | novel | c.199N>T | p.Pro67Ser | p.P67S | Q9NUP9 | protein_coding | deleterious(0.01) | benign(0.297) | TCGA-AG-3726-01 | Colorectum | rectum adenocarcinoma | Female | <65 | I/II | Unknown | Unknown | SD |
| LIN7C | SNV | Missense_Mutation | novel | c.320T>G | p.Ile107Ser | p.I107S | Q9NUP9 | protein_coding | deleterious(0) | possibly_damaging(0.597) | TCGA-F5-6814-01 | Colorectum | rectum adenocarcinoma | Male | <65 | I/II | Unknown | Unknown | SD |
| LIN7C | SNV | Missense_Mutation | c.280G>C | p.Val94Leu | p.V94L | Q9NUP9 | protein_coding | deleterious(0) | possibly_damaging(0.612) | TCGA-AP-A0LM-01 | Endometrium | uterine corpus endometrioid carcinoma | Female | <65 | III/IV | Chemotherapy | cisplatin | SD | |
| LIN7C | SNV | Missense_Mutation | novel | c.524N>T | p.Pro175Leu | p.P175L | Q9NUP9 | protein_coding | deleterious(0.04) | probably_damaging(1) | TCGA-B5-A3FA-01 | Endometrium | uterine corpus endometrioid carcinoma | Female | >=65 | I/II | Unknown | Unknown | SD |
| LIN7C | SNV | Missense_Mutation | rs777986916 | c.232N>G | p.Thr78Ala | p.T78A | Q9NUP9 | protein_coding | deleterious(0.01) | probably_damaging(0.998) | TCGA-B5-A3FA-01 | Endometrium | uterine corpus endometrioid carcinoma | Female | >=65 | I/II | Unknown | Unknown | SD |
| LIN7C | SNV | Missense_Mutation | rs539932524 | c.577N>T | p.Arg193Cys | p.R193C | Q9NUP9 | protein_coding | tolerated_low_confidence(0.05) | benign(0.028) | TCGA-BG-A222-01 | Endometrium | uterine corpus endometrioid carcinoma | Female | <65 | I/II | Unknown | Unknown | SD |
| LIN7C | SNV | Missense_Mutation | c.130N>C | p.Ser44Arg | p.S44R | Q9NUP9 | protein_coding | deleterious(0.01) | probably_damaging(1) | TCGA-BS-A0UF-01 | Endometrium | uterine corpus endometrioid carcinoma | Female | >=65 | I/II | Unknown | Unknown | SD |
| Page: 1 2 3 |
Top |
Related drugs of malignant transformation related genes |
| Identification of chemicals and drugs interact with genes involved in malignant transfromation |
| (DGIdb 4.0) |
| Entrez ID | Symbol | Category | Interaction Types | Drug Claim Name | Drug Name | PMIDs |
| Page: 1 |

Copyright 2023-Present -The University of Texas Health Science Center at Houston |