
|
|||||
|
 | |
| |
| |
| |
| |
| |
|
Gene: LIN7A |
Gene summary for LIN7A |
| Gene information | Species | Human | Gene symbol | LIN7A | Gene ID | 8825 |
| Gene name | lin-7 homolog A, crumbs cell polarity complex component | |
| Gene Alias | LIN-7A | |
| Cytomap | 12q21.31 | |
| Gene Type | protein-coding | GO ID | GO:0001505 | UniProtAcc | O14910 |
Top |
Malignant transformation analysis |
| Identification of the aberrant gene expression in precancerous and cancerous lesions by comparing the gene expression of stem-like cells in diseased tissues with normal stem cells |
| Entrez ID | Symbol | Replicates | Species | Organ | Tissue | Adj P-value | Log2FC | Malignancy |
| 8825 | LIN7A | NAFLD1 | Human | Liver | NAFLD | 6.72e-04 | 6.60e-01 | -0.04 |
| 8825 | LIN7A | HCC1_Meng | Human | Liver | HCC | 4.18e-54 | 8.70e-03 | 0.0246 |
| 8825 | LIN7A | HCC2_Meng | Human | Liver | HCC | 2.05e-03 | -1.36e-01 | 0.0107 |
| 8825 | LIN7A | HCC1 | Human | Liver | HCC | 4.10e-09 | 4.17e+00 | 0.5336 |
| 8825 | LIN7A | HCC2 | Human | Liver | HCC | 2.51e-06 | 3.94e+00 | 0.5341 |
| 8825 | LIN7A | S014 | Human | Liver | HCC | 4.71e-20 | 9.77e-01 | 0.2254 |
| 8825 | LIN7A | S015 | Human | Liver | HCC | 2.84e-05 | 4.86e-01 | 0.2375 |
| 8825 | LIN7A | S016 | Human | Liver | HCC | 2.40e-26 | 9.90e-01 | 0.2243 |
| Page: 1 |
| Tissue | Expression Dynamics | Abbreviation |
| Liver | 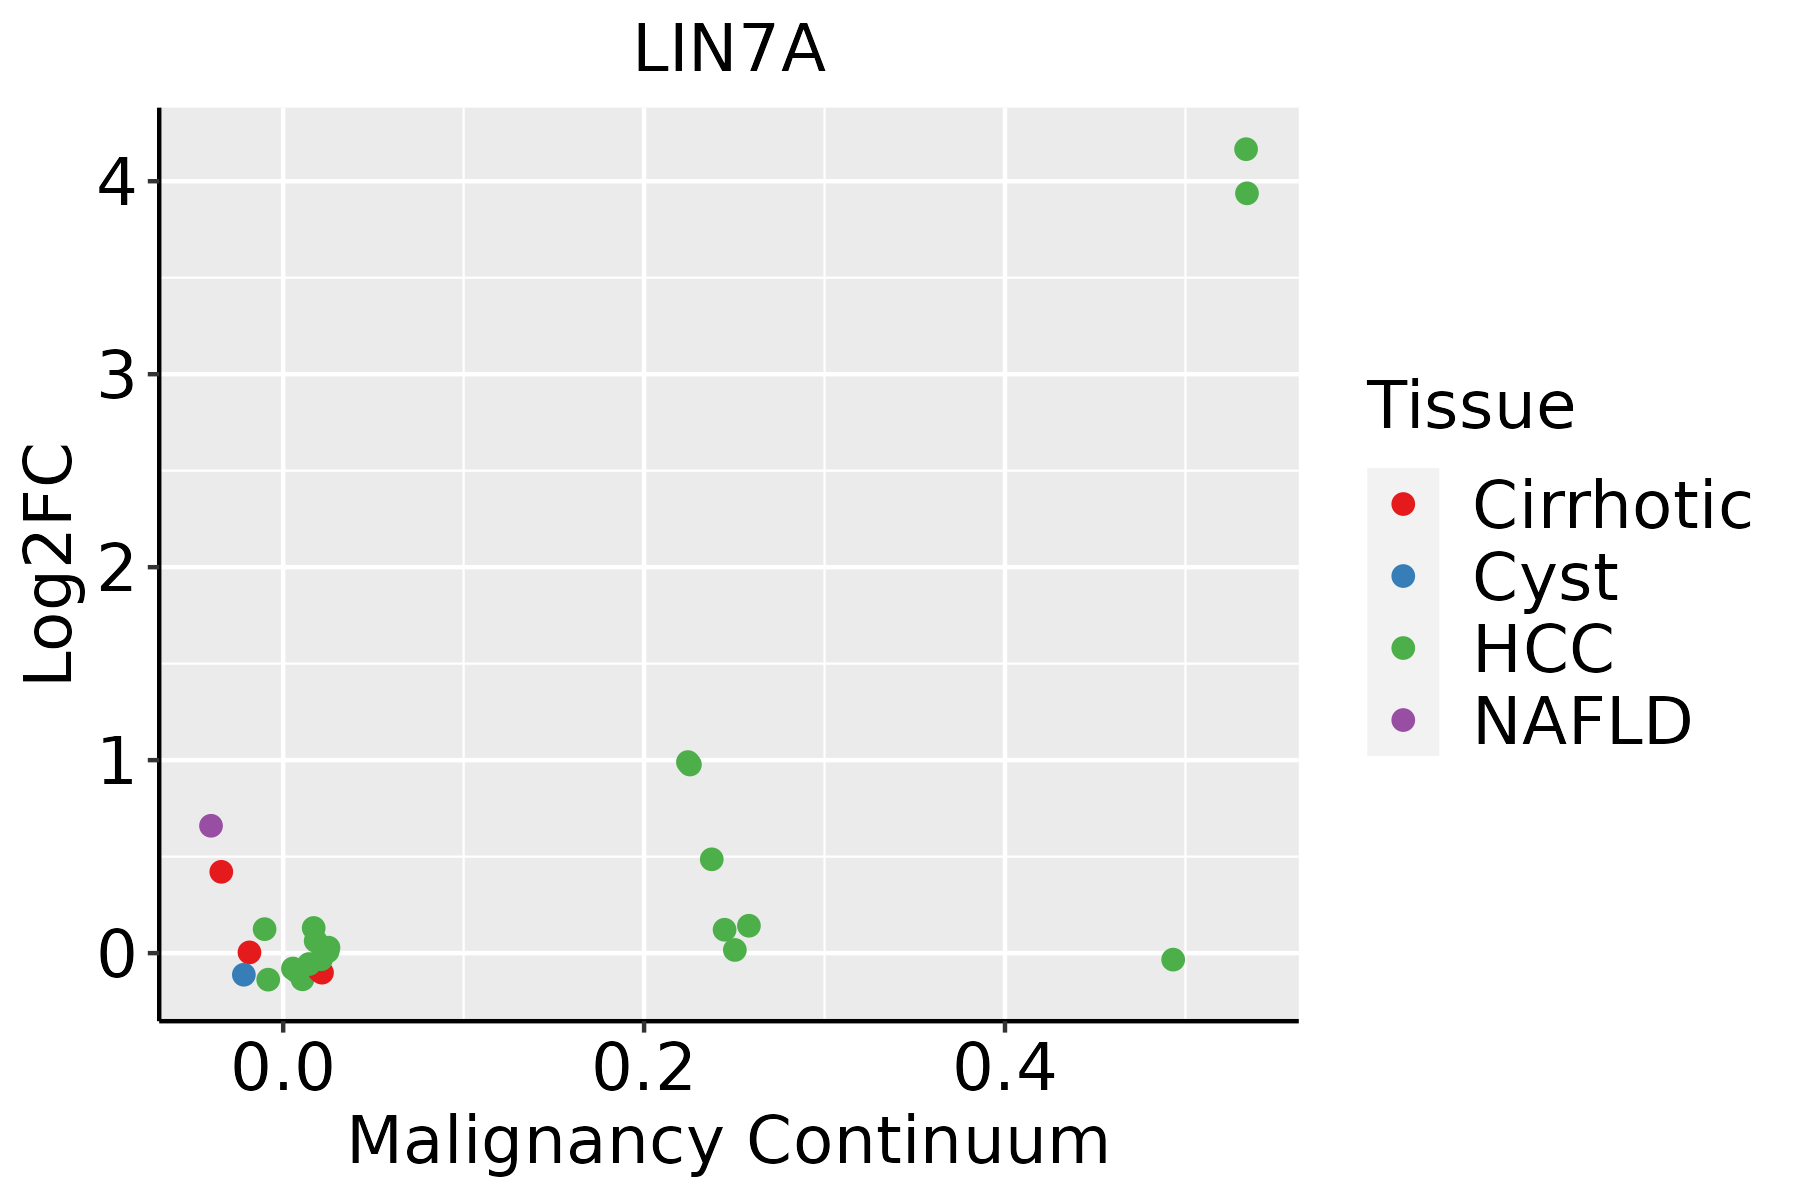 | HCC: Hepatocellular carcinoma |
| NAFLD: Non-alcoholic fatty liver disease |
| ∗log2FC in expression of this searched gene in stem-like cells from each diseased tissue sample relative to stem-like cells in normal samples in each tissue plotted against the malignancy continuum. Samples are colored based on if they are from different disease stage. |
Top |
Malignant transformation related pathway analysis |
| Find out the enriched GO biological processes and KEGG pathways involved in transition from healthy to precancer to cancer |
| Tissue | Disease Stage | Enriched GO biological Processes |
| Colorectum | AD |  |
| Colorectum | SER |  |
| Colorectum | MSS |  |
| Colorectum | MSI-H |  |
| Colorectum | FAP |  |
| ∗Top 15 enriched GO BP terms are showed in the bar plot of each disease state in each tissue. Each row represents a significant GO biological process which is colored according to the -log10(p.adjust). |
| Page: 1 2 3 4 5 6 7 8 9 |
| GO ID | Tissue | Disease Stage | Description | Gene Ratio | Bg Ratio | pvalue | p.adjust | Count |
| GO:00071636 | Liver | NAFLD | establishment or maintenance of cell polarity | 46/1882 | 218/18723 | 8.80e-07 | 4.60e-05 | 46 |
| GO:19907786 | Liver | NAFLD | protein localization to cell periphery | 56/1882 | 333/18723 | 8.29e-05 | 1.69e-03 | 56 |
| GO:00516565 | Liver | NAFLD | establishment of organelle localization | 57/1882 | 390/18723 | 2.52e-03 | 2.34e-02 | 57 |
| GO:00516485 | Liver | NAFLD | vesicle localization | 30/1882 | 177/18723 | 3.01e-03 | 2.72e-02 | 30 |
| GO:00516505 | Liver | NAFLD | establishment of vesicle localization | 27/1882 | 161/18723 | 5.47e-03 | 4.20e-02 | 27 |
| GO:199077821 | Liver | HCC | protein localization to cell periphery | 200/7958 | 333/18723 | 6.07e-11 | 2.23e-09 | 200 |
| GO:005165621 | Liver | HCC | establishment of organelle localization | 226/7958 | 390/18723 | 4.15e-10 | 1.34e-08 | 226 |
| GO:000716322 | Liver | HCC | establishment or maintenance of cell polarity | 133/7958 | 218/18723 | 2.48e-08 | 5.73e-07 | 133 |
| GO:005165021 | Liver | HCC | establishment of vesicle localization | 103/7958 | 161/18723 | 2.94e-08 | 6.69e-07 | 103 |
| GO:005164821 | Liver | HCC | vesicle localization | 107/7958 | 177/18723 | 1.05e-06 | 1.57e-05 | 107 |
| GO:0048489 | Liver | HCC | synaptic vesicle transport | 27/7958 | 42/18723 | 3.60e-03 | 1.60e-02 | 27 |
| Page: 1 |
| Pathway ID | Tissue | Disease Stage | Description | Gene Ratio | Bg Ratio | pvalue | p.adjust | qvalue | Count |
| Page: 1 |
Top |
Cell-cell communication analysis |
| Identification of potential cell-cell interactions between two cell types and their ligand-receptor pairs for different disease states |
| Ligand | Receptor | LRpair | Pathway | Tissue | Disease Stage |
| Page: 1 |
Top |
Single-cell gene regulatory network inference analysis |
| Find out the significant the regulons (TFs) and the target genes of each regulon across cell types for different disease states |
| TF | Cell Type | Tissue | Disease Stage | Target Gene | RSS | Regulon Activity |
| ∗The dot plots of a searched regulon are shown for all cell subpopulations in each disease state of each tissue based on the regulon specific score inferred using pySCENIC and by calculating the average expression. |
| Page: 1 |
Top |
Somatic mutation of malignant transformation related genes |
| Annotation of somatic variants for genes involved in malignant transformation |
| Hugo Symbol | Variant Class | Variant Classification | dbSNP RS | HGVSc | HGVSp | HGVSp Short | SWISSPROT | BIOTYPE | SIFT | PolyPhen | Tumor Sample Barcode | Tissue | Histology | Sex | Age | Stage | Therapy Types | Drugs | Outcome |
| LIN7A | SNV | Missense_Mutation | rs764330673 | c.257N>T | p.Ala86Val | p.A86V | O14910 | protein_coding | deleterious(0.01) | possibly_damaging(0.877) | TCGA-BH-A0RX-01 | Breast | breast invasive carcinoma | Female | <65 | I/II | Chemotherapy | fluorouracil | SD |
| LIN7A | SNV | Missense_Mutation | c.507N>C | p.Glu169Asp | p.E169D | O14910 | protein_coding | deleterious(0) | possibly_damaging(0.614) | TCGA-D8-A27G-01 | Breast | breast invasive carcinoma | Female | >=65 | I/II | Unknown | Unknown | SD | |
| LIN7A | insertion | In_Frame_Ins | novel | c.285_286insATATCCATCAAT | p.Ala95_Ala96insIleSerIleAsn | p.A95_A96insISIN | O14910 | protein_coding | TCGA-AR-A0U0-01 | Breast | breast invasive carcinoma | Female | >=65 | I/II | Unknown | Unknown | SD | ||
| LIN7A | SNV | Missense_Mutation | c.39C>G | p.Asp13Glu | p.D13E | O14910 | protein_coding | tolerated_low_confidence(0.7) | benign(0) | TCGA-C5-A7CJ-01 | Cervix | cervical & endocervical cancer | Female | <65 | I/II | Chemotherapy | cisplatin | SD | |
| LIN7A | SNV | Missense_Mutation | rs201514763 | c.197N>A | p.Arg66Gln | p.R66Q | O14910 | protein_coding | deleterious(0.01) | probably_damaging(0.986) | TCGA-MY-A913-01 | Cervix | cervical & endocervical cancer | Female | <65 | I/II | Chemotherapy | cisplatin | CR |
| LIN7A | SNV | Missense_Mutation | c.573N>C | p.Lys191Asn | p.K191N | O14910 | protein_coding | deleterious(0.02) | possibly_damaging(0.71) | TCGA-AA-3977-01 | Colorectum | colon adenocarcinoma | Male | >=65 | I/II | Unknown | Unknown | SD | |
| LIN7A | SNV | Missense_Mutation | novel | c.280N>A | p.Val94Ile | p.V94I | O14910 | protein_coding | deleterious(0.05) | benign(0.255) | TCGA-CK-5914-01 | Colorectum | colon adenocarcinoma | Male | >=65 | III/IV | Unknown | Unknown | SD |
| LIN7A | SNV | Missense_Mutation | c.132N>C | p.Glu44Asp | p.E44D | O14910 | protein_coding | tolerated(0.28) | benign(0.02) | TCGA-D5-6931-01 | Colorectum | colon adenocarcinoma | Male | >=65 | III/IV | Unknown | Unknown | SD | |
| LIN7A | insertion | Frame_Shift_Ins | novel | c.424_425insG | p.Val142GlyfsTer3 | p.V142Gfs*3 | O14910 | protein_coding | TCGA-WS-AB45-01 | Colorectum | colon adenocarcinoma | Female | <65 | I/II | Unknown | Unknown | SD | ||
| LIN7A | SNV | Missense_Mutation | novel | c.230C>A | p.Thr77Asn | p.T77N | O14910 | protein_coding | tolerated(0.07) | benign(0.021) | TCGA-A5-A0G2-01 | Endometrium | uterine corpus endometrioid carcinoma | Female | <65 | III/IV | Unknown | Unknown | SD |
| Page: 1 2 3 4 5 6 7 |
Top |
Related drugs of malignant transformation related genes |
| Identification of chemicals and drugs interact with genes involved in malignant transfromation |
| (DGIdb 4.0) |
| Entrez ID | Symbol | Category | Interaction Types | Drug Claim Name | Drug Name | PMIDs |
| Page: 1 |

Copyright 2023-Present -The University of Texas Health Science Center at Houston |