
|
|||||
|
 | |
| |
| |
| |
| |
| |
|
Gene: LIMS2 |
Gene summary for LIMS2 |
| Gene information | Species | Human | Gene symbol | LIMS2 | Gene ID | 55679 |
| Gene name | LIM zinc finger domain containing 2 | |
| Gene Alias | LGMD2W | |
| Cytomap | 2q14.3 | |
| Gene Type | protein-coding | GO ID | GO:0000902 | UniProtAcc | B3KNZ3 |
Top |
Malignant transformation analysis |
| Identification of the aberrant gene expression in precancerous and cancerous lesions by comparing the gene expression of stem-like cells in diseased tissues with normal stem cells |
| Entrez ID | Symbol | Replicates | Species | Organ | Tissue | Adj P-value | Log2FC | Malignancy |
| 55679 | LIMS2 | P4T-E | Human | Esophagus | ESCC | 1.41e-05 | 2.12e-01 | 0.1323 |
| 55679 | LIMS2 | P5T-E | Human | Esophagus | ESCC | 6.08e-14 | 3.05e-01 | 0.1327 |
| 55679 | LIMS2 | P11T-E | Human | Esophagus | ESCC | 4.18e-03 | 2.76e-01 | 0.1426 |
| 55679 | LIMS2 | P12T-E | Human | Esophagus | ESCC | 1.91e-02 | 1.22e-01 | 0.1122 |
| 55679 | LIMS2 | P15T-E | Human | Esophagus | ESCC | 2.59e-28 | 6.62e-01 | 0.1149 |
| 55679 | LIMS2 | P19T-E | Human | Esophagus | ESCC | 2.26e-02 | 4.31e-01 | 0.1662 |
| 55679 | LIMS2 | P20T-E | Human | Esophagus | ESCC | 2.17e-19 | 6.23e-01 | 0.1124 |
| 55679 | LIMS2 | P27T-E | Human | Esophagus | ESCC | 5.75e-15 | 3.01e-01 | 0.1055 |
| 55679 | LIMS2 | P30T-E | Human | Esophagus | ESCC | 1.41e-05 | 3.03e-01 | 0.137 |
| 55679 | LIMS2 | P48T-E | Human | Esophagus | ESCC | 1.01e-05 | 2.17e-01 | 0.0959 |
| 55679 | LIMS2 | P74T-E | Human | Esophagus | ESCC | 1.99e-25 | 7.84e-01 | 0.1479 |
| 55679 | LIMS2 | P89T-E | Human | Esophagus | ESCC | 1.46e-04 | 3.66e-01 | 0.1752 |
| 55679 | LIMS2 | P130T-E | Human | Esophagus | ESCC | 2.33e-24 | 6.33e-01 | 0.1676 |
| Page: 1 |
| Tissue | Expression Dynamics | Abbreviation |
| Esophagus | 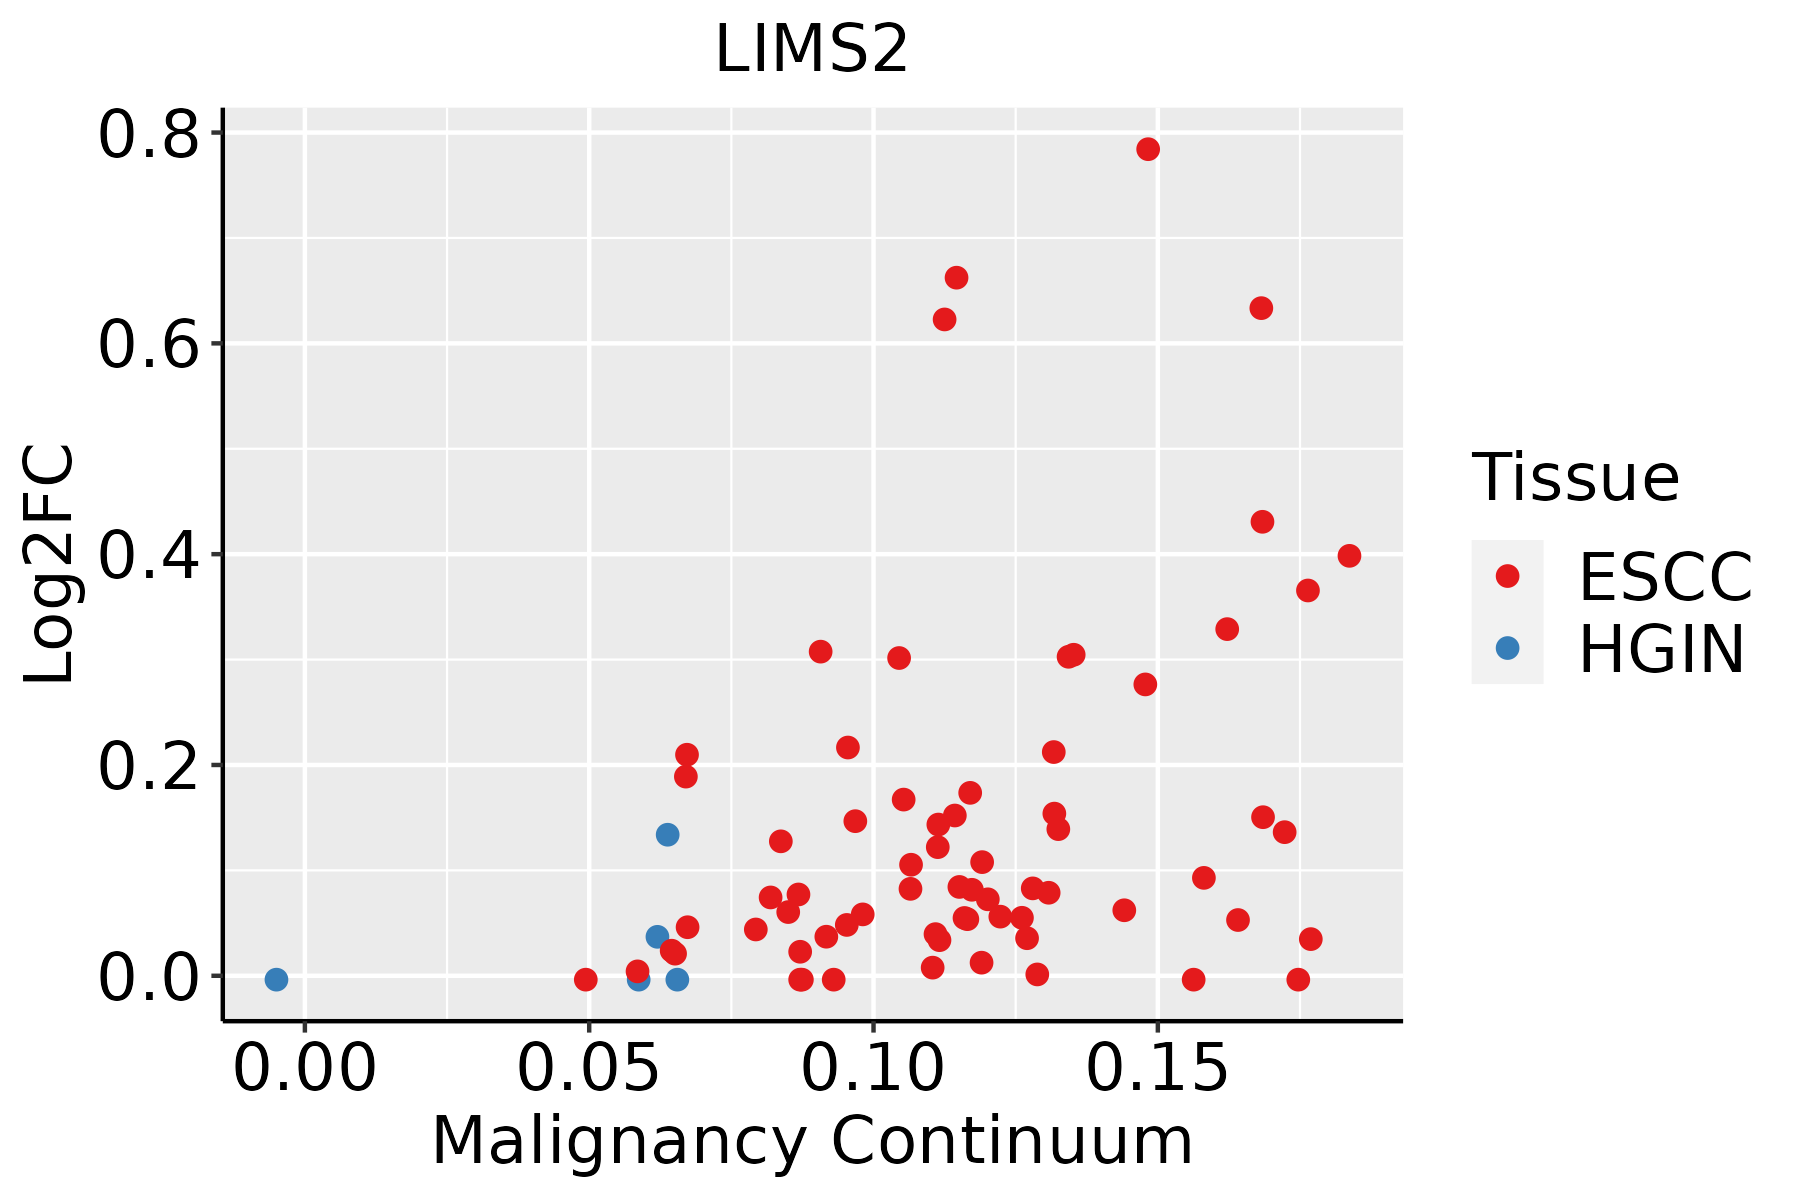 | ESCC: Esophageal squamous cell carcinoma |
| HGIN: High-grade intraepithelial neoplasias | ||
| LGIN: Low-grade intraepithelial neoplasias |
| ∗log2FC in expression of this searched gene in stem-like cells from each diseased tissue sample relative to stem-like cells in normal samples in each tissue plotted against the malignancy continuum. Samples are colored based on if they are from different disease stage. |
Top |
Malignant transformation related pathway analysis |
| Find out the enriched GO biological processes and KEGG pathways involved in transition from healthy to precancer to cancer |
| Tissue | Disease Stage | Enriched GO biological Processes |
| Colorectum | AD |  |
| Colorectum | SER |  |
| Colorectum | MSS |  |
| Colorectum | MSI-H |  |
| Colorectum | FAP |  |
| ∗Top 15 enriched GO BP terms are showed in the bar plot of each disease state in each tissue. Each row represents a significant GO biological process which is colored according to the -log10(p.adjust). |
| Page: 1 2 3 4 5 6 7 8 9 |
| GO ID | Tissue | Disease Stage | Description | Gene Ratio | Bg Ratio | pvalue | p.adjust | Count |
| GO:0048732111 | Esophagus | ESCC | gland development | 269/8552 | 436/18723 | 7.81e-12 | 2.95e-10 | 269 |
| GO:003158919 | Esophagus | ESCC | cell-substrate adhesion | 221/8552 | 363/18723 | 3.06e-09 | 6.62e-08 | 221 |
| GO:001081020 | Esophagus | ESCC | regulation of cell-substrate adhesion | 144/8552 | 221/18723 | 3.55e-09 | 7.45e-08 | 144 |
| GO:004578527 | Esophagus | ESCC | positive regulation of cell adhesion | 255/8552 | 437/18723 | 5.07e-08 | 9.11e-07 | 255 |
| GO:001081126 | Esophagus | ESCC | positive regulation of cell-substrate adhesion | 84/8552 | 123/18723 | 3.18e-07 | 4.50e-06 | 84 |
| GO:0061008110 | Esophagus | ESCC | hepaticobiliary system development | 98/8552 | 150/18723 | 8.91e-07 | 1.15e-05 | 98 |
| GO:0001889110 | Esophagus | ESCC | liver development | 96/8552 | 147/18723 | 1.18e-06 | 1.47e-05 | 96 |
| GO:002260420 | Esophagus | ESCC | regulation of cell morphogenesis | 180/8552 | 309/18723 | 5.19e-06 | 5.45e-05 | 180 |
| GO:002261216 | Esophagus | ESCC | gland morphogenesis | 78/8552 | 118/18723 | 5.83e-06 | 6.03e-05 | 78 |
| GO:001072010 | Esophagus | ESCC | positive regulation of cell development | 172/8552 | 298/18723 | 1.74e-05 | 1.55e-04 | 172 |
| GO:005067318 | Esophagus | ESCC | epithelial cell proliferation | 238/8552 | 437/18723 | 1.19e-04 | 8.20e-04 | 238 |
| GO:00072299 | Esophagus | ESCC | integrin-mediated signaling pathway | 67/8552 | 107/18723 | 3.03e-04 | 1.81e-03 | 67 |
| GO:001076920 | Esophagus | ESCC | regulation of cell morphogenesis involved in differentiation | 61/8552 | 96/18723 | 3.12e-04 | 1.85e-03 | 61 |
| GO:001077018 | Esophagus | ESCC | positive regulation of cell morphogenesis involved in differentiation | 51/8552 | 79/18723 | 5.48e-04 | 3.00e-03 | 51 |
| GO:005067817 | Esophagus | ESCC | regulation of epithelial cell proliferation | 206/8552 | 381/18723 | 5.51e-04 | 3.02e-03 | 206 |
| GO:004521620 | Esophagus | ESCC | cell-cell junction organization | 114/8552 | 200/18723 | 8.04e-04 | 4.16e-03 | 114 |
| GO:190002420 | Esophagus | ESCC | regulation of substrate adhesion-dependent cell spreading | 38/8552 | 57/18723 | 1.11e-03 | 5.56e-03 | 38 |
| GO:003444620 | Esophagus | ESCC | substrate adhesion-dependent cell spreading | 65/8552 | 108/18723 | 1.67e-03 | 7.72e-03 | 65 |
| GO:190002620 | Esophagus | ESCC | positive regulation of substrate adhesion-dependent cell spreading | 28/8552 | 41/18723 | 2.88e-03 | 1.21e-02 | 28 |
| Page: 1 |
| Pathway ID | Tissue | Disease Stage | Description | Gene Ratio | Bg Ratio | pvalue | p.adjust | qvalue | Count |
| Page: 1 |
Top |
Cell-cell communication analysis |
| Identification of potential cell-cell interactions between two cell types and their ligand-receptor pairs for different disease states |
| Ligand | Receptor | LRpair | Pathway | Tissue | Disease Stage |
| Page: 1 |
Top |
Single-cell gene regulatory network inference analysis |
| Find out the significant the regulons (TFs) and the target genes of each regulon across cell types for different disease states |
| TF | Cell Type | Tissue | Disease Stage | Target Gene | RSS | Regulon Activity |
| ∗The dot plots of a searched regulon are shown for all cell subpopulations in each disease state of each tissue based on the regulon specific score inferred using pySCENIC and by calculating the average expression. |
| Page: 1 |
Top |
Somatic mutation of malignant transformation related genes |
| Annotation of somatic variants for genes involved in malignant transformation |
| Hugo Symbol | Variant Class | Variant Classification | dbSNP RS | HGVSc | HGVSp | HGVSp Short | SWISSPROT | BIOTYPE | SIFT | PolyPhen | Tumor Sample Barcode | Tissue | Histology | Sex | Age | Stage | Therapy Types | Drugs | Outcome |
| LIMS2 | SNV | Missense_Mutation | novel | c.575N>G | p.His192Arg | p.H192R | Q7Z4I7 | protein_coding | tolerated(0.63) | benign(0.037) | TCGA-AO-A128-01 | Breast | breast invasive carcinoma | Female | <65 | I/II | Chemotherapy | doxorubicin | SD |
| LIMS2 | SNV | Missense_Mutation | c.615N>T | p.Lys205Asn | p.K205N | Q7Z4I7 | protein_coding | tolerated(0.14) | probably_damaging(0.994) | TCGA-BH-A18J-01 | Breast | breast invasive carcinoma | Female | <65 | III/IV | Unknown | Unknown | PD | |
| LIMS2 | SNV | Missense_Mutation | novel | c.368N>A | p.Cys123Tyr | p.C123Y | Q7Z4I7 | protein_coding | deleterious(0) | possibly_damaging(0.904) | TCGA-EA-A410-01 | Cervix | cervical & endocervical cancer | Female | <65 | I/II | Unknown | Unknown | SD |
| LIMS2 | SNV | Missense_Mutation | c.970G>A | p.Asp324Asn | p.D324N | Q7Z4I7 | protein_coding | deleterious(0) | probably_damaging(0.992) | TCGA-AA-3984-01 | Colorectum | colon adenocarcinoma | Female | <65 | I/II | Unknown | Unknown | SD | |
| LIMS2 | SNV | Missense_Mutation | novel | c.623N>G | p.Leu208Arg | p.L208R | Q7Z4I7 | protein_coding | deleterious(0) | probably_damaging(0.997) | TCGA-AA-A010-01 | Colorectum | colon adenocarcinoma | Female | <65 | I/II | Chemotherapy | folinic | CR |
| LIMS2 | SNV | Missense_Mutation | rs762554883 | c.706G>A | p.Ala236Thr | p.A236T | Q7Z4I7 | protein_coding | deleterious(0.01) | probably_damaging(0.996) | TCGA-AD-6895-01 | Colorectum | colon adenocarcinoma | Male | >=65 | III/IV | Unknown | Unknown | SD |
| LIMS2 | SNV | Missense_Mutation | c.815N>G | p.His272Arg | p.H272R | Q7Z4I7 | protein_coding | deleterious(0) | probably_damaging(0.964) | TCGA-NH-A5IV-01 | Colorectum | colon adenocarcinoma | Female | >=65 | I/II | Unknown | Unknown | SD | |
| LIMS2 | SNV | Missense_Mutation | c.562N>C | p.Phe188Leu | p.F188L | Q7Z4I7 | protein_coding | deleterious(0) | probably_damaging(0.969) | TCGA-NH-A8F8-01 | Colorectum | colon adenocarcinoma | Male | >=65 | III/IV | Chemotherapy | fluorouracil | PD | |
| LIMS2 | SNV | Missense_Mutation | novel | c.1023N>T | p.Lys341Asn | p.K341N | Q7Z4I7 | protein_coding | deleterious(0) | probably_damaging(0.961) | TCGA-AG-A002-01 | Colorectum | rectum adenocarcinoma | Male | <65 | I/II | Unknown | Unknown | SD |
| LIMS2 | SNV | Missense_Mutation | novel | c.41G>A | p.Gly14Glu | p.G14E | Q7Z4I7 | protein_coding | tolerated_low_confidence(1) | benign(0) | TCGA-5B-A90C-01 | Endometrium | uterine corpus endometrioid carcinoma | Female | >=65 | I/II | Chemotherapy | carboplatin | SD |
| Page: 1 2 3 4 5 |
Top |
Related drugs of malignant transformation related genes |
| Identification of chemicals and drugs interact with genes involved in malignant transfromation |
| (DGIdb 4.0) |
| Entrez ID | Symbol | Category | Interaction Types | Drug Claim Name | Drug Name | PMIDs |
| Page: 1 |

Copyright 2023-Present -The University of Texas Health Science Center at Houston |