
|
|||||
|
 | |
| |
| |
| |
| |
| |
|
Gene: LIMK2 |
Gene summary for LIMK2 |
| Gene information | Species | Human | Gene symbol | LIMK2 | Gene ID | 3985 |
| Gene name | LIM domain kinase 2 | |
| Gene Alias | LIMK2 | |
| Cytomap | 22q12.2 | |
| Gene Type | protein-coding | GO ID | GO:0000003 | UniProtAcc | P53671 |
Top |
Malignant transformation analysis |
| Identification of the aberrant gene expression in precancerous and cancerous lesions by comparing the gene expression of stem-like cells in diseased tissues with normal stem cells |
| Entrez ID | Symbol | Replicates | Species | Organ | Tissue | Adj P-value | Log2FC | Malignancy |
| 3985 | LIMK2 | CCI_1 | Human | Cervix | CC | 2.62e-10 | 8.07e-01 | 0.528 |
| 3985 | LIMK2 | CCI_2 | Human | Cervix | CC | 3.69e-12 | 1.19e+00 | 0.5249 |
| 3985 | LIMK2 | CCI_3 | Human | Cervix | CC | 6.83e-09 | 7.57e-01 | 0.516 |
| 3985 | LIMK2 | HTA11_3410_2000001011 | Human | Colorectum | AD | 1.89e-13 | -3.86e-01 | 0.0155 |
| 3985 | LIMK2 | HTA11_347_2000001011 | Human | Colorectum | AD | 4.94e-15 | 8.24e-01 | -0.1954 |
| 3985 | LIMK2 | HTA11_83_2000001011 | Human | Colorectum | SER | 6.84e-09 | 7.50e-01 | -0.1526 |
| 3985 | LIMK2 | HTA11_696_2000001011 | Human | Colorectum | AD | 2.68e-12 | 7.52e-01 | -0.1464 |
| 3985 | LIMK2 | HTA11_866_2000001011 | Human | Colorectum | AD | 3.42e-04 | 4.08e-01 | -0.1001 |
| 3985 | LIMK2 | HTA11_1391_2000001011 | Human | Colorectum | AD | 8.92e-04 | 5.73e-01 | -0.059 |
| 3985 | LIMK2 | HTA11_546_2000001011 | Human | Colorectum | AD | 1.87e-08 | 8.11e-01 | -0.0842 |
| 3985 | LIMK2 | HTA11_10623_2000001011 | Human | Colorectum | AD | 3.76e-03 | 5.35e-01 | -0.0177 |
| 3985 | LIMK2 | HTA11_6818_2000001021 | Human | Colorectum | AD | 8.26e-06 | -5.58e-01 | 0.0588 |
| 3985 | LIMK2 | HTA11_99999970781_79442 | Human | Colorectum | MSS | 1.09e-11 | -4.68e-01 | 0.294 |
| 3985 | LIMK2 | HTA11_99999974143_84620 | Human | Colorectum | MSS | 5.64e-10 | -4.95e-01 | 0.3005 |
| 3985 | LIMK2 | F007 | Human | Colorectum | FAP | 7.89e-09 | -5.51e-01 | 0.1176 |
| 3985 | LIMK2 | A001-C-207 | Human | Colorectum | FAP | 4.59e-14 | -5.71e-01 | 0.1278 |
| 3985 | LIMK2 | A015-C-203 | Human | Colorectum | FAP | 8.79e-42 | -7.13e-01 | -0.1294 |
| 3985 | LIMK2 | A015-C-204 | Human | Colorectum | FAP | 3.61e-16 | -5.90e-01 | -0.0228 |
| 3985 | LIMK2 | A014-C-040 | Human | Colorectum | FAP | 1.05e-11 | -6.16e-01 | -0.1184 |
| 3985 | LIMK2 | A002-C-201 | Human | Colorectum | FAP | 3.19e-22 | -5.36e-01 | 0.0324 |
| Page: 1 2 3 4 5 6 7 8 9 |
| Tissue | Expression Dynamics | Abbreviation |
| Cervix | 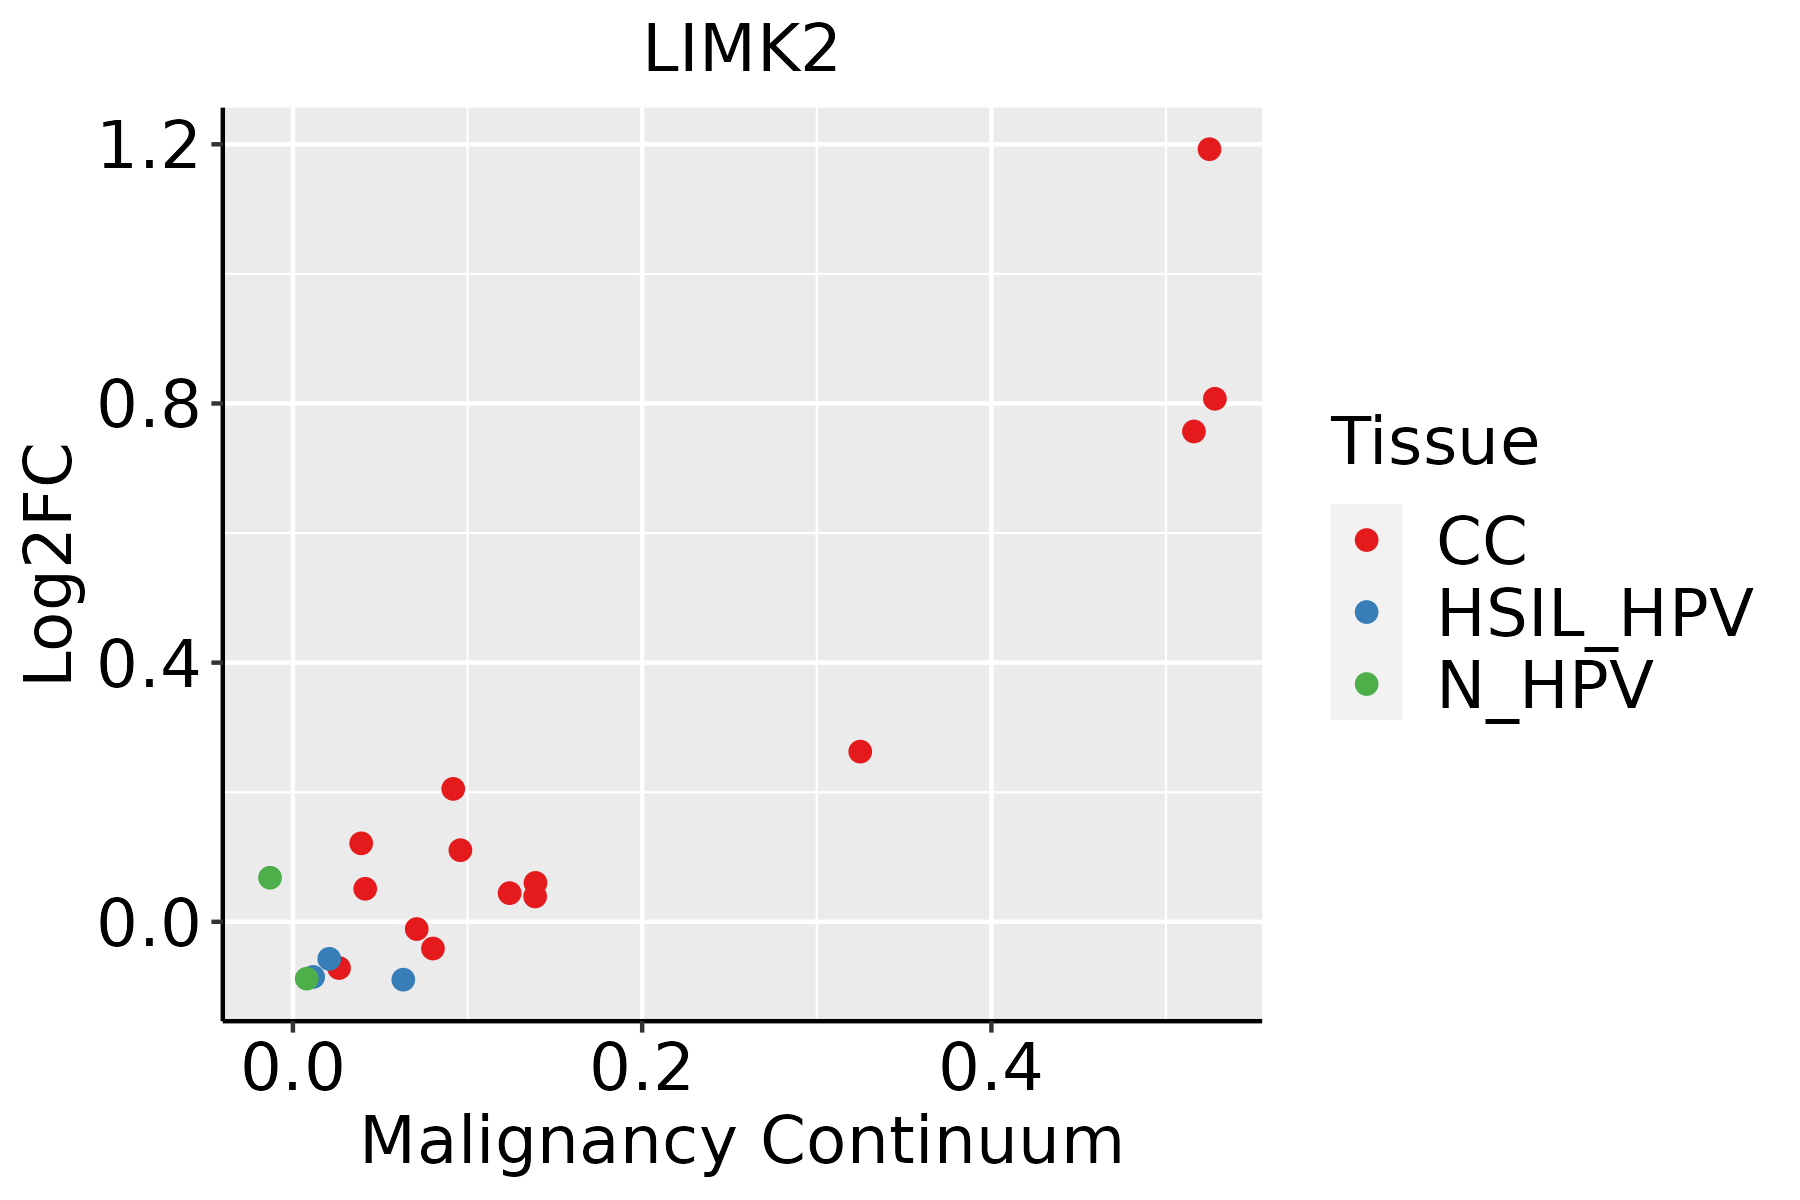 | CC: Cervix cancer |
| HSIL_HPV: HPV-infected high-grade squamous intraepithelial lesions | ||
| N_HPV: HPV-infected normal cervix | ||
| Colorectum (GSE201348) |  | FAP: Familial adenomatous polyposis |
| CRC: Colorectal cancer | ||
| Colorectum (HTA11) |  | AD: Adenomas |
| SER: Sessile serrated lesions | ||
| MSI-H: Microsatellite-high colorectal cancer | ||
| MSS: Microsatellite stable colorectal cancer | ||
| Esophagus | 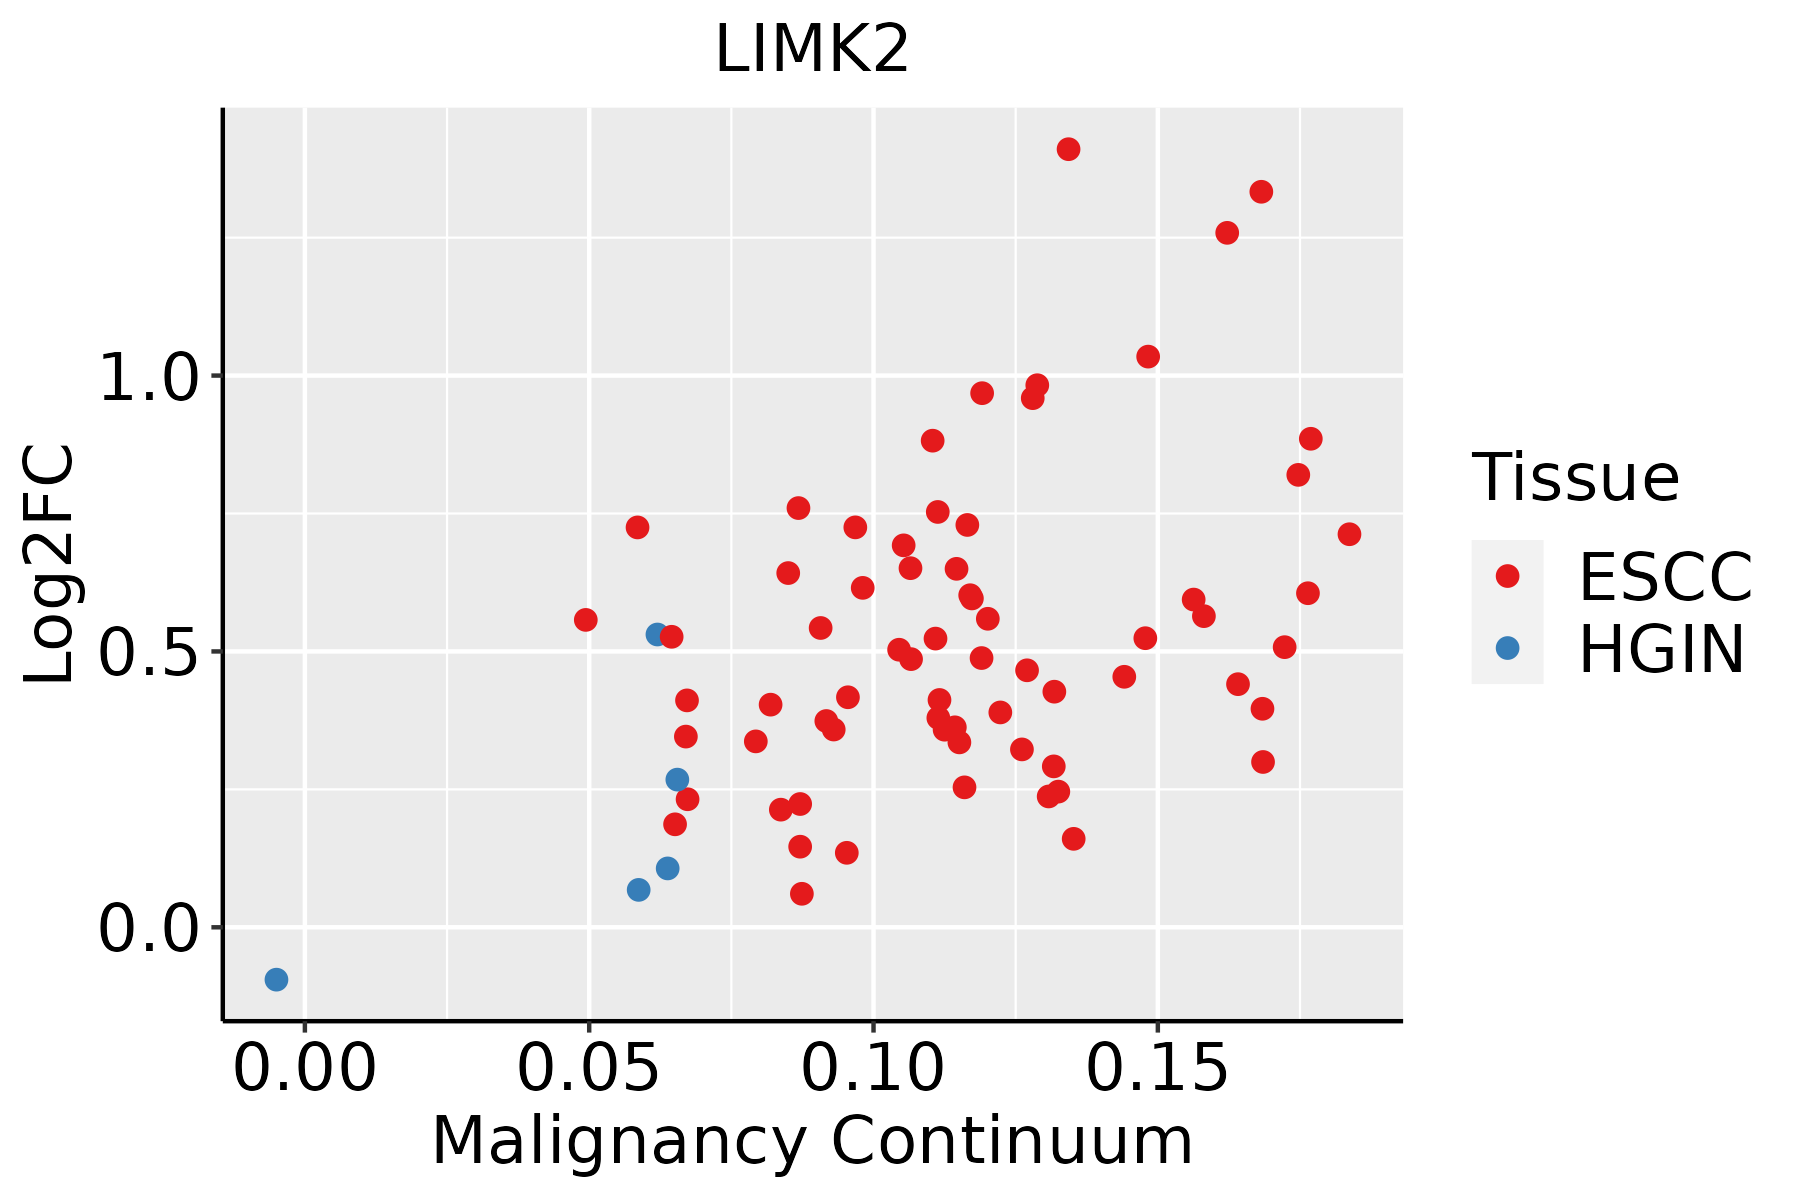 | ESCC: Esophageal squamous cell carcinoma |
| HGIN: High-grade intraepithelial neoplasias | ||
| LGIN: Low-grade intraepithelial neoplasias | ||
| Liver | 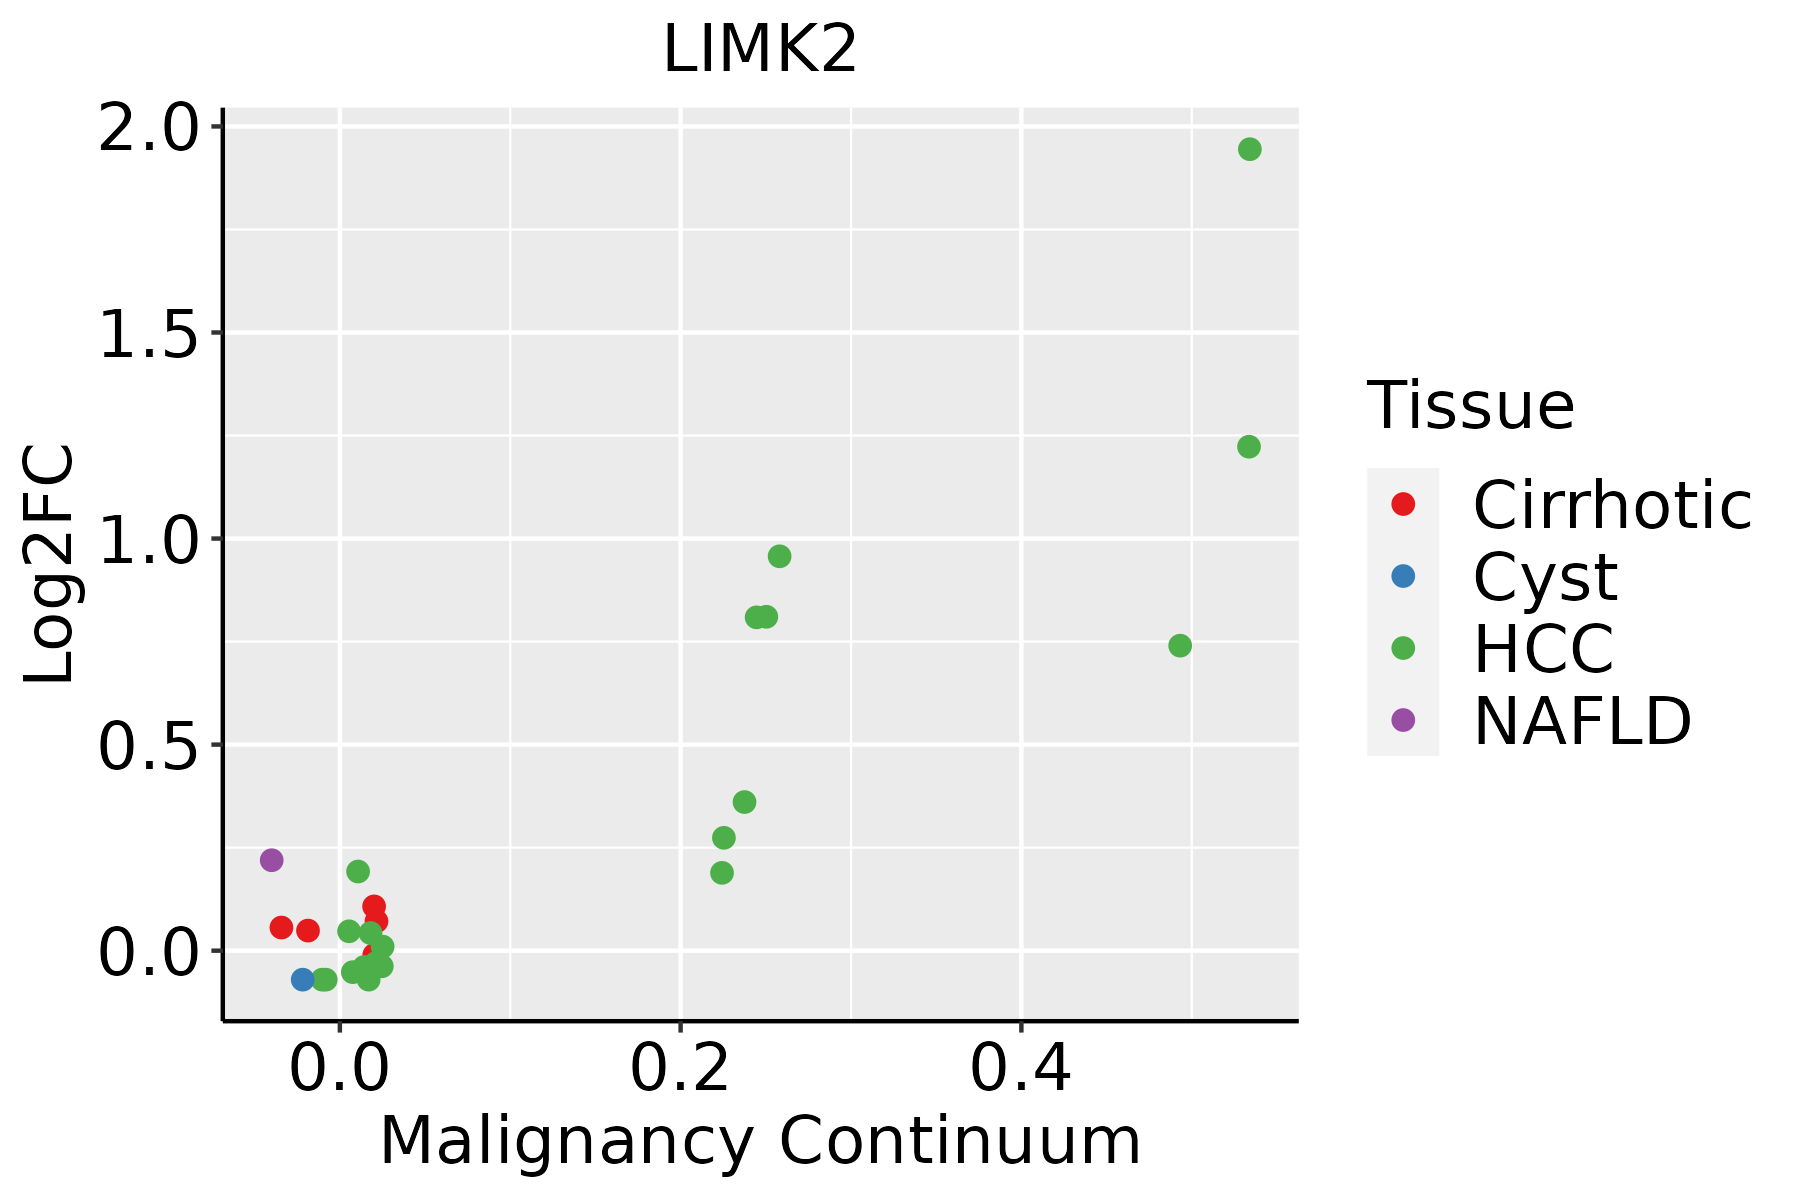 | HCC: Hepatocellular carcinoma |
| NAFLD: Non-alcoholic fatty liver disease | ||
| Oral Cavity | 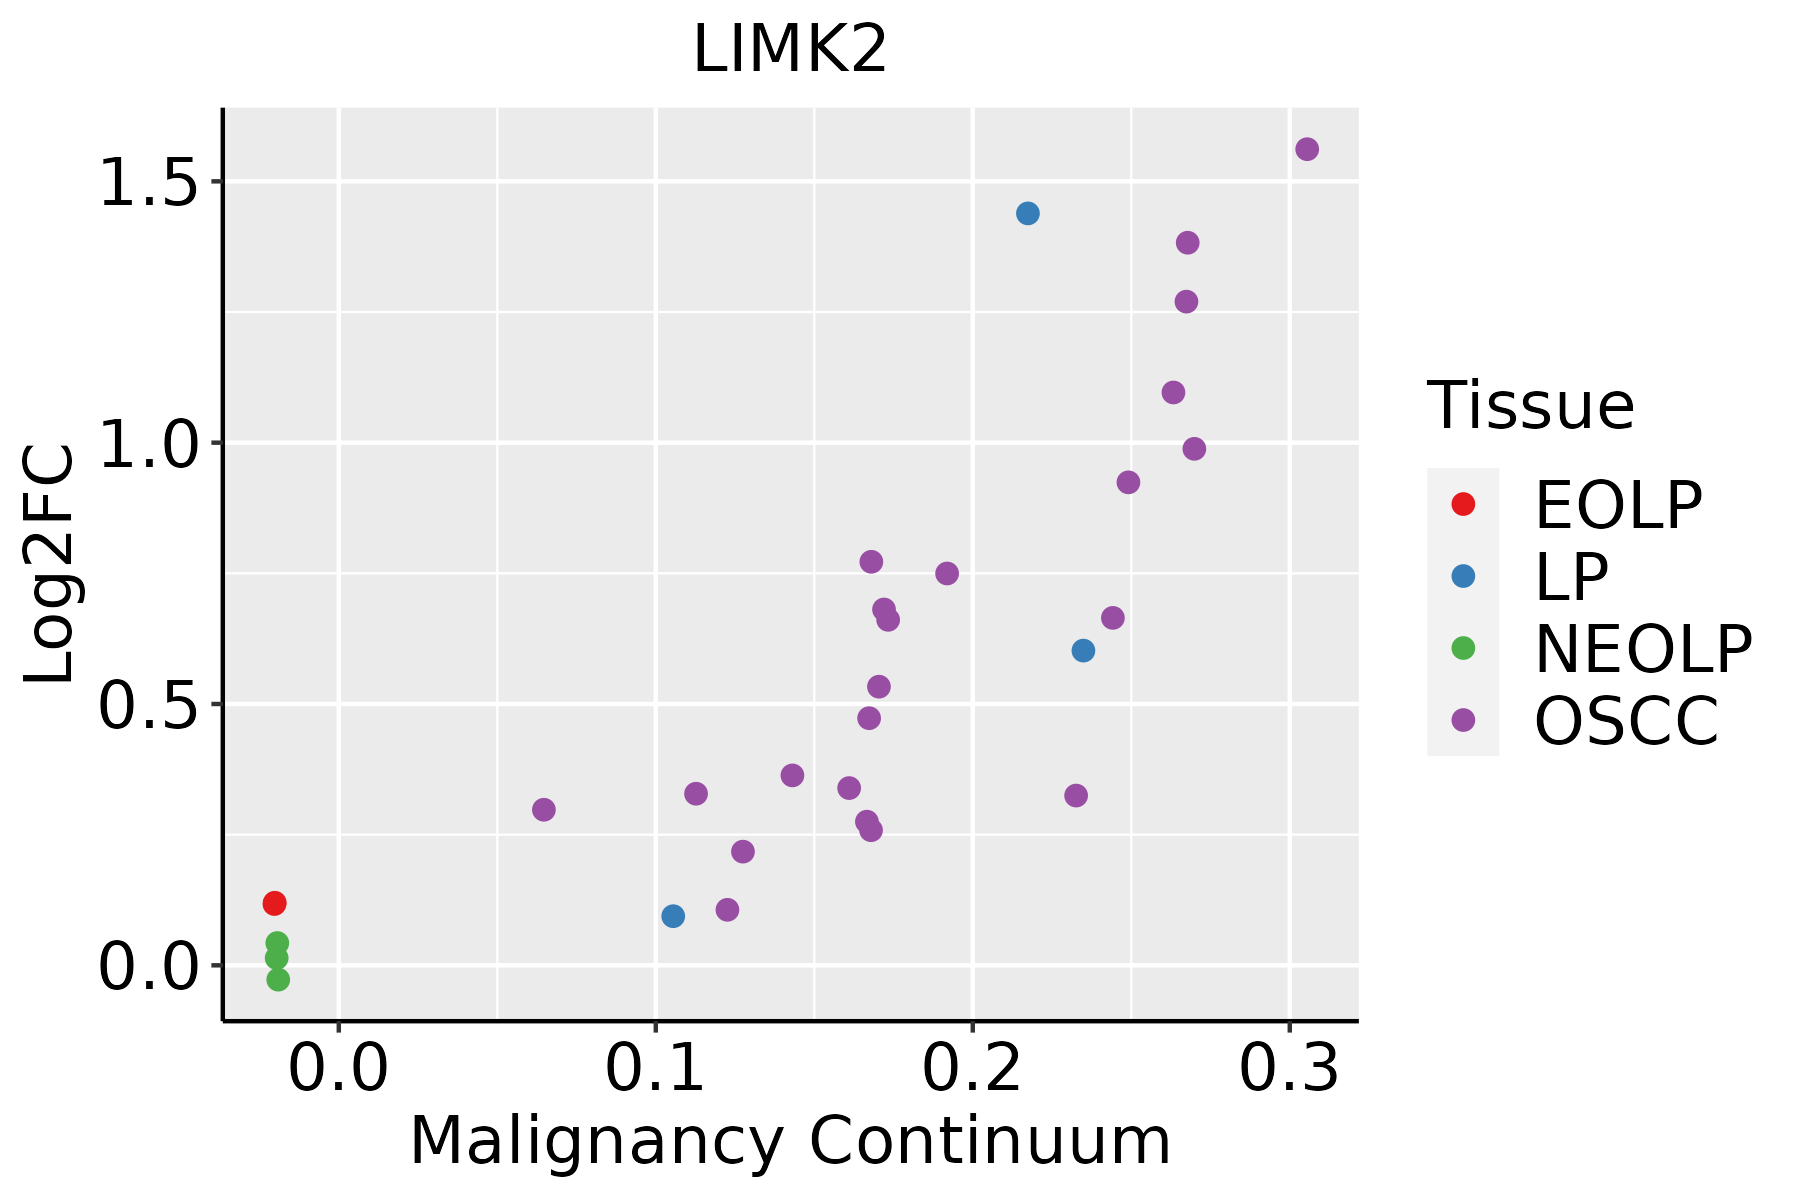 | EOLP: Erosive Oral lichen planus |
| LP: leukoplakia | ||
| NEOLP: Non-erosive oral lichen planus | ||
| OSCC: Oral squamous cell carcinoma | ||
| Prostate |  | BPH: Benign Prostatic Hyperplasia |
| Skin | 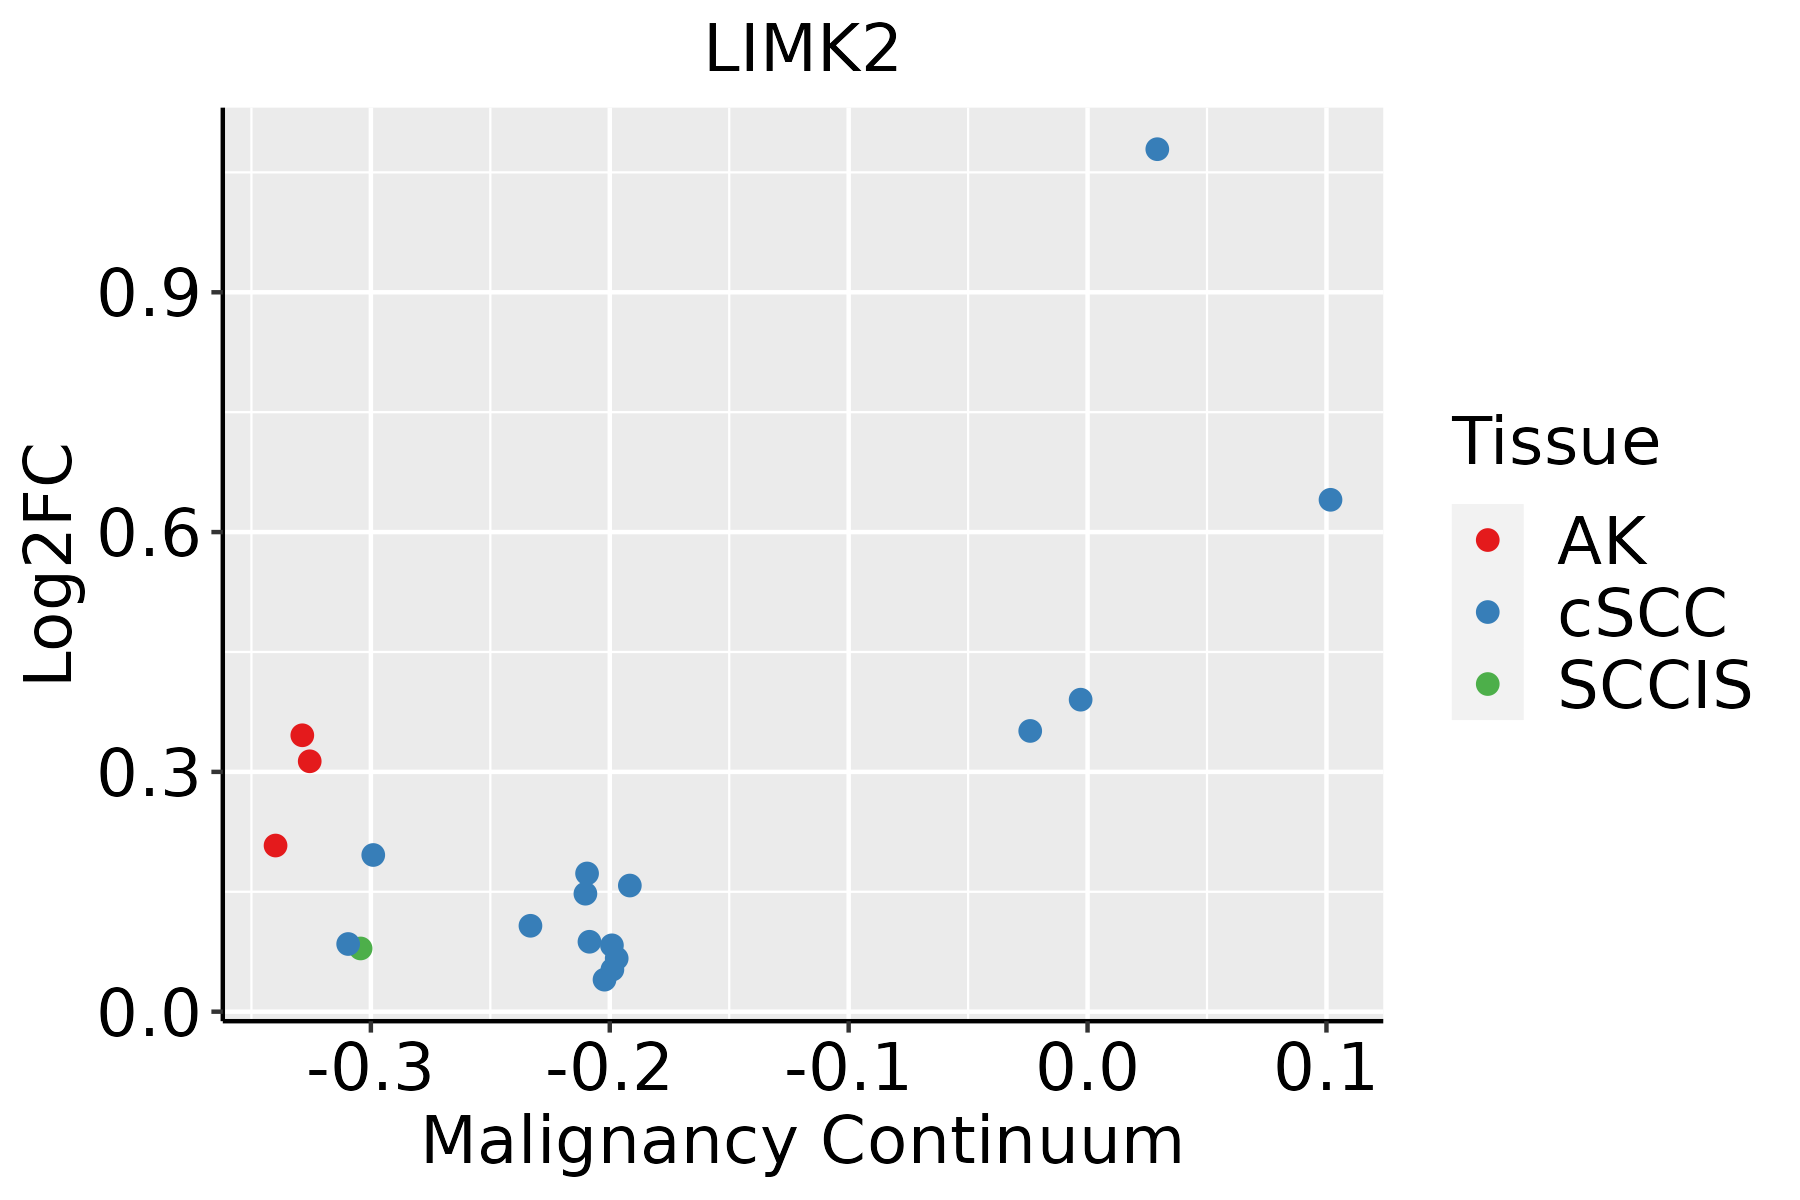 | AK: Actinic keratosis |
| cSCC: Cutaneous squamous cell carcinoma | ||
| SCCIS:squamous cell carcinoma in situ | ||
| Thyroid | 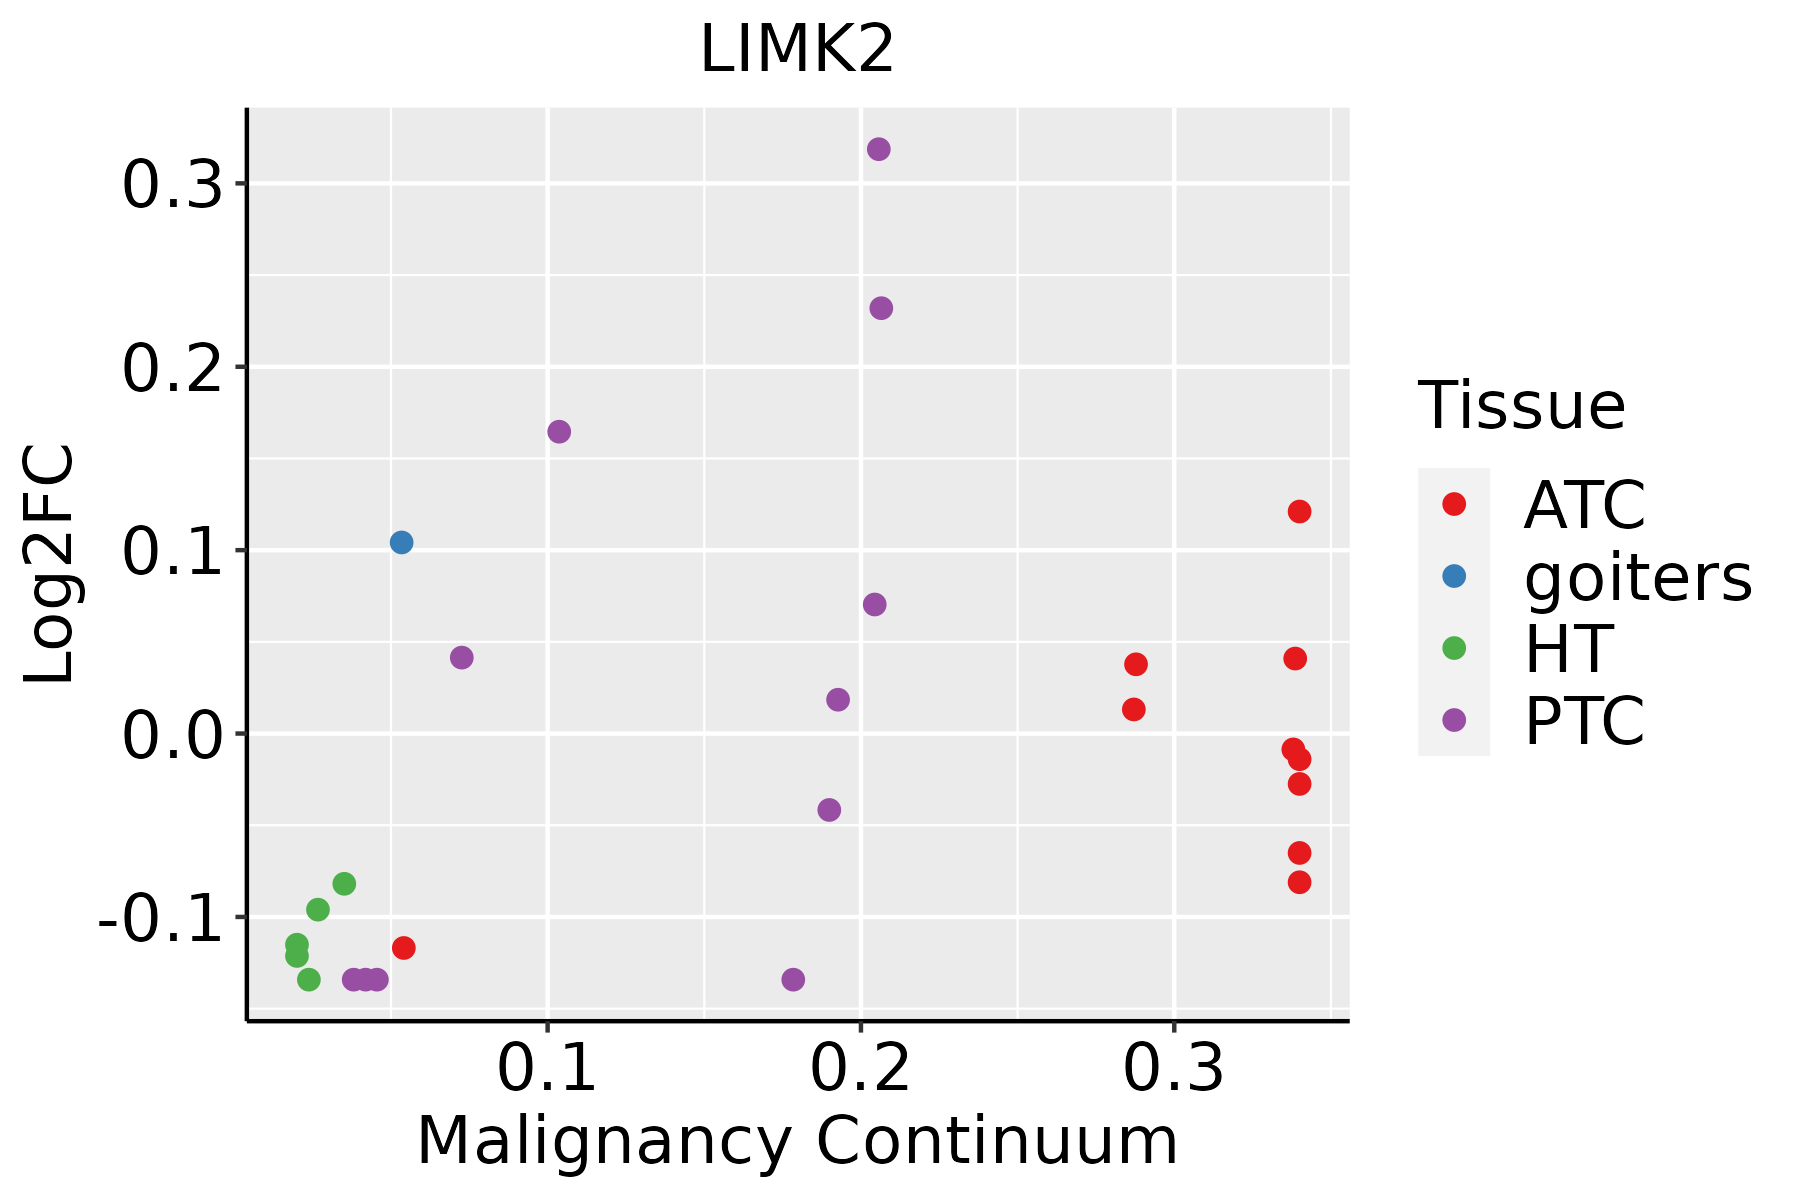 | ATC: Anaplastic thyroid cancer |
| HT: Hashimoto's thyroiditis | ||
| PTC: Papillary thyroid cancer |
| ∗log2FC in expression of this searched gene in stem-like cells from each diseased tissue sample relative to stem-like cells in normal samples in each tissue plotted against the malignancy continuum. Samples are colored based on if they are from different disease stage. |
Top |
Malignant transformation related pathway analysis |
| Find out the enriched GO biological processes and KEGG pathways involved in transition from healthy to precancer to cancer |
| Tissue | Disease Stage | Enriched GO biological Processes |
| Colorectum | AD |  |
| Colorectum | SER |  |
| Colorectum | MSS |  |
| Colorectum | MSI-H |  |
| Colorectum | FAP |  |
| ∗Top 15 enriched GO BP terms are showed in the bar plot of each disease state in each tissue. Each row represents a significant GO biological process which is colored according to the -log10(p.adjust). |
| Page: 1 2 3 4 5 6 7 8 9 |
| GO ID | Tissue | Disease Stage | Description | Gene Ratio | Bg Ratio | pvalue | p.adjust | Count |
| GO:190382910 | Cervix | CC | positive regulation of cellular protein localization | 72/2311 | 276/18723 | 3.20e-10 | 4.46e-08 | 72 |
| GO:00345048 | Cervix | CC | protein localization to nucleus | 68/2311 | 290/18723 | 9.91e-08 | 5.25e-06 | 68 |
| GO:00516567 | Cervix | CC | establishment of organelle localization | 76/2311 | 390/18723 | 3.17e-05 | 5.21e-04 | 76 |
| GO:00106399 | Cervix | CC | negative regulation of organelle organization | 68/2311 | 348/18723 | 7.40e-05 | 1.03e-03 | 68 |
| GO:19021153 | Cervix | CC | regulation of organelle assembly | 40/2311 | 186/18723 | 2.92e-04 | 3.15e-03 | 40 |
| GO:00309532 | Cervix | CC | astral microtubule organization | 6/2311 | 10/18723 | 4.73e-04 | 4.68e-03 | 6 |
| GO:19001808 | Cervix | CC | regulation of protein localization to nucleus | 31/2311 | 136/18723 | 4.76e-04 | 4.69e-03 | 31 |
| GO:00313456 | Cervix | CC | negative regulation of cell projection organization | 39/2311 | 186/18723 | 5.86e-04 | 5.57e-03 | 39 |
| GO:19001827 | Cervix | CC | positive regulation of protein localization to nucleus | 22/2311 | 87/18723 | 7.03e-04 | 6.40e-03 | 22 |
| GO:01200328 | Cervix | CC | regulation of plasma membrane bounded cell projection assembly | 38/2311 | 186/18723 | 1.14e-03 | 9.35e-03 | 38 |
| GO:00604917 | Cervix | CC | regulation of cell projection assembly | 38/2311 | 188/18723 | 1.40e-03 | 1.10e-02 | 38 |
| GO:0150063 | Cervix | CC | visual system development | 63/2311 | 375/18723 | 6.58e-03 | 3.65e-02 | 63 |
| GO:00311224 | Cervix | CC | cytoplasmic microtubule organization | 14/2311 | 56/18723 | 6.93e-03 | 3.74e-02 | 14 |
| GO:0001654 | Cervix | CC | eye development | 62/2311 | 371/18723 | 7.83e-03 | 4.13e-02 | 62 |
| GO:0048880 | Cervix | CC | sensory system development | 63/2311 | 381/18723 | 9.29e-03 | 4.66e-02 | 63 |
| GO:1903829 | Colorectum | AD | positive regulation of cellular protein localization | 110/3918 | 276/18723 | 4.58e-13 | 8.44e-11 | 110 |
| GO:0051656 | Colorectum | AD | establishment of organelle localization | 131/3918 | 390/18723 | 3.00e-09 | 2.06e-07 | 131 |
| GO:0010639 | Colorectum | AD | negative regulation of organelle organization | 114/3918 | 348/18723 | 1.41e-07 | 6.49e-06 | 114 |
| GO:1900180 | Colorectum | AD | regulation of protein localization to nucleus | 55/3918 | 136/18723 | 1.70e-07 | 7.34e-06 | 55 |
| GO:1900182 | Colorectum | AD | positive regulation of protein localization to nucleus | 38/3918 | 87/18723 | 1.43e-06 | 4.52e-05 | 38 |
| Page: 1 2 3 4 5 6 7 8 9 10 11 12 |
| Pathway ID | Tissue | Disease Stage | Description | Gene Ratio | Bg Ratio | pvalue | p.adjust | qvalue | Count |
| hsa0481016 | Cervix | CC | Regulation of actin cytoskeleton | 64/1267 | 229/8465 | 2.24e-07 | 2.59e-06 | 1.53e-06 | 64 |
| hsa0466612 | Cervix | CC | Fc gamma R-mediated phagocytosis | 31/1267 | 97/8465 | 1.78e-05 | 1.42e-04 | 8.40e-05 | 31 |
| hsa0517016 | Cervix | CC | Human immunodeficiency virus 1 infection | 55/1267 | 212/8465 | 1.80e-05 | 1.42e-04 | 8.40e-05 | 55 |
| hsa043609 | Cervix | CC | Axon guidance | 47/1267 | 182/8465 | 8.13e-05 | 5.38e-04 | 3.18e-04 | 47 |
| hsa0481017 | Cervix | CC | Regulation of actin cytoskeleton | 64/1267 | 229/8465 | 2.24e-07 | 2.59e-06 | 1.53e-06 | 64 |
| hsa0466613 | Cervix | CC | Fc gamma R-mediated phagocytosis | 31/1267 | 97/8465 | 1.78e-05 | 1.42e-04 | 8.40e-05 | 31 |
| hsa0517017 | Cervix | CC | Human immunodeficiency virus 1 infection | 55/1267 | 212/8465 | 1.80e-05 | 1.42e-04 | 8.40e-05 | 55 |
| hsa0436012 | Cervix | CC | Axon guidance | 47/1267 | 182/8465 | 8.13e-05 | 5.38e-04 | 3.18e-04 | 47 |
| hsa04666 | Colorectum | AD | Fc gamma R-mediated phagocytosis | 46/2092 | 97/8465 | 9.10e-07 | 1.22e-05 | 7.77e-06 | 46 |
| hsa05170 | Colorectum | AD | Human immunodeficiency virus 1 infection | 72/2092 | 212/8465 | 1.40e-03 | 8.46e-03 | 5.39e-03 | 72 |
| hsa04810 | Colorectum | AD | Regulation of actin cytoskeleton | 75/2092 | 229/8465 | 3.36e-03 | 1.76e-02 | 1.12e-02 | 75 |
| hsa04360 | Colorectum | AD | Axon guidance | 61/2092 | 182/8465 | 4.36e-03 | 2.17e-02 | 1.38e-02 | 61 |
| hsa046661 | Colorectum | AD | Fc gamma R-mediated phagocytosis | 46/2092 | 97/8465 | 9.10e-07 | 1.22e-05 | 7.77e-06 | 46 |
| hsa051701 | Colorectum | AD | Human immunodeficiency virus 1 infection | 72/2092 | 212/8465 | 1.40e-03 | 8.46e-03 | 5.39e-03 | 72 |
| hsa048101 | Colorectum | AD | Regulation of actin cytoskeleton | 75/2092 | 229/8465 | 3.36e-03 | 1.76e-02 | 1.12e-02 | 75 |
| hsa043601 | Colorectum | AD | Axon guidance | 61/2092 | 182/8465 | 4.36e-03 | 2.17e-02 | 1.38e-02 | 61 |
| hsa046662 | Colorectum | SER | Fc gamma R-mediated phagocytosis | 39/1580 | 97/8465 | 5.84e-07 | 9.70e-06 | 7.04e-06 | 39 |
| hsa051702 | Colorectum | SER | Human immunodeficiency virus 1 infection | 58/1580 | 212/8465 | 1.08e-03 | 8.56e-03 | 6.21e-03 | 58 |
| hsa048102 | Colorectum | SER | Regulation of actin cytoskeleton | 60/1580 | 229/8465 | 2.74e-03 | 2.02e-02 | 1.47e-02 | 60 |
| hsa046663 | Colorectum | SER | Fc gamma R-mediated phagocytosis | 39/1580 | 97/8465 | 5.84e-07 | 9.70e-06 | 7.04e-06 | 39 |
| Page: 1 2 3 4 5 |
Top |
Cell-cell communication analysis |
| Identification of potential cell-cell interactions between two cell types and their ligand-receptor pairs for different disease states |
| Ligand | Receptor | LRpair | Pathway | Tissue | Disease Stage |
| Page: 1 |
Top |
Single-cell gene regulatory network inference analysis |
| Find out the significant the regulons (TFs) and the target genes of each regulon across cell types for different disease states |
| TF | Cell Type | Tissue | Disease Stage | Target Gene | RSS | Regulon Activity |
| ∗The dot plots of a searched regulon are shown for all cell subpopulations in each disease state of each tissue based on the regulon specific score inferred using pySCENIC and by calculating the average expression. |
| Page: 1 |
Top |
Somatic mutation of malignant transformation related genes |
| Annotation of somatic variants for genes involved in malignant transformation |
| Hugo Symbol | Variant Class | Variant Classification | dbSNP RS | HGVSc | HGVSp | HGVSp Short | SWISSPROT | BIOTYPE | SIFT | PolyPhen | Tumor Sample Barcode | Tissue | Histology | Sex | Age | Stage | Therapy Types | Drugs | Outcome |
| LIMK2 | SNV | Missense_Mutation | c.925N>A | p.Asp309Asn | p.D309N | P53671 | protein_coding | deleterious(0) | probably_damaging(0.955) | TCGA-AC-A23H-01 | Breast | breast invasive carcinoma | Female | >=65 | I/II | Unknown | Unknown | PD | |
| LIMK2 | SNV | Missense_Mutation | novel | c.244N>A | p.Val82Met | p.V82M | P53671 | protein_coding | tolerated(0.16) | benign(0.374) | TCGA-AC-A2QH-01 | Breast | breast invasive carcinoma | Female | <65 | I/II | Chemotherapy | cytoxan | CR |
| LIMK2 | SNV | Missense_Mutation | c.563N>T | p.Gly188Val | p.G188V | P53671 | protein_coding | deleterious(0) | probably_damaging(1) | TCGA-AR-A251-01 | Breast | breast invasive carcinoma | Female | <65 | III/IV | Chemotherapy | doxorubicin | SD | |
| LIMK2 | SNV | Missense_Mutation | c.689C>T | p.Ala230Val | p.A230V | P53671 | protein_coding | tolerated(0.09) | benign(0.007) | TCGA-BH-A0HA-01 | Breast | breast invasive carcinoma | Female | <65 | I/II | Unknown | Unknown | SD | |
| LIMK2 | SNV | Missense_Mutation | rs756541241 | c.686N>G | p.Glu229Gly | p.E229G | P53671 | protein_coding | tolerated(0.4) | benign(0) | TCGA-EW-A1J3-01 | Breast | breast invasive carcinoma | Female | <65 | I/II | Chemotherapy | carboplatin | SD |
| LIMK2 | deletion | Frame_Shift_Del | novel | c.215delC | p.Pro72GlnfsTer7 | p.P72Qfs*7 | P53671 | protein_coding | TCGA-D8-A27V-01 | Breast | breast invasive carcinoma | Female | <65 | I/II | Hormone Therapy | tamoxiphen | SD | ||
| LIMK2 | SNV | Missense_Mutation | rs138454239 | c.1243G>A | p.Ala415Thr | p.A415T | P53671 | protein_coding | deleterious(0.03) | probably_damaging(0.994) | TCGA-JW-A5VH-01 | Cervix | cervical & endocervical cancer | Female | <65 | I/II | Chemotherapy | carboplatin | PD |
| LIMK2 | SNV | Missense_Mutation | novel | c.1321N>A | p.Asp441Asn | p.D441N | P53671 | protein_coding | tolerated(0.53) | possibly_damaging(0.524) | TCGA-5M-AAT6-01 | Colorectum | colon adenocarcinoma | Female | <65 | III/IV | Unknown | Unknown | PD |
| LIMK2 | SNV | Missense_Mutation | c.600N>T | p.Glu200Asp | p.E200D | P53671 | protein_coding | tolerated(0.82) | benign(0.003) | TCGA-A6-2686-01 | Colorectum | colon adenocarcinoma | Female | >=65 | I/II | Unknown | Unknown | SD | |
| LIMK2 | SNV | Missense_Mutation | c.150C>A | p.Phe50Leu | p.F50L | P53671 | protein_coding | tolerated(0.88) | benign(0) | TCGA-A6-6141-01 | Colorectum | colon adenocarcinoma | Male | <65 | I/II | Chemotherapy | 5-fu | SD |
| Page: 1 2 3 4 5 6 7 |
Top |
Related drugs of malignant transformation related genes |
| Identification of chemicals and drugs interact with genes involved in malignant transfromation |
| (DGIdb 4.0) |
| Entrez ID | Symbol | Category | Interaction Types | Drug Claim Name | Drug Name | PMIDs |
| 3985 | LIMK2 | DRUGGABLE GENOME, KINASE, ENZYME, SERINE THREONINE KINASE | inhibitor | 249565831 | ||
| 3985 | LIMK2 | DRUGGABLE GENOME, KINASE, ENZYME, SERINE THREONINE KINASE | inhibitor | 249565797 | ||
| 3985 | LIMK2 | DRUGGABLE GENOME, KINASE, ENZYME, SERINE THREONINE KINASE | inhibitor | 249565833 | ||
| 3985 | LIMK2 | DRUGGABLE GENOME, KINASE, ENZYME, SERINE THREONINE KINASE | inhibitor | 363894133 | ||
| 3985 | LIMK2 | DRUGGABLE GENOME, KINASE, ENZYME, SERINE THREONINE KINASE | inhibitor | 249565799 | ||
| 3985 | LIMK2 | DRUGGABLE GENOME, KINASE, ENZYME, SERINE THREONINE KINASE | inhibitor | 249565798 | ||
| 3985 | LIMK2 | DRUGGABLE GENOME, KINASE, ENZYME, SERINE THREONINE KINASE | inhibitor | 384403681 |
| Page: 1 |

Copyright 2023-Present -The University of Texas Health Science Center at Houston |