Schematic overview of the cellular and molecular mechanisms involved in the cancer progression, including the proposed cellular and molecular mechanisms in cancer cells trajectory. AT1: alveolar type 1 cells; AT2: alveolar type 2 cells; AAH: atypical adenomatous hyperplasia; AIS: adenocarcinoma in situ; MIA: minimally invasive adenocarcinoma; IA: invasive adenocarcinoma; EMT: epithelial-mesenchymal transition

Home

Download

Statistics

Help

Contact

Center for Computational Systems Medicine
leaf

Gene summary

leaf

Malignant transformation analysis

leaf

Malignant transformation related pathway analysis

leaf

Cell-cell communication analysis

leaf

Single-cell gene regulatory network inference analysis

leaf

Somatic mutation of malignant transformation related genes

leaf

Related drugs of malignant transformation related genes

Gene: LIMA1

Gene summary for LIMA1

check button Gene summary.

Gene informationSpeciesHuman
Gene symbol

LIMA1

Gene ID

51474

Gene nameLIM domain and actin binding 1
Gene AliasEPLIN
Cytomap12q13.12
Gene Typeprotein-coding
GO ID

GO:0003008

UniProtAcc

Q9UHB6


Top

Malignant transformation analysis

check button Identification of the aberrant gene expression in precancerous and cancerous lesions by comparing the gene expression of stem-like cells in diseased tissues with normal stem cells
check button Malignant transformation involving gene list.
Entrez IDSymbolReplicatesSpeciesOrganTissueAdj P-valueLog2FCMalignancy
51474LIMA1HTA11_3410_2000001011HumanColorectumAD4.64e-07-4.28e-010.0155
51474LIMA1HTA11_2487_2000001011HumanColorectumSER5.42e-034.86e-01-0.1808
51474LIMA1HTA11_1938_2000001011HumanColorectumAD1.02e-149.08e-01-0.0811
51474LIMA1HTA11_78_2000001011HumanColorectumAD4.36e-108.84e-01-0.1088
51474LIMA1HTA11_347_2000001011HumanColorectumAD4.31e-471.47e+00-0.1954
51474LIMA1HTA11_411_2000001011HumanColorectumSER9.42e-231.43e+00-0.2602
51474LIMA1HTA11_83_2000001011HumanColorectumSER3.29e-171.11e+00-0.1526
51474LIMA1HTA11_696_2000001011HumanColorectumAD1.04e-097.41e-01-0.1464
51474LIMA1HTA11_866_2000001011HumanColorectumAD4.67e-107.02e-01-0.1001
51474LIMA1HTA11_1391_2000001011HumanColorectumAD7.08e-111.17e+00-0.059
51474LIMA1HTA11_2992_2000001011HumanColorectumSER6.10e-035.73e-01-0.1706
51474LIMA1HTA11_5212_2000001011HumanColorectumAD5.54e-035.95e-01-0.2061
51474LIMA1HTA11_546_2000001011HumanColorectumAD2.13e-025.40e-01-0.0842
51474LIMA1HTA11_866_3004761011HumanColorectumAD2.86e-04-5.25e-010.096
51474LIMA1HTA11_6818_2000001021HumanColorectumAD9.71e-07-6.40e-010.0588
51474LIMA1HTA11_99999970781_79442HumanColorectumMSS4.31e-16-5.79e-010.294
51474LIMA1HTA11_99999971662_82457HumanColorectumMSS2.57e-21-6.03e-010.3859
51474LIMA1HTA11_99999973899_84307HumanColorectumMSS1.93e-11-8.36e-010.2585
51474LIMA1HTA11_99999974143_84620HumanColorectumMSS4.57e-38-8.52e-010.3005
51474LIMA1F007HumanColorectumFAP4.81e-06-5.95e-010.1176
Page: 1 2 3 4 5 6 7 8 9 10 11 12 

check button Transcriptomic changes along malignancy continuum.
TissueExpression DynamicsAbbreviation
Colorectum (GSE201348)The image shows the transcriptomic changes along malignancy continuum.log2FC in expression of this searched gene in stem-like cells from each diseased tissue sample relative to stem-like cells in normal samples in each tissue plotted against the malignancy continuum. Samples are colored based on if they are from different disease stage.FAP: Familial adenomatous polyposis
CRC: Colorectal cancer
Colorectum (HTA11)The image shows the transcriptomic changes along malignancy continuum.log2FC in expression of this searched gene in stem-like cells from each diseased tissue sample relative to stem-like cells in normal samples in each tissue plotted against the malignancy continuum. Samples are colored based on if they are from different disease stage.AD: Adenomas
SER: Sessile serrated lesions
MSI-H: Microsatellite-high colorectal cancer
MSS: Microsatellite stable colorectal cancer
EsophagusThe image shows the transcriptomic changes along malignancy continuum.log2FC in expression of this searched gene in stem-like cells from each diseased tissue sample relative to stem-like cells in normal samples in each tissue plotted against the malignancy continuum. Samples are colored based on if they are from different disease stage.
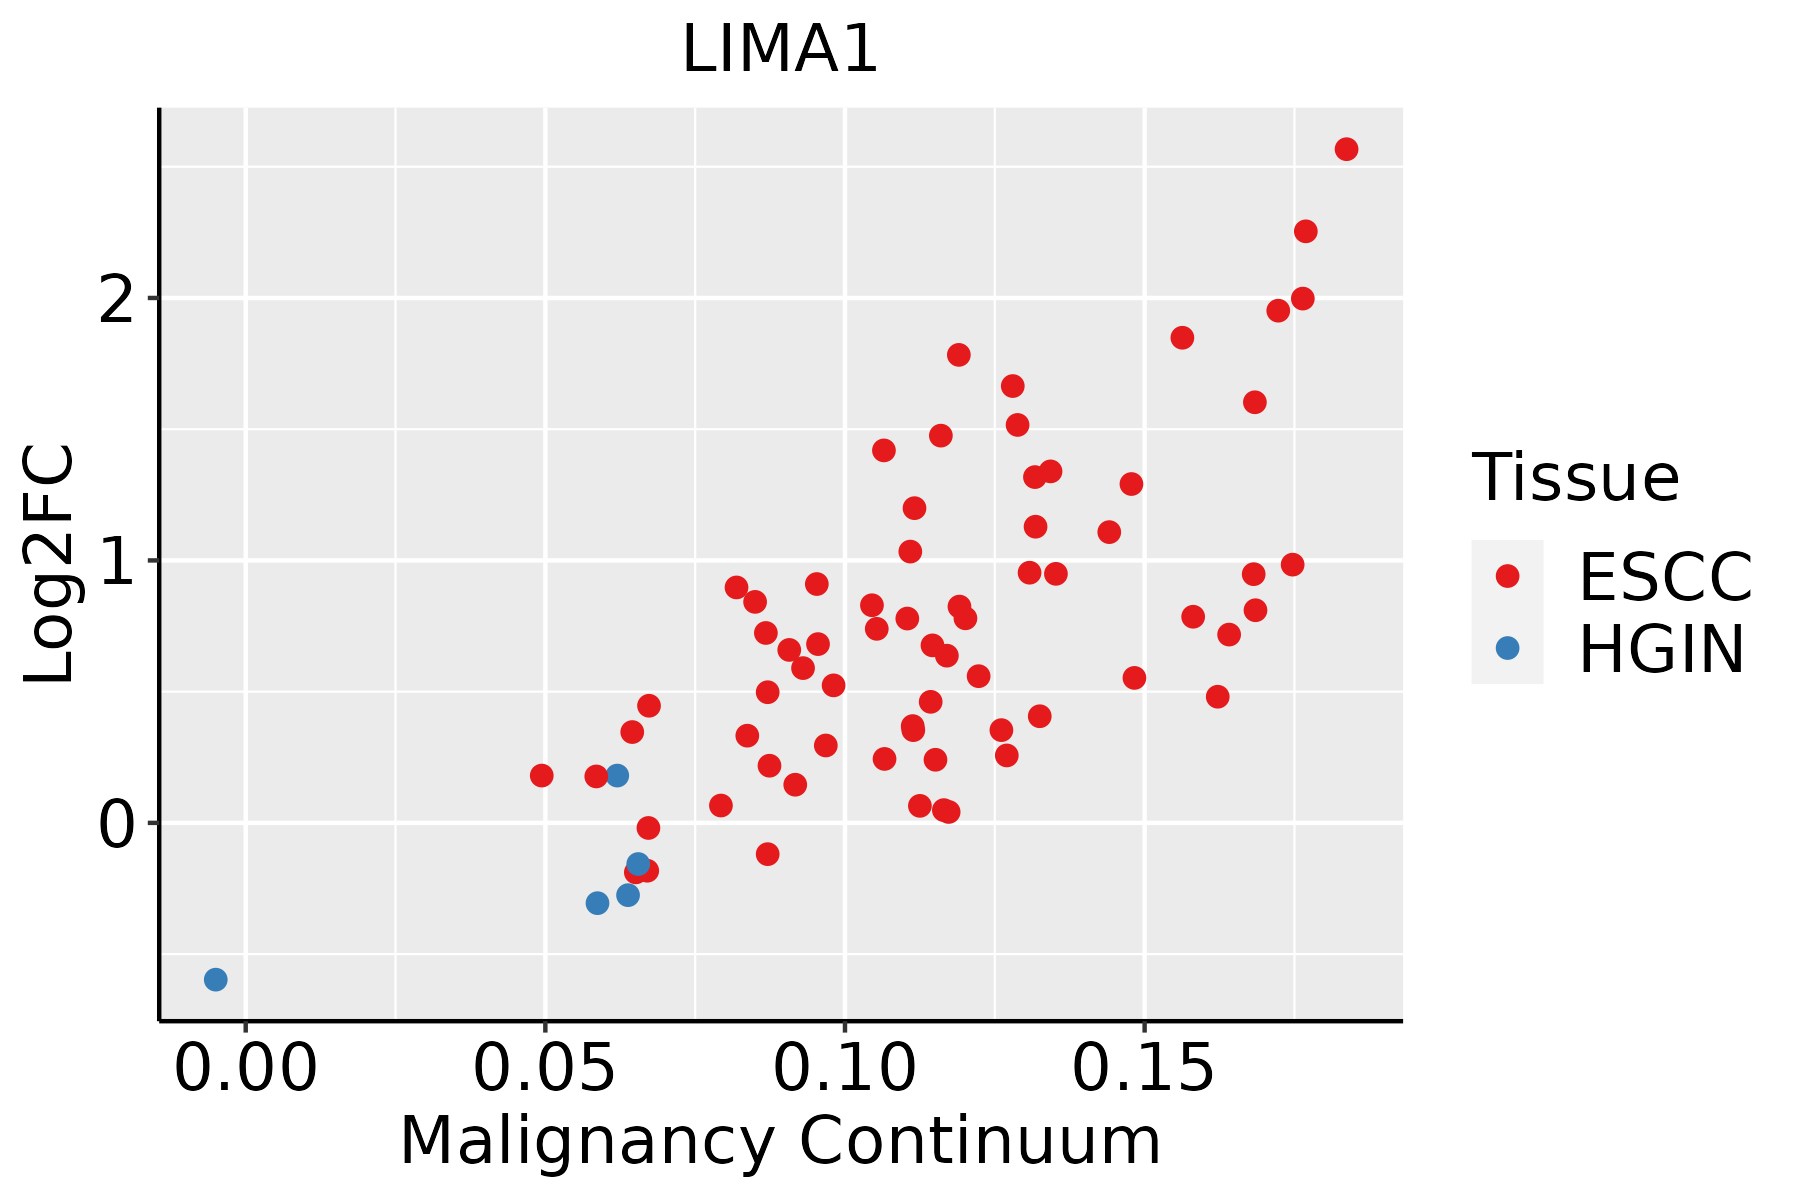
ESCC: Esophageal squamous cell carcinoma
HGIN: High-grade intraepithelial neoplasias
LGIN: Low-grade intraepithelial neoplasias
GCThe image shows the transcriptomic changes along malignancy continuum.log2FC in expression of this searched gene in stem-like cells from each diseased tissue sample relative to stem-like cells in normal samples in each tissue plotted against the malignancy continuum. Samples are colored based on if they are from different disease stage.
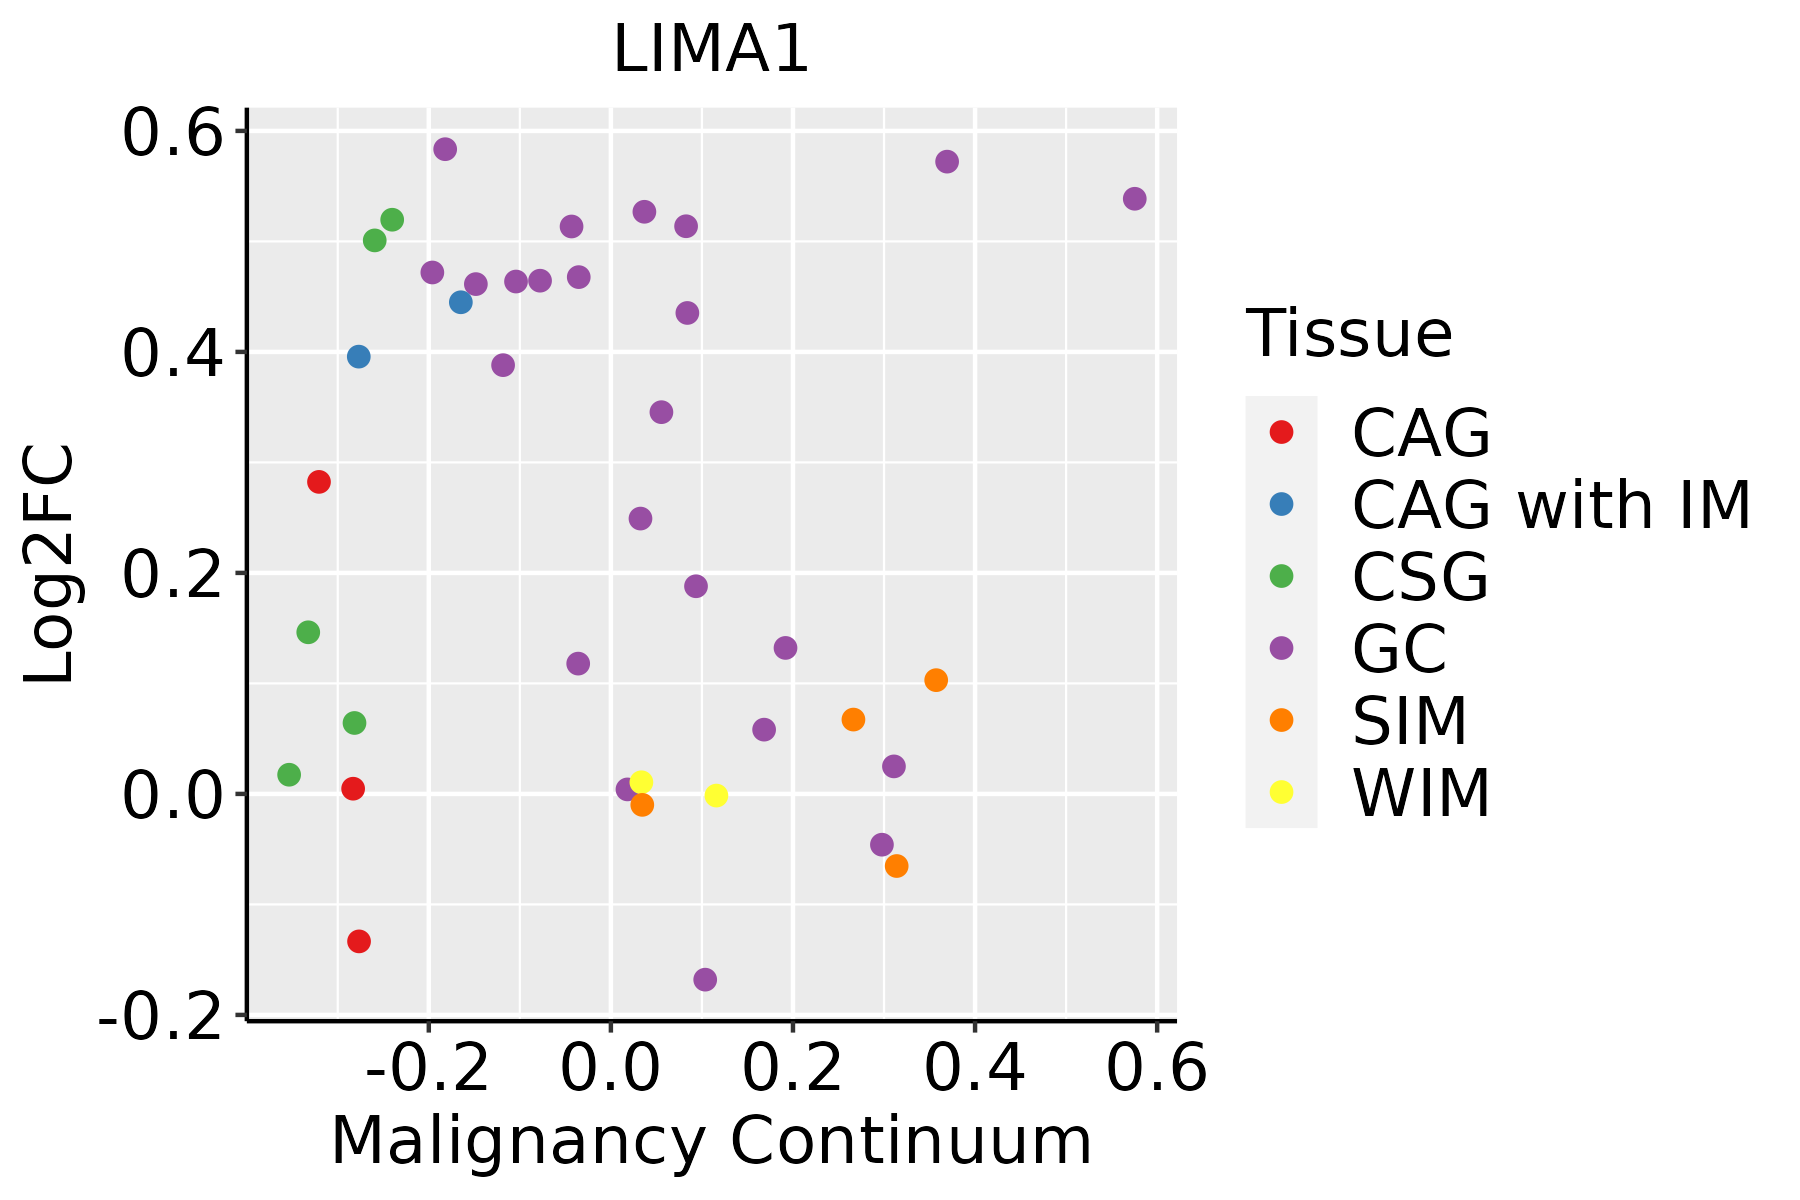
CAG: Chronic atrophic gastritis
CAG with IM: Chronic atrophic gastritis with intestinal metaplasia
CSG: Chronic superficial gastritis
GC: Gastric cancer
SIM: Severe intestinal metaplasia
WIM: Wild intestinal metaplasia
LiverThe image shows the transcriptomic changes along malignancy continuum.log2FC in expression of this searched gene in stem-like cells from each diseased tissue sample relative to stem-like cells in normal samples in each tissue plotted against the malignancy continuum. Samples are colored based on if they are from different disease stage.HCC: Hepatocellular carcinoma
NAFLD: Non-alcoholic fatty liver disease
LungThe image shows the transcriptomic changes along malignancy continuum.log2FC in expression of this searched gene in stem-like cells from each diseased tissue sample relative to stem-like cells in normal samples in each tissue plotted against the malignancy continuum. Samples are colored based on if they are from different disease stage.
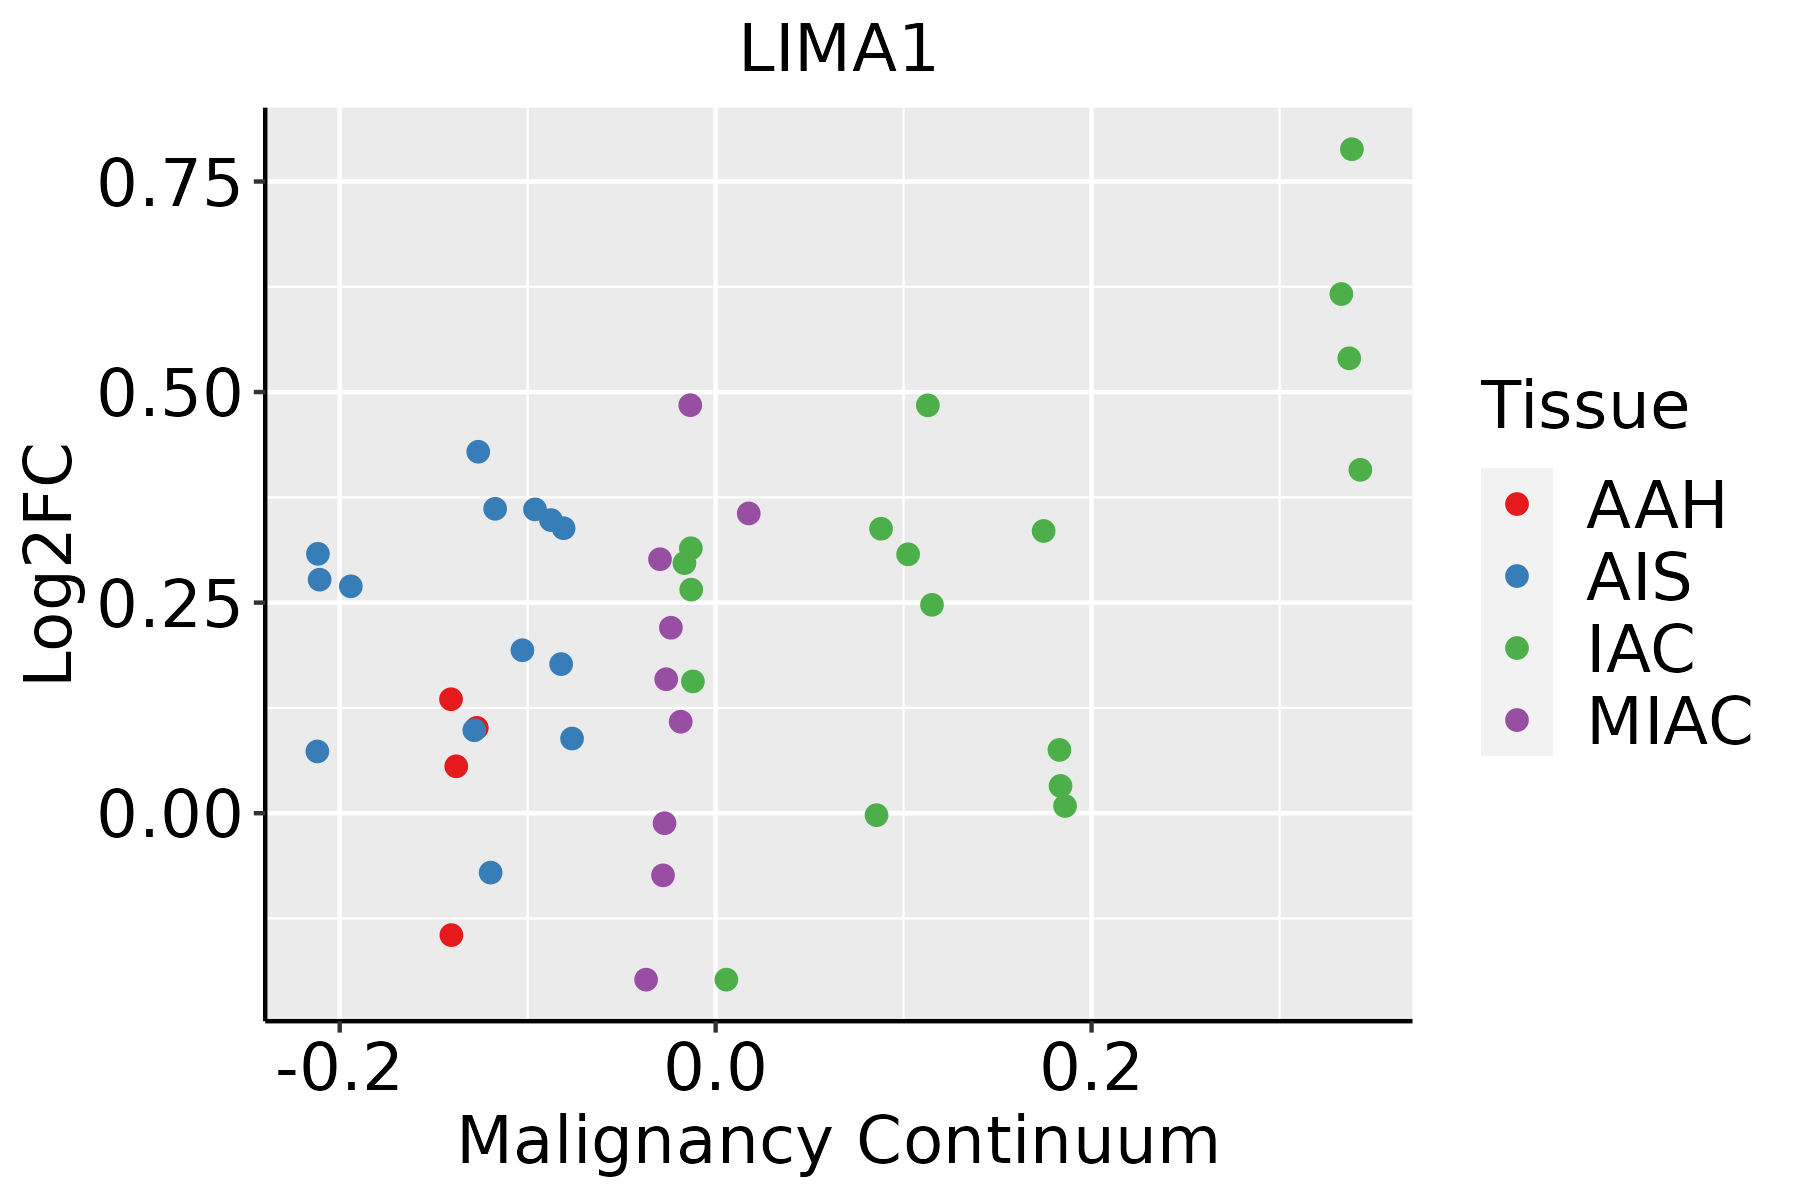
AAH: Atypical adenomatous hyperplasia
AIS: Adenocarcinoma in situ
IAC: Invasive lung adenocarcinoma
MIA: Minimally invasive adenocarcinoma
Oral CavityThe image shows the transcriptomic changes along malignancy continuum.log2FC in expression of this searched gene in stem-like cells from each diseased tissue sample relative to stem-like cells in normal samples in each tissue plotted against the malignancy continuum. Samples are colored based on if they are from different disease stage.EOLP: Erosive Oral lichen planus
LP: leukoplakia
NEOLP: Non-erosive oral lichen planus
OSCC: Oral squamous cell carcinoma
ProstateThe image shows the transcriptomic changes along malignancy continuum.log2FC in expression of this searched gene in stem-like cells from each diseased tissue sample relative to stem-like cells in normal samples in each tissue plotted against the malignancy continuum. Samples are colored based on if they are from different disease stage.
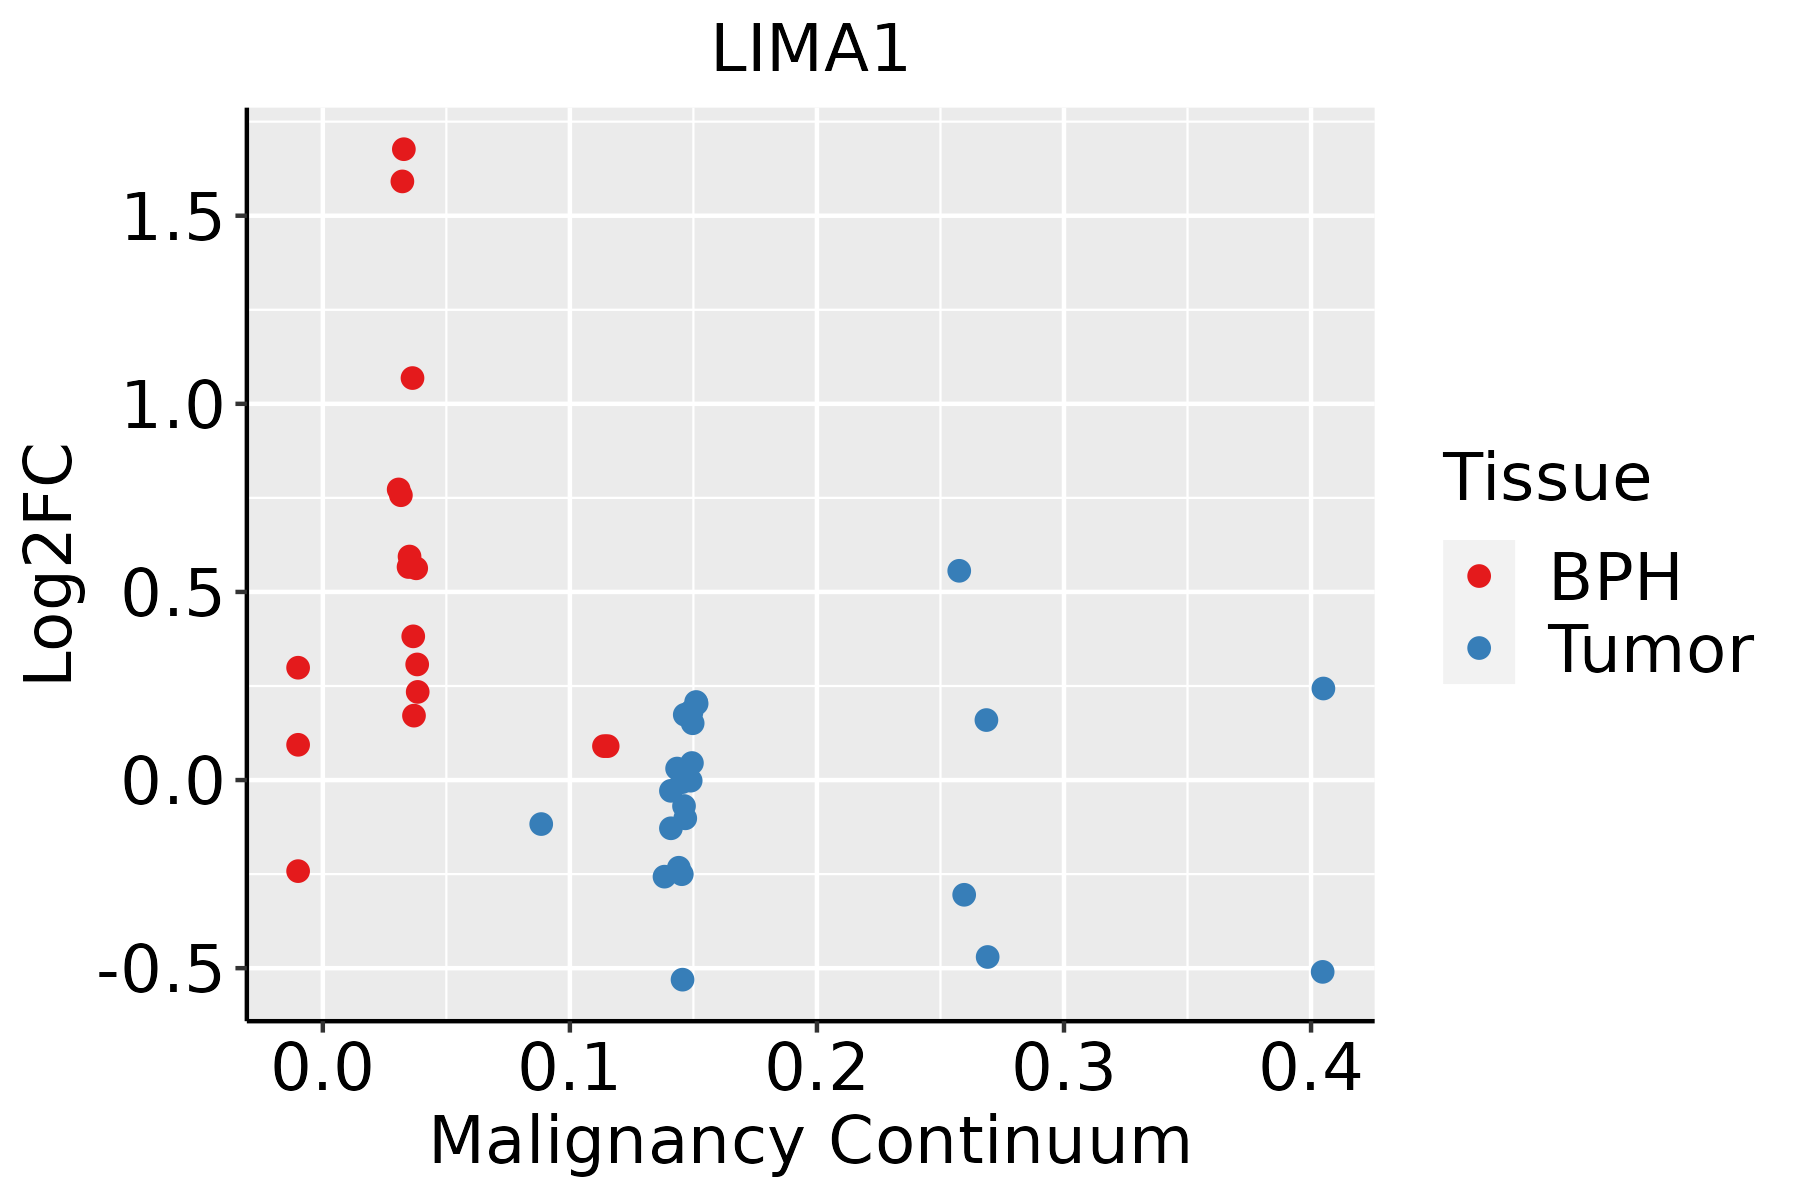
BPH: Benign Prostatic Hyperplasia
SkinThe image shows the transcriptomic changes along malignancy continuum.log2FC in expression of this searched gene in stem-like cells from each diseased tissue sample relative to stem-like cells in normal samples in each tissue plotted against the malignancy continuum. Samples are colored based on if they are from different disease stage.AK: Actinic keratosis
cSCC: Cutaneous squamous cell carcinoma
SCCIS:squamous cell carcinoma in situ
ThyroidThe image shows the transcriptomic changes along malignancy continuum.log2FC in expression of this searched gene in stem-like cells from each diseased tissue sample relative to stem-like cells in normal samples in each tissue plotted against the malignancy continuum. Samples are colored based on if they are from different disease stage.ATC: Anaplastic thyroid cancer
HT: Hashimoto's thyroiditis
PTC: Papillary thyroid cancer
∗log2FC in expression of this searched gene in stem-like cells from each diseased tissue sample relative to stem-like cells in normal samples in each tissue plotted against the malignancy continuum. Samples are colored based on if they are from different disease stage.

Top

Malignant transformation related pathway analysis

check buttonFind out the enriched GO biological processes and KEGG pathways involved in transition from healthy to precancer to cancer
check button Figure of enriched GO biological processes.
TissueDisease StageEnriched GO biological Processes
ColorectumADGO analysis - Figure of enriched GO biological processes: Top 15 enriched GO BP terms are showed in the bar plot of each disease state in each tissue. Each row represents a significant GO biological process which is colored according to the -log10(p.adjust).
ColorectumSERGO analysis - Figure of enriched GO biological processes: Top 15 enriched GO BP terms are showed in the bar plot of each disease state in each tissue. Each row represents a significant GO biological process which is colored according to the -log10(p.adjust).
ColorectumMSSGO analysis - Figure of enriched GO biological processes: Top 15 enriched GO BP terms are showed in the bar plot of each disease state in each tissue. Each row represents a significant GO biological process which is colored according to the -log10(p.adjust).
ColorectumMSI-HGO analysis - Figure of enriched GO biological processes: Top 15 enriched GO BP terms are showed in the bar plot of each disease state in each tissue. Each row represents a significant GO biological process which is colored according to the -log10(p.adjust).
ColorectumFAPGO analysis - Figure of enriched GO biological processes: Top 15 enriched GO BP terms are showed in the bar plot of each disease state in each tissue. Each row represents a significant GO biological process which is colored according to the -log10(p.adjust).
∗Top 15 enriched GO BP terms are showed in the bar plot of each disease state in each tissue. Each row represents a significant GO biological process which is colored according to the -log10(p.adjust).
Page: 1 2 3 4 5 6 7 8 9 

check button Enriched GO biological processes.
GO IDTissueDisease StageDescriptionGene RatioBg Ratiopvaluep.adjustCount
GO:0007015ColorectumADactin filament organization167/3918442/187231.65e-167.94e-14167
GO:0032535ColorectumADregulation of cellular component size142/3918383/187231.74e-133.41e-11142
GO:1902903ColorectumADregulation of supramolecular fiber organization139/3918383/187232.01e-123.19e-10139
GO:0032970ColorectumADregulation of actin filament-based process142/3918397/187234.05e-125.90e-10142
GO:0110053ColorectumADregulation of actin filament organization108/3918278/187235.02e-126.98e-10108
GO:0008154ColorectumADactin polymerization or depolymerization90/3918218/187236.14e-128.23e-1090
GO:0008064ColorectumADregulation of actin polymerization or depolymerization79/3918188/187234.17e-114.74e-0979
GO:0030832ColorectumADregulation of actin filament length79/3918189/187235.71e-116.27e-0979
GO:0032956ColorectumADregulation of actin cytoskeleton organization127/3918358/187231.03e-101.04e-08127
GO:0022411ColorectumADcellular component disassembly147/3918443/187238.53e-106.76e-08147
GO:0032984ColorectumADprotein-containing complex disassembly81/3918224/187239.41e-084.65e-0681
GO:0010639ColorectumADnegative regulation of organelle organization114/3918348/187231.41e-076.49e-06114
GO:0061572ColorectumADactin filament bundle organization60/3918161/187231.33e-064.23e-0560
GO:0051017ColorectumADactin filament bundle assembly58/3918157/187232.74e-067.89e-0558
GO:1902904ColorectumADnegative regulation of supramolecular fiber organization60/3918167/187235.23e-061.35e-0460
GO:0051494ColorectumADnegative regulation of cytoskeleton organization58/3918163/187231.04e-052.40e-0458
GO:0030042ColorectumADactin filament depolymerization27/391859/187231.65e-053.47e-0427
GO:0006066ColorectumADalcohol metabolic process106/3918353/187233.02e-055.57e-04106
GO:0030834ColorectumADregulation of actin filament depolymerization24/391854/187238.58e-051.33e-0324
GO:0030835ColorectumADnegative regulation of actin filament depolymerization20/391845/187233.28e-043.86e-0320
Page: 1 2 3 4 5 6 7 8 9 10 11 12 13 14 15 16 17 18 19 20 21 22 23 24 25 26 

check button Enriched KEGG pathways.
Pathway IDTissueDisease StageDescriptionGene RatioBg Ratiopvaluep.adjustqvalueCount
Page: 1 

Top

Cell-cell communication analysis

check buttonIdentification of potential cell-cell interactions between two cell types and their ligand-receptor pairs for different disease states
LigandReceptorLRpairPathwayTissueDisease Stage
Page: 1 

Top

Single-cell gene regulatory network inference analysis

check buttonFind out the significant the regulons (TFs) and the target genes of each regulon across cell types for different disease states
TFCell TypeTissueDisease StageTarget GeneRSSRegulon Activity
∗The dot plots of a searched regulon are shown for all cell subpopulations in each disease state of each tissue based on the regulon specific score inferred using pySCENIC and by calculating the average expression.
Page: 1 

Top

Somatic mutation of malignant transformation related genes

check buttonAnnotation of somatic variants for genes involved in malignant transformation
Hugo SymbolVariant ClassVariant ClassificationdbSNP RSHGVScHGVSpHGVSp ShortSWISSPROTBIOTYPESIFTPolyPhenTumor Sample BarcodeTissueHistologySexAgeStageTherapy TypesDrugsOutcome
LIMA1SNVMissense_Mutationc.578C>Ap.Pro193Glnp.P193QQ9UHB6protein_codingdeleterious(0)probably_damaging(0.988)TCGA-A2-A25A-01Breastbreast invasive carcinomaFemale<65I/IIUnspecificCytoxanSD
LIMA1SNVMissense_Mutationc.772N>Cp.Glu258Glnp.E258QQ9UHB6protein_codingdeleterious(0.01)possibly_damaging(0.71)TCGA-A8-A095-01Breastbreast invasive carcinomaFemale<65I/IIChemotherapy5-fluorouracilCR
LIMA1SNVMissense_Mutationc.2275N>Ap.Glu759Lysp.E759KQ9UHB6protein_codingdeleterious(0.02)possibly_damaging(0.476)TCGA-AC-A23H-01Breastbreast invasive carcinomaFemale>=65I/IIUnknownUnknownPD
LIMA1SNVMissense_Mutationrs763276725c.889N>Ap.Glu297Lysp.E297KQ9UHB6protein_codingdeleterious(0.04)probably_damaging(0.996)TCGA-AN-A046-01Breastbreast invasive carcinomaFemale>=65I/IIUnknownUnknownSD
LIMA1SNVMissense_Mutationc.1943A>Gp.Asn648Serp.N648SQ9UHB6protein_codingtolerated(1)benign(0)TCGA-AO-A128-01Breastbreast invasive carcinomaFemale<65I/IIChemotherapydoxorubicinSD
LIMA1SNVMissense_Mutationc.178N>Gp.Leu60Valp.L60VQ9UHB6protein_codingtolerated(0.09)benign(0.156)TCGA-BH-A0HP-01Breastbreast invasive carcinomaFemale>=65III/IVChemotherapydoxorubicinSD
LIMA1SNVMissense_Mutationnovelc.823N>Ap.Gln275Lysp.Q275KQ9UHB6protein_codingdeleterious(0)probably_damaging(0.99)TCGA-S3-AA11-01Breastbreast invasive carcinomaFemale>=65I/IIHormone TherapyletrozoleCR
LIMA1SNVMissense_Mutationnovelc.1066N>Tp.Pro356Serp.P356SQ9UHB6protein_codingtolerated(0.3)benign(0.01)TCGA-2W-A8YY-01Cervixcervical & endocervical cancerFemale<65I/IIChemotherapycisplatinCR
LIMA1SNVMissense_Mutationc.150G>Ap.Met50Ilep.M50IQ9UHB6protein_codingtolerated(0.49)benign(0.023)TCGA-C5-A1BL-01Cervixcervical & endocervical cancerFemale<65I/IIUnknownUnknownSD
LIMA1SNVMissense_Mutationrs781115938c.1717N>Ap.Asp573Asnp.D573NQ9UHB6protein_codingdeleterious(0.03)probably_damaging(0.985)TCGA-EK-A2RO-01Cervixcervical & endocervical cancerFemale<65I/IIUnknownUnknownSD
Page: 1 2 3 4 5 6 7 8 

Top

Related drugs of malignant transformation related genes

check buttonIdentification of chemicals and drugs interact with genes involved in malignant transfromation
(DGIdb 4.0)
Entrez IDSymbolCategoryInteraction TypesDrug Claim NameDrug NamePMIDs
Page: 1