
|
|||||
|
 | |
| |
| |
| |
| |
| |
|
Gene: LILRB1 |
Gene summary for LILRB1 |
| Gene information | Species | Human | Gene symbol | LILRB1 | Gene ID | 10859 |
| Gene name | leukocyte immunoglobulin like receptor B1 | |
| Gene Alias | CD85J | |
| Cytomap | 19q13.42 | |
| Gene Type | protein-coding | GO ID | GO:0001501 | UniProtAcc | A0A087WSV6 |
Top |
Malignant transformation analysis |
| Identification of the aberrant gene expression in precancerous and cancerous lesions by comparing the gene expression of stem-like cells in diseased tissues with normal stem cells |
| Entrez ID | Symbol | Replicates | Species | Organ | Tissue | Adj P-value | Log2FC | Malignancy |
| 10859 | LILRB1 | HCC1 | Human | Liver | HCC | 1.17e-09 | 8.65e-01 | 0.5336 |
| 10859 | LILRB1 | HCC2 | Human | Liver | HCC | 6.10e-25 | 1.82e+00 | 0.5341 |
| 10859 | LILRB1 | HCC5 | Human | Liver | HCC | 2.21e-11 | 1.57e+00 | 0.4932 |
| 10859 | LILRB1 | Pt13.c | Human | Liver | HCC | 2.85e-03 | 2.59e-01 | 0.0076 |
| 10859 | LILRB1 | Pt14.d | Human | Liver | HCC | 4.57e-04 | 1.62e-01 | 0.0143 |
| Page: 1 |
| Tissue | Expression Dynamics | Abbreviation |
| Liver | 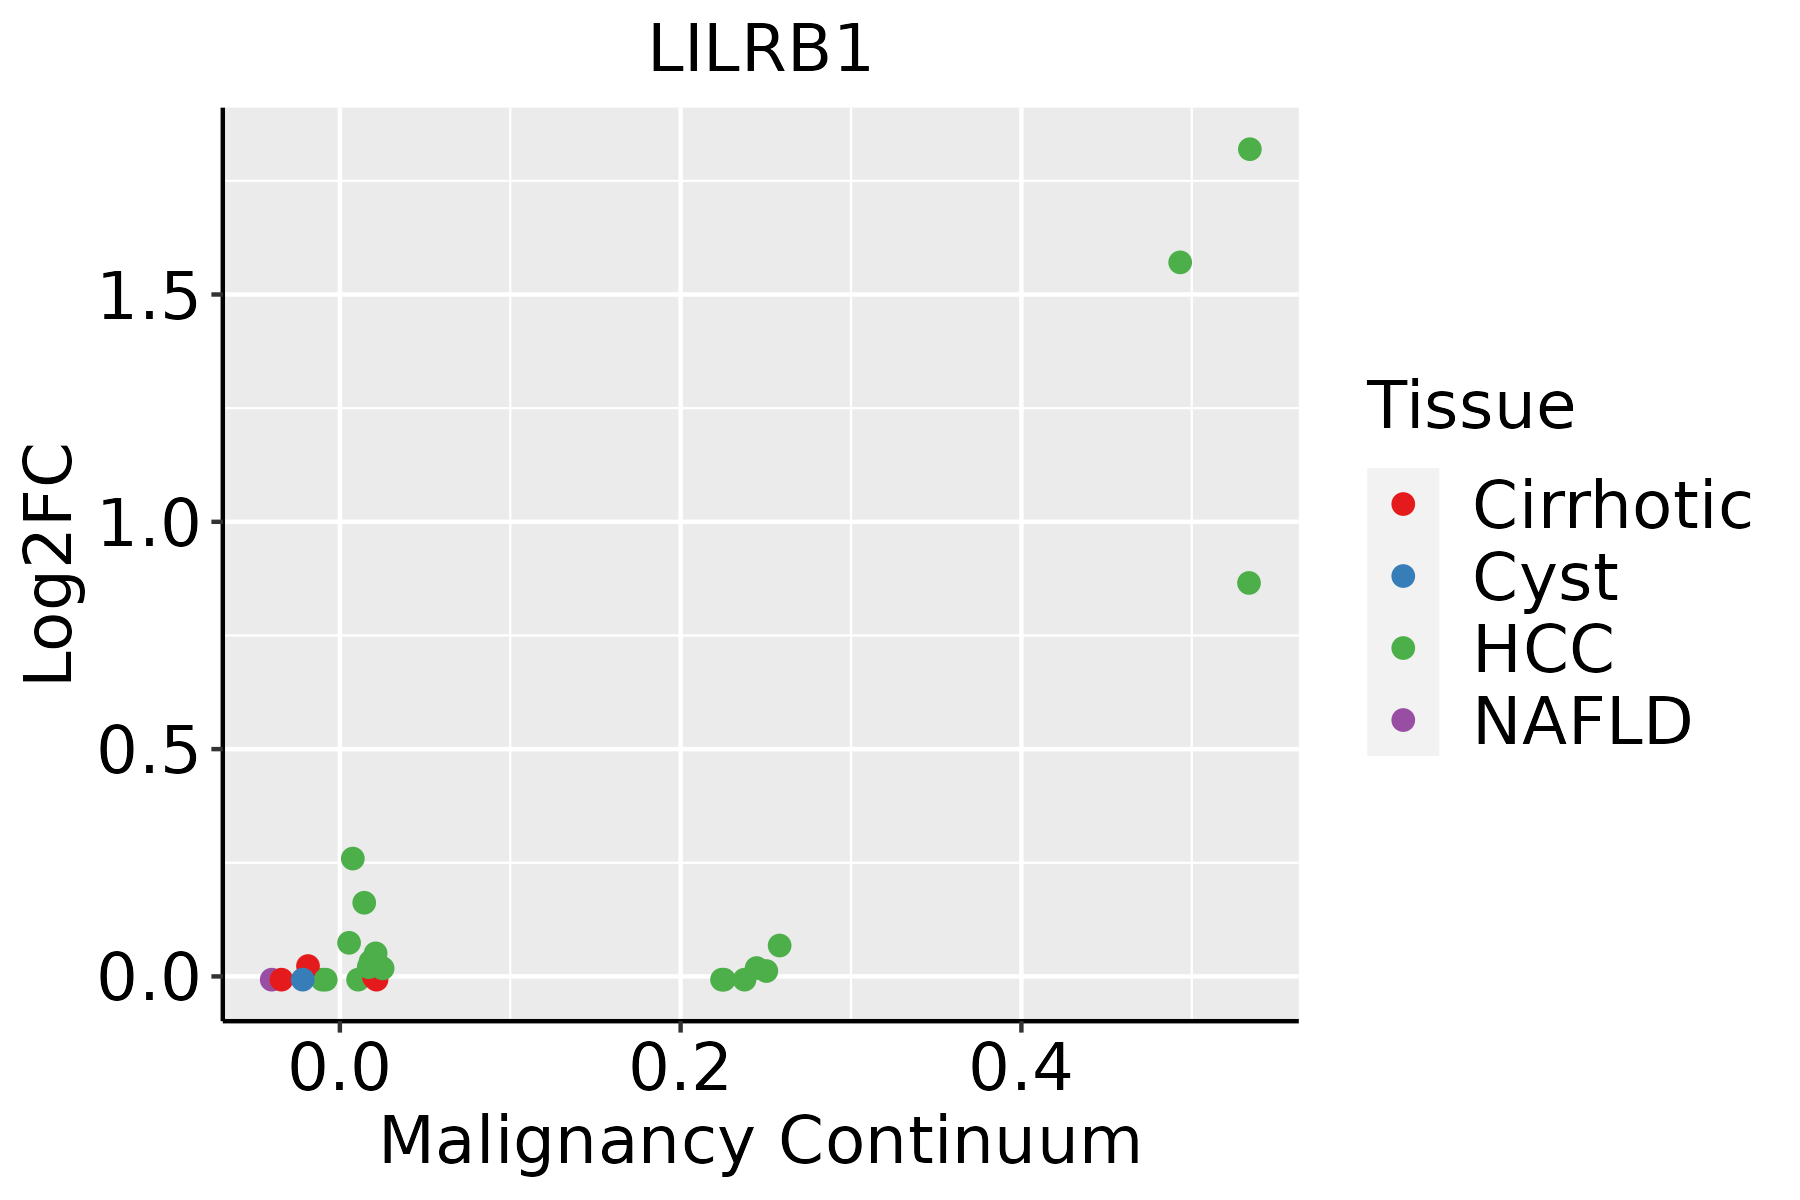 | HCC: Hepatocellular carcinoma |
| NAFLD: Non-alcoholic fatty liver disease |
| ∗log2FC in expression of this searched gene in stem-like cells from each diseased tissue sample relative to stem-like cells in normal samples in each tissue plotted against the malignancy continuum. Samples are colored based on if they are from different disease stage. |
Top |
Malignant transformation related pathway analysis |
| Find out the enriched GO biological processes and KEGG pathways involved in transition from healthy to precancer to cancer |
| Tissue | Disease Stage | Enriched GO biological Processes |
| Colorectum | AD |  |
| Colorectum | SER |  |
| Colorectum | MSS |  |
| Colorectum | MSI-H |  |
| Colorectum | FAP |  |
| ∗Top 15 enriched GO BP terms are showed in the bar plot of each disease state in each tissue. Each row represents a significant GO biological process which is colored according to the -log10(p.adjust). |
| Page: 1 2 3 4 5 6 7 8 9 |
| GO ID | Tissue | Disease Stage | Description | Gene Ratio | Bg Ratio | pvalue | p.adjust | Count |
| GO:000961511 | Liver | HCC | response to virus | 210/7958 | 367/18723 | 7.32e-09 | 1.86e-07 | 210 |
| GO:00516071 | Liver | HCC | defense response to virus | 151/7958 | 265/18723 | 1.27e-06 | 1.85e-05 | 151 |
| GO:01405461 | Liver | HCC | defense response to symbiont | 151/7958 | 265/18723 | 1.27e-06 | 1.85e-05 | 151 |
| GO:0045786 | Liver | HCC | negative regulation of cell cycle | 204/7958 | 385/18723 | 1.84e-05 | 1.99e-04 | 204 |
| GO:0032479 | Liver | HCC | regulation of type I interferon production | 60/7958 | 95/18723 | 3.84e-05 | 3.80e-04 | 60 |
| GO:0032606 | Liver | HCC | type I interferon production | 60/7958 | 95/18723 | 3.84e-05 | 3.80e-04 | 60 |
| GO:003009922 | Liver | HCC | myeloid cell differentiation | 200/7958 | 381/18723 | 4.64e-05 | 4.49e-04 | 200 |
| GO:004311221 | Liver | HCC | receptor metabolic process | 96/7958 | 166/18723 | 4.69e-05 | 4.50e-04 | 96 |
| GO:000689821 | Liver | HCC | receptor-mediated endocytosis | 134/7958 | 244/18723 | 5.73e-05 | 5.31e-04 | 134 |
| GO:00028321 | Liver | HCC | negative regulation of response to biotic stimulus | 66/7958 | 108/18723 | 7.24e-05 | 6.50e-04 | 66 |
| GO:00028312 | Liver | HCC | regulation of response to biotic stimulus | 173/7958 | 327/18723 | 8.55e-05 | 7.48e-04 | 173 |
| GO:003010021 | Liver | HCC | regulation of endocytosis | 117/7958 | 211/18723 | 9.56e-05 | 8.32e-04 | 117 |
| GO:003249611 | Liver | HCC | response to lipopolysaccharide | 174/7958 | 343/18723 | 1.19e-03 | 6.62e-03 | 174 |
| GO:00712166 | Liver | HCC | cellular response to biotic stimulus | 128/7958 | 246/18723 | 1.53e-03 | 8.10e-03 | 128 |
| GO:00712226 | Liver | HCC | cellular response to lipopolysaccharide | 110/7958 | 209/18723 | 1.92e-03 | 9.77e-03 | 110 |
| GO:004578512 | Liver | HCC | positive regulation of cell adhesion | 215/7958 | 437/18723 | 2.53e-03 | 1.22e-02 | 215 |
| GO:000223711 | Liver | HCC | response to molecule of bacterial origin | 181/7958 | 363/18723 | 2.58e-03 | 1.24e-02 | 181 |
| GO:00450881 | Liver | HCC | regulation of innate immune response | 113/7958 | 218/18723 | 3.27e-03 | 1.50e-02 | 113 |
| GO:0050688 | Liver | HCC | regulation of defense response to virus | 41/7958 | 69/18723 | 3.38e-03 | 1.54e-02 | 41 |
| GO:00458241 | Liver | HCC | negative regulation of innate immune response | 42/7958 | 71/18723 | 3.41e-03 | 1.55e-02 | 42 |
| Page: 1 2 |
| Pathway ID | Tissue | Disease Stage | Description | Gene Ratio | Bg Ratio | pvalue | p.adjust | qvalue | Count |
| Page: 1 |
Top |
Cell-cell communication analysis |
| Identification of potential cell-cell interactions between two cell types and their ligand-receptor pairs for different disease states |
| Ligand | Receptor | LRpair | Pathway | Tissue | Disease Stage |
| HLA-F | LILRB1 | HLA-F_LILRB1 | MHC-I | Breast | DCIS |
| HLA-F | LILRB1 | HLA-F_LILRB1 | MHC-I | Breast | Healthy |
| HLA-F | LILRB1 | HLA-F_LILRB1 | MHC-I | Cervix | CC |
| HLA-F | LILRB1 | HLA-F_LILRB1 | MHC-I | Cervix | Precancer |
| HLA-F | LILRB1 | HLA-F_LILRB1 | MHC-I | CRC | AD |
| HLA-F | LILRB1 | HLA-F_LILRB1 | MHC-I | CRC | SER |
| HLA-F | LILRB1 | HLA-F_LILRB1 | MHC-I | Endometrium | ADJ |
| HLA-F | LILRB1 | HLA-F_LILRB1 | MHC-I | Endometrium | EEC |
| HLA-F | LILRB1 | HLA-F_LILRB1 | MHC-I | Endometrium | Healthy |
| HLA-F | LILRB1 | HLA-F_LILRB1 | MHC-I | HNSCC | OSCC |
| HLA-F | LILRB1 | HLA-F_LILRB1 | MHC-I | Liver | HCC |
| HLA-F | LILRB1 | HLA-F_LILRB1 | MHC-I | Liver | Healthy |
| HLA-F | LILRB1 | HLA-F_LILRB1 | MHC-I | Liver | Precancer |
| HLA-F | LILRB1 | HLA-F_LILRB1 | MHC-I | Skin | cSCC |
| HLA-F | LILRB1 | HLA-F_LILRB1 | MHC-I | THCA | ADJ |
| HLA-F | LILRB1 | HLA-F_LILRB1 | MHC-I | THCA | Cancer |
| HLA-F | LILRB1 | HLA-F_LILRB1 | MHC-I | THCA | Precancer |
| HLA-F | LILRB1 | HLA-F_LILRB1 | MHC-I | THCA | PTC |
| Page: 1 |
Top |
Single-cell gene regulatory network inference analysis |
| Find out the significant the regulons (TFs) and the target genes of each regulon across cell types for different disease states |
| TF | Cell Type | Tissue | Disease Stage | Target Gene | RSS | Regulon Activity |
| ∗The dot plots of a searched regulon are shown for all cell subpopulations in each disease state of each tissue based on the regulon specific score inferred using pySCENIC and by calculating the average expression. |
| Page: 1 |
Top |
Somatic mutation of malignant transformation related genes |
| Annotation of somatic variants for genes involved in malignant transformation |
| Hugo Symbol | Variant Class | Variant Classification | dbSNP RS | HGVSc | HGVSp | HGVSp Short | SWISSPROT | BIOTYPE | SIFT | PolyPhen | Tumor Sample Barcode | Tissue | Histology | Sex | Age | Stage | Therapy Types | Drugs | Outcome |
| LILRB1 | SNV | Missense_Mutation | novel | c.761G>A | p.Arg254Lys | p.R254K | protein_coding | deleterious(0.03) | possibly_damaging(0.474) | TCGA-AC-A3W7-01 | Breast | breast invasive carcinoma | Female | >=65 | I/II | Hormone Therapy | femara | SD | |
| LILRB1 | SNV | Missense_Mutation | c.118N>T | p.Thr40Ser | p.T40S | protein_coding | tolerated(0.37) | benign(0) | TCGA-D8-A1XW-01 | Breast | breast invasive carcinoma | Female | <65 | I/II | Chemotherapy | adriamycin+cyclophosphamide | SD | ||
| LILRB1 | SNV | Missense_Mutation | rs376255659 | c.1103G>T | p.Arg368Leu | p.R368L | protein_coding | deleterious(0.03) | benign(0.313) | TCGA-E9-A295-01 | Breast | breast invasive carcinoma | Female | >=65 | I/II | Hormone Therapy | tamoxiphen | SD | |
| LILRB1 | SNV | Missense_Mutation | c.1597N>A | p.Leu533Ile | p.L533I | protein_coding | tolerated(0.06) | possibly_damaging(0.784) | TCGA-2W-A8YY-01 | Cervix | cervical & endocervical cancer | Female | <65 | I/II | Chemotherapy | cisplatin | CR | ||
| LILRB1 | SNV | Missense_Mutation | novel | c.330C>A | p.Ser110Arg | p.S110R | protein_coding | tolerated(0.59) | benign(0.011) | TCGA-FU-A3HY-01 | Cervix | cervical & endocervical cancer | Female | <65 | I/II | Chemotherapy | cisplatin | CR | |
| LILRB1 | SNV | Missense_Mutation | novel | c.1315N>A | p.Gly439Ser | p.G439S | protein_coding | tolerated(0.15) | benign(0.142) | TCGA-VS-A9V1-01 | Cervix | cervical & endocervical cancer | Female | <65 | I/II | Chemotherapy | cisplatin | PD | |
| LILRB1 | insertion | Frame_Shift_Ins | rs747328267 | c.1336_1337insC | p.Thr448HisfsTer54 | p.T448Hfs*54 | protein_coding | TCGA-MA-AA42-01 | Cervix | cervical & endocervical cancer | Female | >=65 | I/II | Unknown | Unknown | SD | |||
| LILRB1 | SNV | Missense_Mutation | rs776452488 | c.1047N>T | p.Gln349His | p.Q349H | protein_coding | tolerated(0.14) | possibly_damaging(0.754) | TCGA-A6-2686-01 | Colorectum | colon adenocarcinoma | Female | >=65 | I/II | Unknown | Unknown | SD | |
| LILRB1 | SNV | Missense_Mutation | c.733C>A | p.Gln245Lys | p.Q245K | protein_coding | deleterious(0.02) | probably_damaging(0.999) | TCGA-AA-3949-01 | Colorectum | colon adenocarcinoma | Female | >=65 | III/IV | Unknown | Unknown | SD | ||
| LILRB1 | SNV | Missense_Mutation | novel | c.181T>C | p.Tyr61His | p.Y61H | protein_coding | tolerated(0.52) | benign(0.062) | TCGA-AA-3984-01 | Colorectum | colon adenocarcinoma | Female | <65 | I/II | Unknown | Unknown | SD |
| Page: 1 2 3 4 5 6 7 8 9 10 11 |
Top |
Related drugs of malignant transformation related genes |
| Identification of chemicals and drugs interact with genes involved in malignant transfromation |
| (DGIdb 4.0) |
| Entrez ID | Symbol | Category | Interaction Types | Drug Claim Name | Drug Name | PMIDs |
| Page: 1 |

Copyright 2023-Present -The University of Texas Health Science Center at Houston |