
|
|||||
|
 | |
| |
| |
| |
| |
| |
|
Gene: LIG3 |
Gene summary for LIG3 |
| Gene information | Species | Human | Gene symbol | LIG3 | Gene ID | 3980 |
| Gene name | DNA ligase 3 | |
| Gene Alias | LIG2 | |
| Cytomap | 17q12 | |
| Gene Type | protein-coding | GO ID | GO:0000002 | UniProtAcc | P49916 |
Top |
Malignant transformation analysis |
| Identification of the aberrant gene expression in precancerous and cancerous lesions by comparing the gene expression of stem-like cells in diseased tissues with normal stem cells |
| Entrez ID | Symbol | Replicates | Species | Organ | Tissue | Adj P-value | Log2FC | Malignancy |
| 3980 | LIG3 | LZE4T | Human | Esophagus | ESCC | 5.51e-08 | 2.15e-01 | 0.0811 |
| 3980 | LIG3 | LZE5T | Human | Esophagus | ESCC | 1.40e-02 | 1.95e-01 | 0.0514 |
| 3980 | LIG3 | LZE7T | Human | Esophagus | ESCC | 7.90e-05 | 2.39e-01 | 0.0667 |
| 3980 | LIG3 | LZE8T | Human | Esophagus | ESCC | 5.69e-03 | 1.28e-01 | 0.067 |
| 3980 | LIG3 | LZE24T | Human | Esophagus | ESCC | 7.42e-17 | 3.70e-01 | 0.0596 |
| 3980 | LIG3 | LZE6T | Human | Esophagus | ESCC | 3.93e-02 | 1.45e-01 | 0.0845 |
| 3980 | LIG3 | P2T-E | Human | Esophagus | ESCC | 1.67e-19 | 3.88e-01 | 0.1177 |
| 3980 | LIG3 | P4T-E | Human | Esophagus | ESCC | 2.27e-12 | 2.70e-01 | 0.1323 |
| 3980 | LIG3 | P5T-E | Human | Esophagus | ESCC | 3.20e-13 | 1.67e-01 | 0.1327 |
| 3980 | LIG3 | P8T-E | Human | Esophagus | ESCC | 2.80e-08 | 1.67e-01 | 0.0889 |
| 3980 | LIG3 | P9T-E | Human | Esophagus | ESCC | 1.61e-07 | 1.42e-01 | 0.1131 |
| 3980 | LIG3 | P10T-E | Human | Esophagus | ESCC | 9.48e-18 | 1.57e-01 | 0.116 |
| 3980 | LIG3 | P11T-E | Human | Esophagus | ESCC | 2.09e-15 | 3.88e-01 | 0.1426 |
| 3980 | LIG3 | P12T-E | Human | Esophagus | ESCC | 1.07e-15 | 3.27e-01 | 0.1122 |
| 3980 | LIG3 | P15T-E | Human | Esophagus | ESCC | 1.61e-21 | 4.21e-01 | 0.1149 |
| 3980 | LIG3 | P16T-E | Human | Esophagus | ESCC | 1.56e-26 | 4.95e-01 | 0.1153 |
| 3980 | LIG3 | P17T-E | Human | Esophagus | ESCC | 2.47e-04 | 2.11e-01 | 0.1278 |
| 3980 | LIG3 | P19T-E | Human | Esophagus | ESCC | 2.32e-04 | 2.55e-01 | 0.1662 |
| 3980 | LIG3 | P20T-E | Human | Esophagus | ESCC | 3.03e-09 | 2.23e-01 | 0.1124 |
| 3980 | LIG3 | P21T-E | Human | Esophagus | ESCC | 1.94e-19 | 3.14e-01 | 0.1617 |
| Page: 1 2 3 4 |
| Tissue | Expression Dynamics | Abbreviation |
| Esophagus | 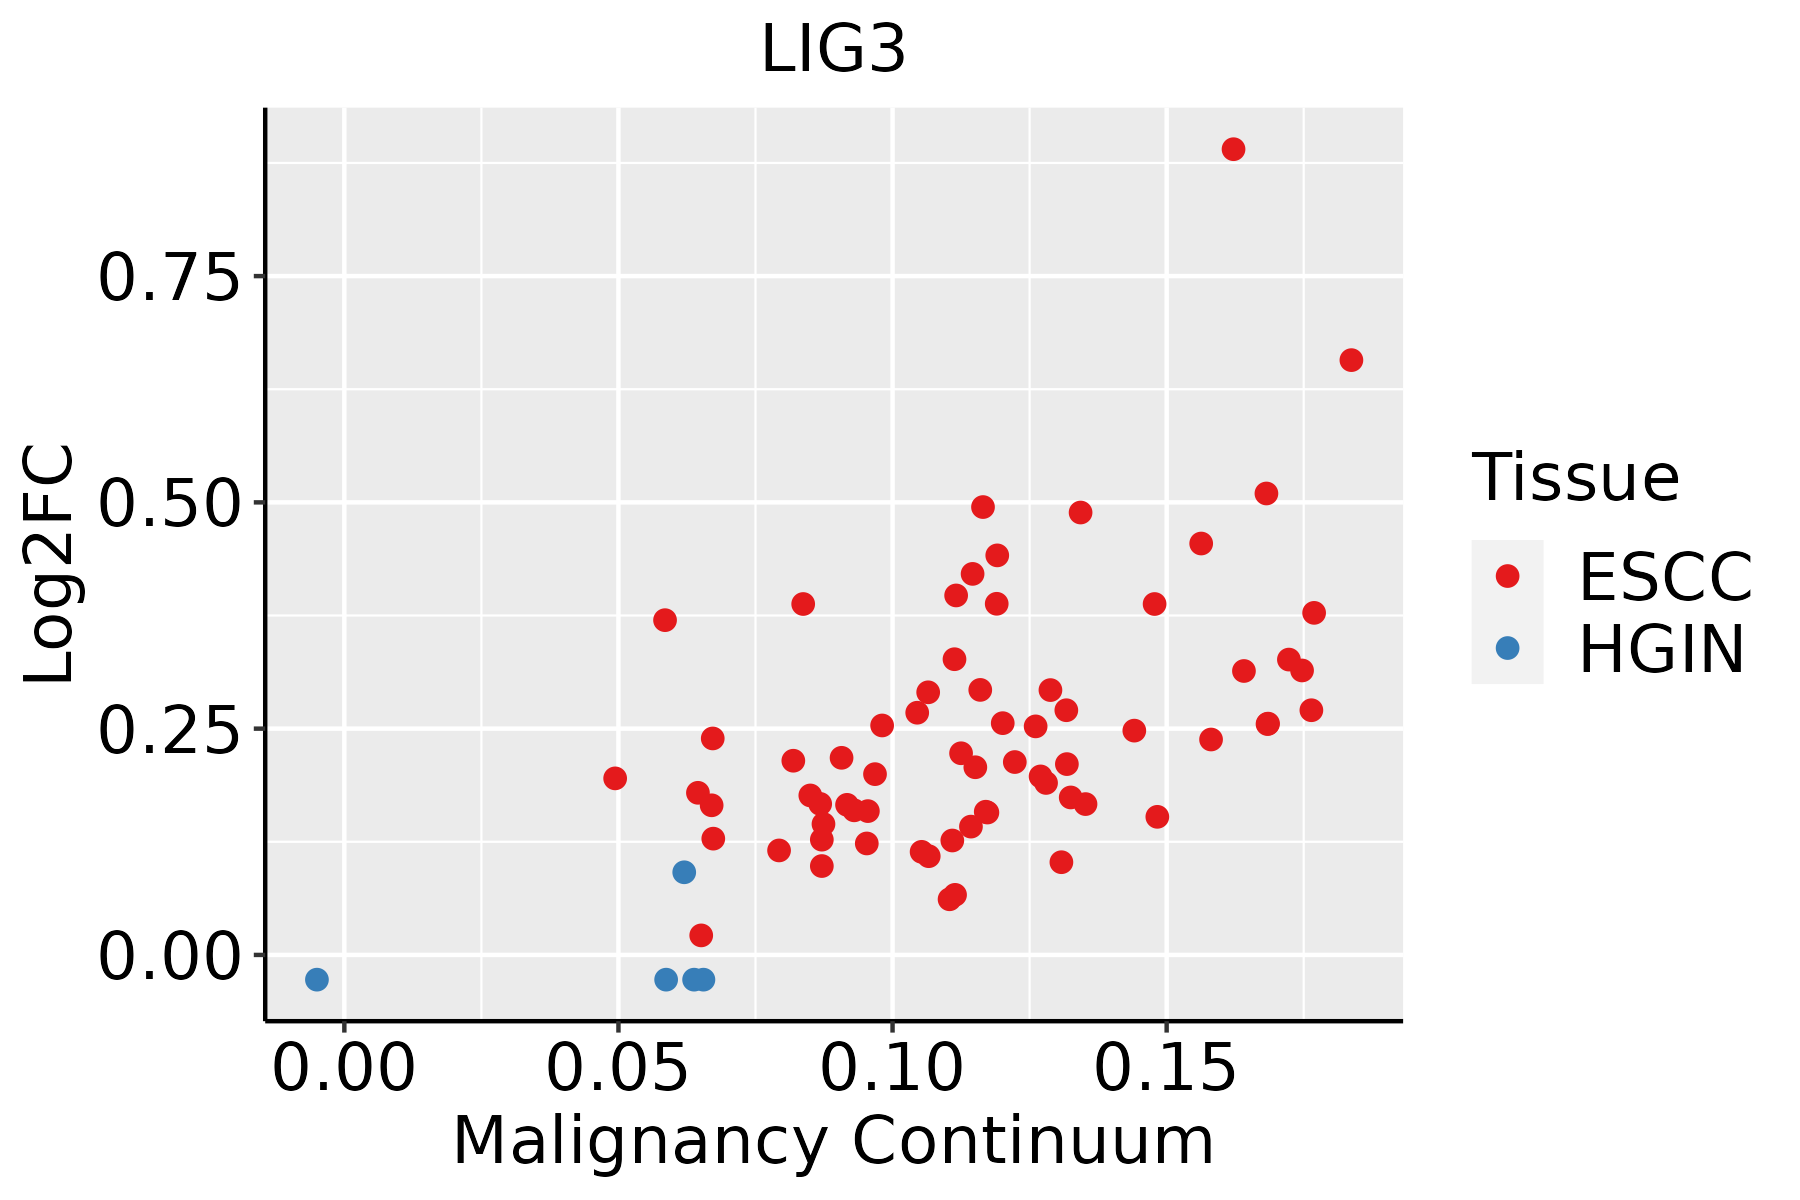 | ESCC: Esophageal squamous cell carcinoma |
| HGIN: High-grade intraepithelial neoplasias | ||
| LGIN: Low-grade intraepithelial neoplasias | ||
| Liver | 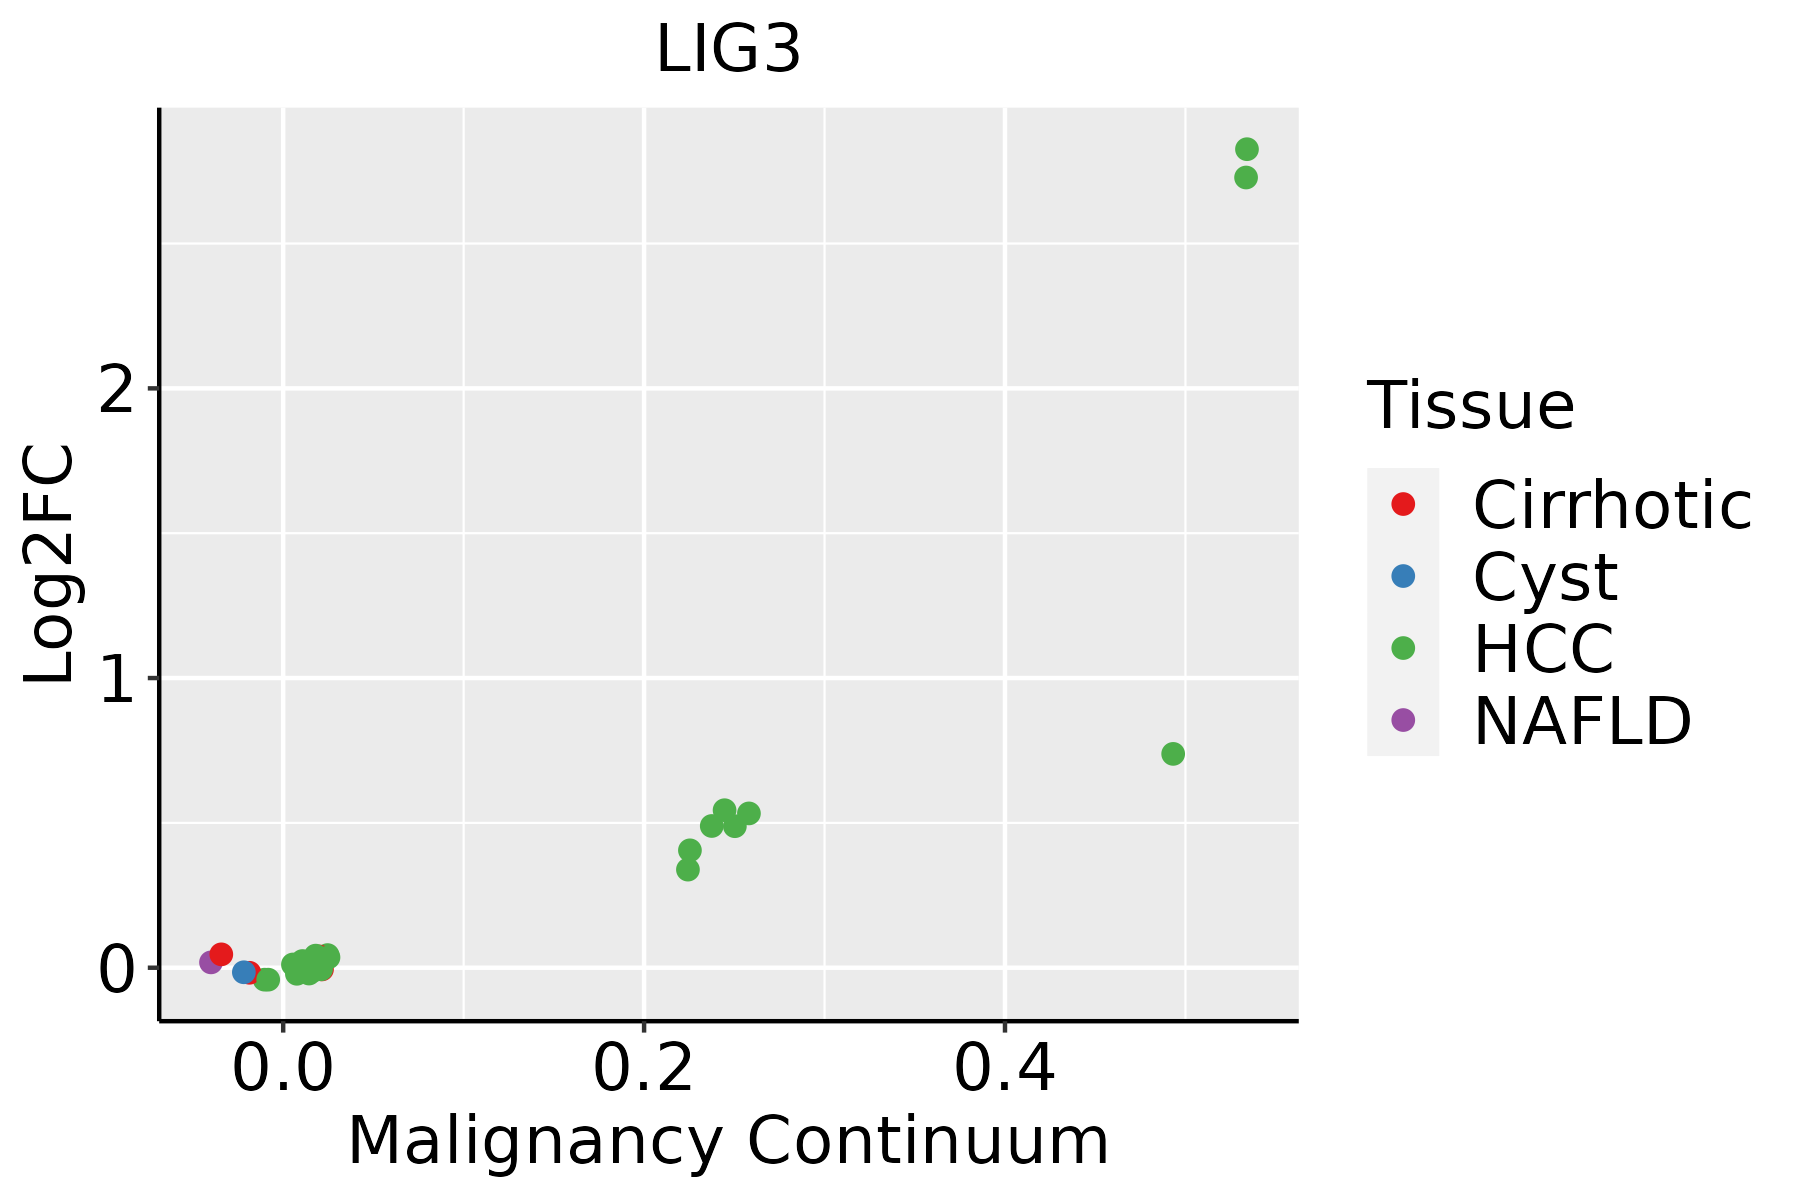 | HCC: Hepatocellular carcinoma |
| NAFLD: Non-alcoholic fatty liver disease |
| ∗log2FC in expression of this searched gene in stem-like cells from each diseased tissue sample relative to stem-like cells in normal samples in each tissue plotted against the malignancy continuum. Samples are colored based on if they are from different disease stage. |
Top |
Malignant transformation related pathway analysis |
| Find out the enriched GO biological processes and KEGG pathways involved in transition from healthy to precancer to cancer |
| Tissue | Disease Stage | Enriched GO biological Processes |
| Colorectum | AD |  |
| Colorectum | SER |  |
| Colorectum | MSS |  |
| Colorectum | MSI-H |  |
| Colorectum | FAP |  |
| ∗Top 15 enriched GO BP terms are showed in the bar plot of each disease state in each tissue. Each row represents a significant GO biological process which is colored according to the -log10(p.adjust). |
| Page: 1 2 3 4 5 6 7 8 9 |
| GO ID | Tissue | Disease Stage | Description | Gene Ratio | Bg Ratio | pvalue | p.adjust | Count |
| GO:00062604 | Esophagus | ESCC | DNA replication | 181/8552 | 260/18723 | 3.55e-15 | 2.05e-13 | 181 |
| GO:007189716 | Esophagus | ESCC | DNA biosynthetic process | 127/8552 | 180/18723 | 1.04e-11 | 3.85e-10 | 127 |
| GO:00062612 | Esophagus | ESCC | DNA-dependent DNA replication | 100/8552 | 151/18723 | 2.61e-07 | 3.94e-06 | 100 |
| GO:00063024 | Esophagus | ESCC | double-strand break repair | 152/8552 | 251/18723 | 1.33e-06 | 1.62e-05 | 152 |
| GO:00062754 | Esophagus | ESCC | regulation of DNA replication | 73/8552 | 107/18723 | 1.97e-06 | 2.28e-05 | 73 |
| GO:00062843 | Esophagus | ESCC | base-excision repair | 33/8552 | 43/18723 | 3.25e-05 | 2.69e-04 | 33 |
| GO:00063101 | Esophagus | ESCC | DNA recombination | 168/8552 | 305/18723 | 5.58e-04 | 3.05e-03 | 168 |
| GO:00000021 | Esophagus | ESCC | mitochondrial genome maintenance | 17/8552 | 21/18723 | 1.03e-03 | 5.19e-03 | 17 |
| GO:0006303 | Esophagus | ESCC | double-strand break repair via nonhomologous end joining | 43/8552 | 66/18723 | 1.10e-03 | 5.53e-03 | 43 |
| GO:00062661 | Esophagus | ESCC | DNA ligation | 13/8552 | 16/18723 | 4.05e-03 | 1.62e-02 | 13 |
| GO:00007241 | Esophagus | ESCC | double-strand break repair via homologous recombination | 79/8552 | 138/18723 | 4.05e-03 | 1.62e-02 | 79 |
| GO:00007251 | Esophagus | ESCC | recombinational repair | 80/8552 | 140/18723 | 4.10e-03 | 1.63e-02 | 80 |
| GO:0090329 | Esophagus | ESCC | regulation of DNA-dependent DNA replication | 30/8552 | 46/18723 | 5.91e-03 | 2.18e-02 | 30 |
| GO:0006287 | Esophagus | ESCC | base-excision repair, gap-filling | 11/8552 | 14/18723 | 1.30e-02 | 4.27e-02 | 11 |
| GO:00062601 | Liver | HCC | DNA replication | 146/7958 | 260/18723 | 5.68e-06 | 7.02e-05 | 146 |
| GO:00718975 | Liver | HCC | DNA biosynthetic process | 99/7958 | 180/18723 | 4.66e-04 | 3.08e-03 | 99 |
| GO:00063021 | Liver | HCC | double-strand break repair | 131/7958 | 251/18723 | 1.17e-03 | 6.54e-03 | 131 |
| GO:00062751 | Liver | HCC | regulation of DNA replication | 60/7958 | 107/18723 | 3.15e-03 | 1.46e-02 | 60 |
| GO:0006284 | Liver | HCC | base-excision repair | 27/7958 | 43/18723 | 5.79e-03 | 2.40e-02 | 27 |
| GO:0006261 | Liver | HCC | DNA-dependent DNA replication | 80/7958 | 151/18723 | 5.91e-03 | 2.44e-02 | 80 |
| Page: 1 |
| Pathway ID | Tissue | Disease Stage | Description | Gene Ratio | Bg Ratio | pvalue | p.adjust | qvalue | Count |
| hsa034104 | Esophagus | ESCC | Base excision repair | 38/4205 | 44/8465 | 3.59e-07 | 2.62e-06 | 1.34e-06 | 38 |
| hsa0341011 | Esophagus | ESCC | Base excision repair | 38/4205 | 44/8465 | 3.59e-07 | 2.62e-06 | 1.34e-06 | 38 |
| Page: 1 |
Top |
Cell-cell communication analysis |
| Identification of potential cell-cell interactions between two cell types and their ligand-receptor pairs for different disease states |
| Ligand | Receptor | LRpair | Pathway | Tissue | Disease Stage |
| Page: 1 |
Top |
Single-cell gene regulatory network inference analysis |
| Find out the significant the regulons (TFs) and the target genes of each regulon across cell types for different disease states |
| TF | Cell Type | Tissue | Disease Stage | Target Gene | RSS | Regulon Activity |
| ∗The dot plots of a searched regulon are shown for all cell subpopulations in each disease state of each tissue based on the regulon specific score inferred using pySCENIC and by calculating the average expression. |
| Page: 1 |
Top |
Somatic mutation of malignant transformation related genes |
| Annotation of somatic variants for genes involved in malignant transformation |
| Hugo Symbol | Variant Class | Variant Classification | dbSNP RS | HGVSc | HGVSp | HGVSp Short | SWISSPROT | BIOTYPE | SIFT | PolyPhen | Tumor Sample Barcode | Tissue | Histology | Sex | Age | Stage | Therapy Types | Drugs | Outcome |
| LIG3 | SNV | Missense_Mutation | c.2392N>C | p.Asp798His | p.D798H | P49916 | protein_coding | tolerated(0.11) | possibly_damaging(0.468) | TCGA-A7-A0DB-01 | Breast | breast invasive carcinoma | Female | <65 | I/II | Hormone Therapy | arimidex | SD | |
| LIG3 | SNV | Missense_Mutation | rs749058293 | c.1757N>G | p.Gln586Arg | p.Q586R | P49916 | protein_coding | tolerated(0.09) | benign(0.06) | TCGA-A8-A085-01 | Breast | breast invasive carcinoma | Male | <65 | I/II | Hormone Therapy | tamoxiphen | SD |
| LIG3 | SNV | Missense_Mutation | rs761685440 | c.1427N>T | p.Ser476Leu | p.S476L | P49916 | protein_coding | deleterious(0.01) | benign(0.068) | TCGA-AC-A23H-01 | Breast | breast invasive carcinoma | Female | >=65 | I/II | Unknown | Unknown | PD |
| LIG3 | SNV | Missense_Mutation | novel | c.2035N>A | p.Asp679Asn | p.D679N | P49916 | protein_coding | deleterious(0) | probably_damaging(0.996) | TCGA-AC-A62Y-01 | Breast | breast invasive carcinoma | Female | >=65 | I/II | Unknown | Unknown | SD |
| LIG3 | SNV | Missense_Mutation | c.1244N>C | p.Leu415Ser | p.L415S | P49916 | protein_coding | deleterious(0.02) | probably_damaging(0.93) | TCGA-AN-A0AK-01 | Breast | breast invasive carcinoma | Female | >=65 | I/II | Unknown | Unknown | SD | |
| LIG3 | SNV | Missense_Mutation | c.1013N>G | p.Pro338Arg | p.P338R | P49916 | protein_coding | tolerated(0.34) | benign(0.102) | TCGA-AN-A0FL-01 | Breast | breast invasive carcinoma | Female | <65 | I/II | Unknown | Unknown | SD | |
| LIG3 | SNV | Missense_Mutation | c.707N>G | p.Ser236Cys | p.S236C | P49916 | protein_coding | deleterious(0.02) | possibly_damaging(0.599) | TCGA-BH-A18M-01 | Breast | breast invasive carcinoma | Female | <65 | III/IV | Unknown | Unknown | SD | |
| LIG3 | SNV | Missense_Mutation | novel | c.194N>A | p.Arg65Lys | p.R65K | P49916 | protein_coding | tolerated_low_confidence(0.62) | benign(0) | TCGA-E2-A574-01 | Breast | breast invasive carcinoma | Female | <65 | I/II | Chemotherapy | adriamycin | SD |
| LIG3 | insertion | Nonsense_Mutation | novel | c.2755_2756insGCTCTTAGGCTGTATATGTATTCTCCACCCCACTGTCC | p.Glu919GlyfsTer3 | p.E919Gfs*3 | P49916 | protein_coding | TCGA-A2-A0EX-01 | Breast | breast invasive carcinoma | Female | <65 | I/II | Hormone Therapy | tamoxiphen | SD | ||
| LIG3 | insertion | In_Frame_Ins | novel | c.1849_1850insAAAGGCAAGCTCCTATGTCAGCTCAGGTGATTA | p.Leu617delinsGlnArgGlnAlaProMetSerAlaGlnValIleIle | p.L617delinsQRQAPMSAQVII | P49916 | protein_coding | TCGA-B6-A0IM-01 | Breast | breast invasive carcinoma | Female | >=65 | I/II | Unknown | Unknown | SD |
| Page: 1 2 3 4 5 6 7 8 9 10 11 |
Top |
Related drugs of malignant transformation related genes |
| Identification of chemicals and drugs interact with genes involved in malignant transfromation |
| (DGIdb 4.0) |
| Entrez ID | Symbol | Category | Interaction Types | Drug Claim Name | Drug Name | PMIDs |
| 3980 | LIG3 | NA | cyclophosphamide | CYCLOPHOSPHAMIDE | 24533712 | |
| 3980 | LIG3 | NA | cisplatin | CISPLATIN | 24533712 |
| Page: 1 |

Copyright 2023-Present -The University of Texas Health Science Center at Houston |