
|
|||||
|
 | |
| |
| |
| |
| |
| |
|
Gene: LIG1 |
Gene summary for LIG1 |
| Gene information | Species | Human | Gene symbol | LIG1 | Gene ID | 3978 |
| Gene name | DNA ligase 1 | |
| Gene Alias | LIG1 | |
| Cytomap | 19q13.33 | |
| Gene Type | protein-coding | GO ID | GO:0000278 | UniProtAcc | P18858 |
Top |
Malignant transformation analysis |
| Identification of the aberrant gene expression in precancerous and cancerous lesions by comparing the gene expression of stem-like cells in diseased tissues with normal stem cells |
| Entrez ID | Symbol | Replicates | Species | Organ | Tissue | Adj P-value | Log2FC | Malignancy |
| 3978 | LIG1 | LZE3D | Human | Esophagus | HGIN | 3.91e-02 | 7.27e-01 | 0.0668 |
| 3978 | LIG1 | LZE7T | Human | Esophagus | ESCC | 1.92e-04 | 4.38e-01 | 0.0667 |
| 3978 | LIG1 | LZE21D1 | Human | Esophagus | HGIN | 1.22e-04 | 3.24e-01 | 0.0632 |
| 3978 | LIG1 | LZE24T | Human | Esophagus | ESCC | 1.19e-04 | 2.14e-01 | 0.0596 |
| 3978 | LIG1 | LZE6T | Human | Esophagus | ESCC | 7.87e-04 | 3.44e-01 | 0.0845 |
| 3978 | LIG1 | P1T-E | Human | Esophagus | ESCC | 2.97e-05 | 5.17e-01 | 0.0875 |
| 3978 | LIG1 | P2T-E | Human | Esophagus | ESCC | 8.38e-13 | 4.63e-01 | 0.1177 |
| 3978 | LIG1 | P4T-E | Human | Esophagus | ESCC | 4.34e-12 | 2.59e-01 | 0.1323 |
| 3978 | LIG1 | P5T-E | Human | Esophagus | ESCC | 8.62e-07 | 2.08e-01 | 0.1327 |
| 3978 | LIG1 | P8T-E | Human | Esophagus | ESCC | 1.59e-20 | 5.30e-01 | 0.0889 |
| 3978 | LIG1 | P9T-E | Human | Esophagus | ESCC | 6.19e-03 | 6.27e-02 | 0.1131 |
| 3978 | LIG1 | P10T-E | Human | Esophagus | ESCC | 8.66e-19 | 4.36e-01 | 0.116 |
| 3978 | LIG1 | P11T-E | Human | Esophagus | ESCC | 2.49e-06 | 1.99e-01 | 0.1426 |
| 3978 | LIG1 | P12T-E | Human | Esophagus | ESCC | 2.35e-10 | 1.97e-01 | 0.1122 |
| 3978 | LIG1 | P15T-E | Human | Esophagus | ESCC | 2.70e-12 | 2.82e-01 | 0.1149 |
| 3978 | LIG1 | P16T-E | Human | Esophagus | ESCC | 1.51e-12 | 2.65e-01 | 0.1153 |
| 3978 | LIG1 | P17T-E | Human | Esophagus | ESCC | 1.07e-03 | 2.46e-01 | 0.1278 |
| 3978 | LIG1 | P19T-E | Human | Esophagus | ESCC | 3.95e-02 | 1.78e-01 | 0.1662 |
| 3978 | LIG1 | P20T-E | Human | Esophagus | ESCC | 2.42e-08 | 8.25e-02 | 0.1124 |
| 3978 | LIG1 | P21T-E | Human | Esophagus | ESCC | 2.54e-07 | 1.69e-01 | 0.1617 |
| Page: 1 2 3 4 5 |
| Tissue | Expression Dynamics | Abbreviation |
| Esophagus | 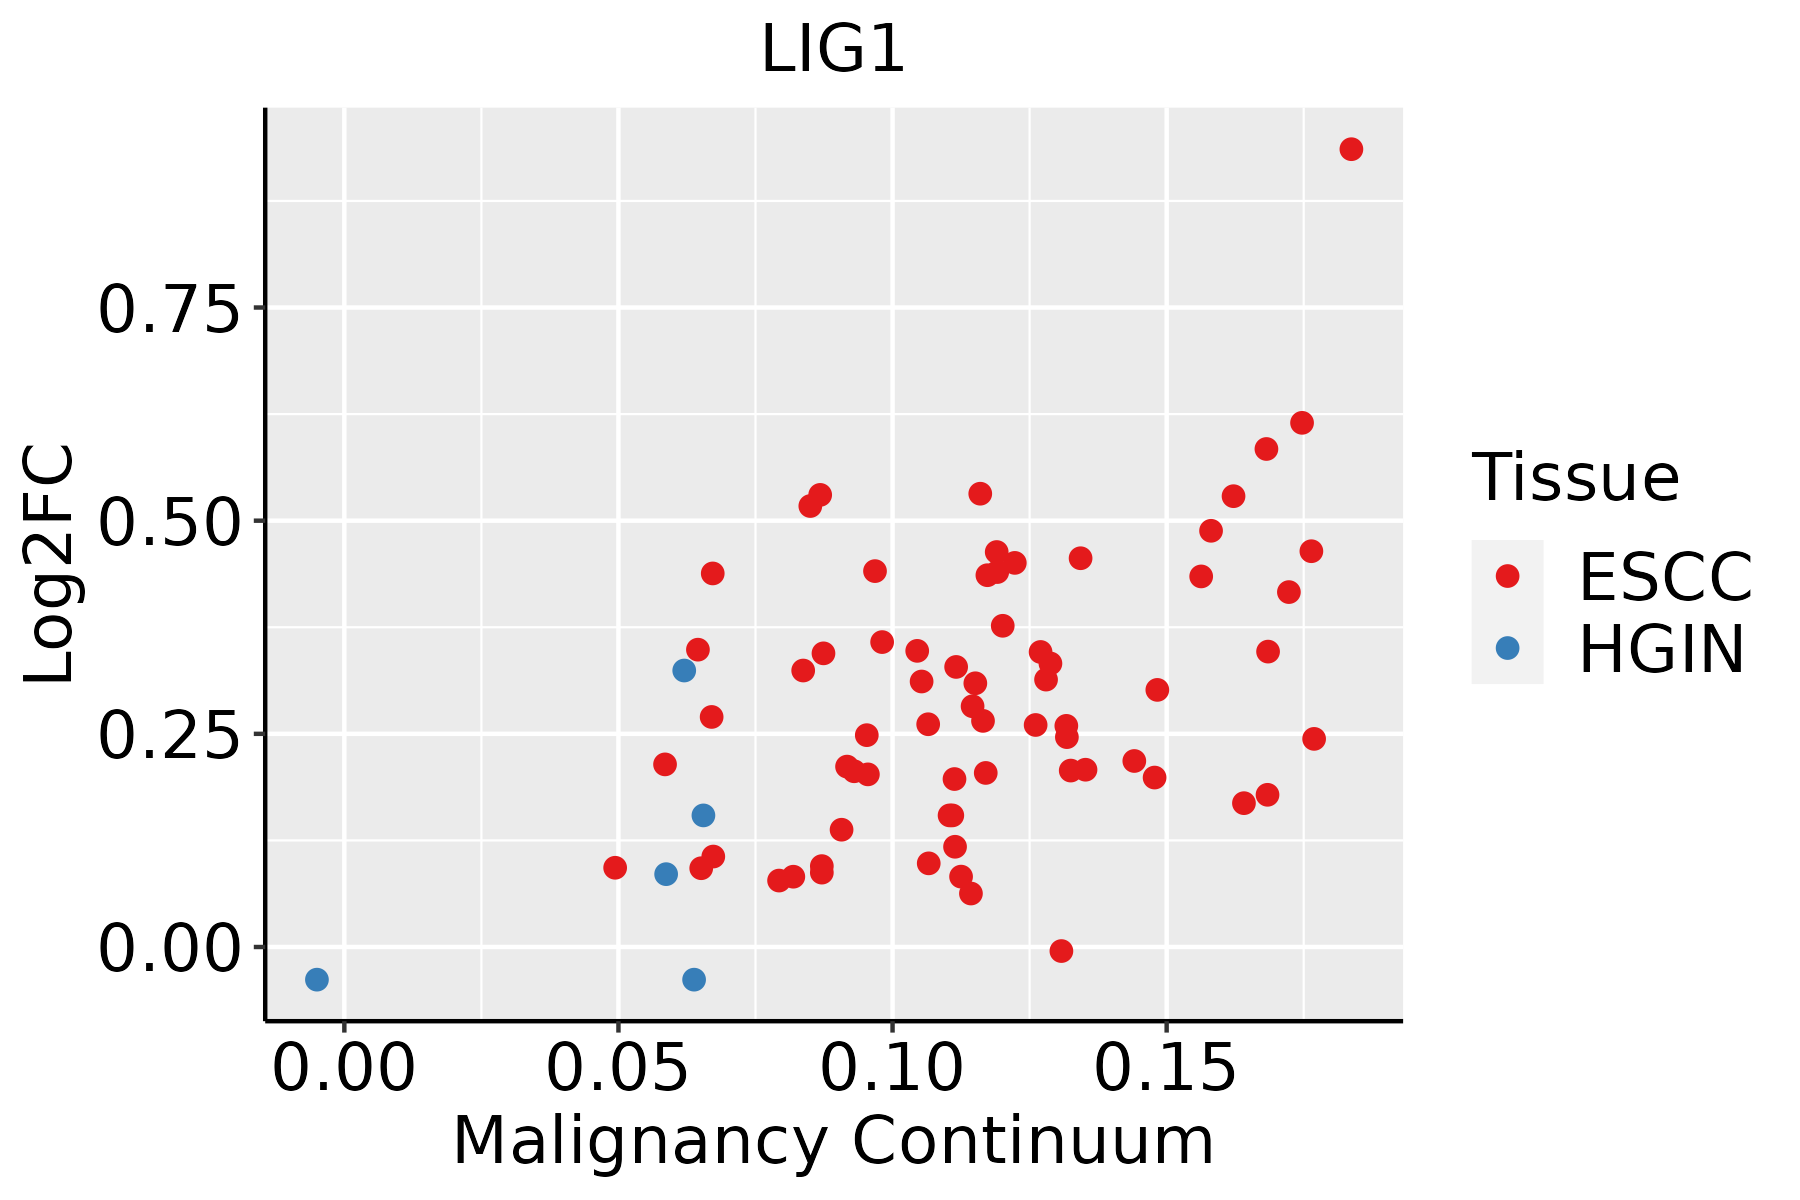 | ESCC: Esophageal squamous cell carcinoma |
| HGIN: High-grade intraepithelial neoplasias | ||
| LGIN: Low-grade intraepithelial neoplasias | ||
| Liver | 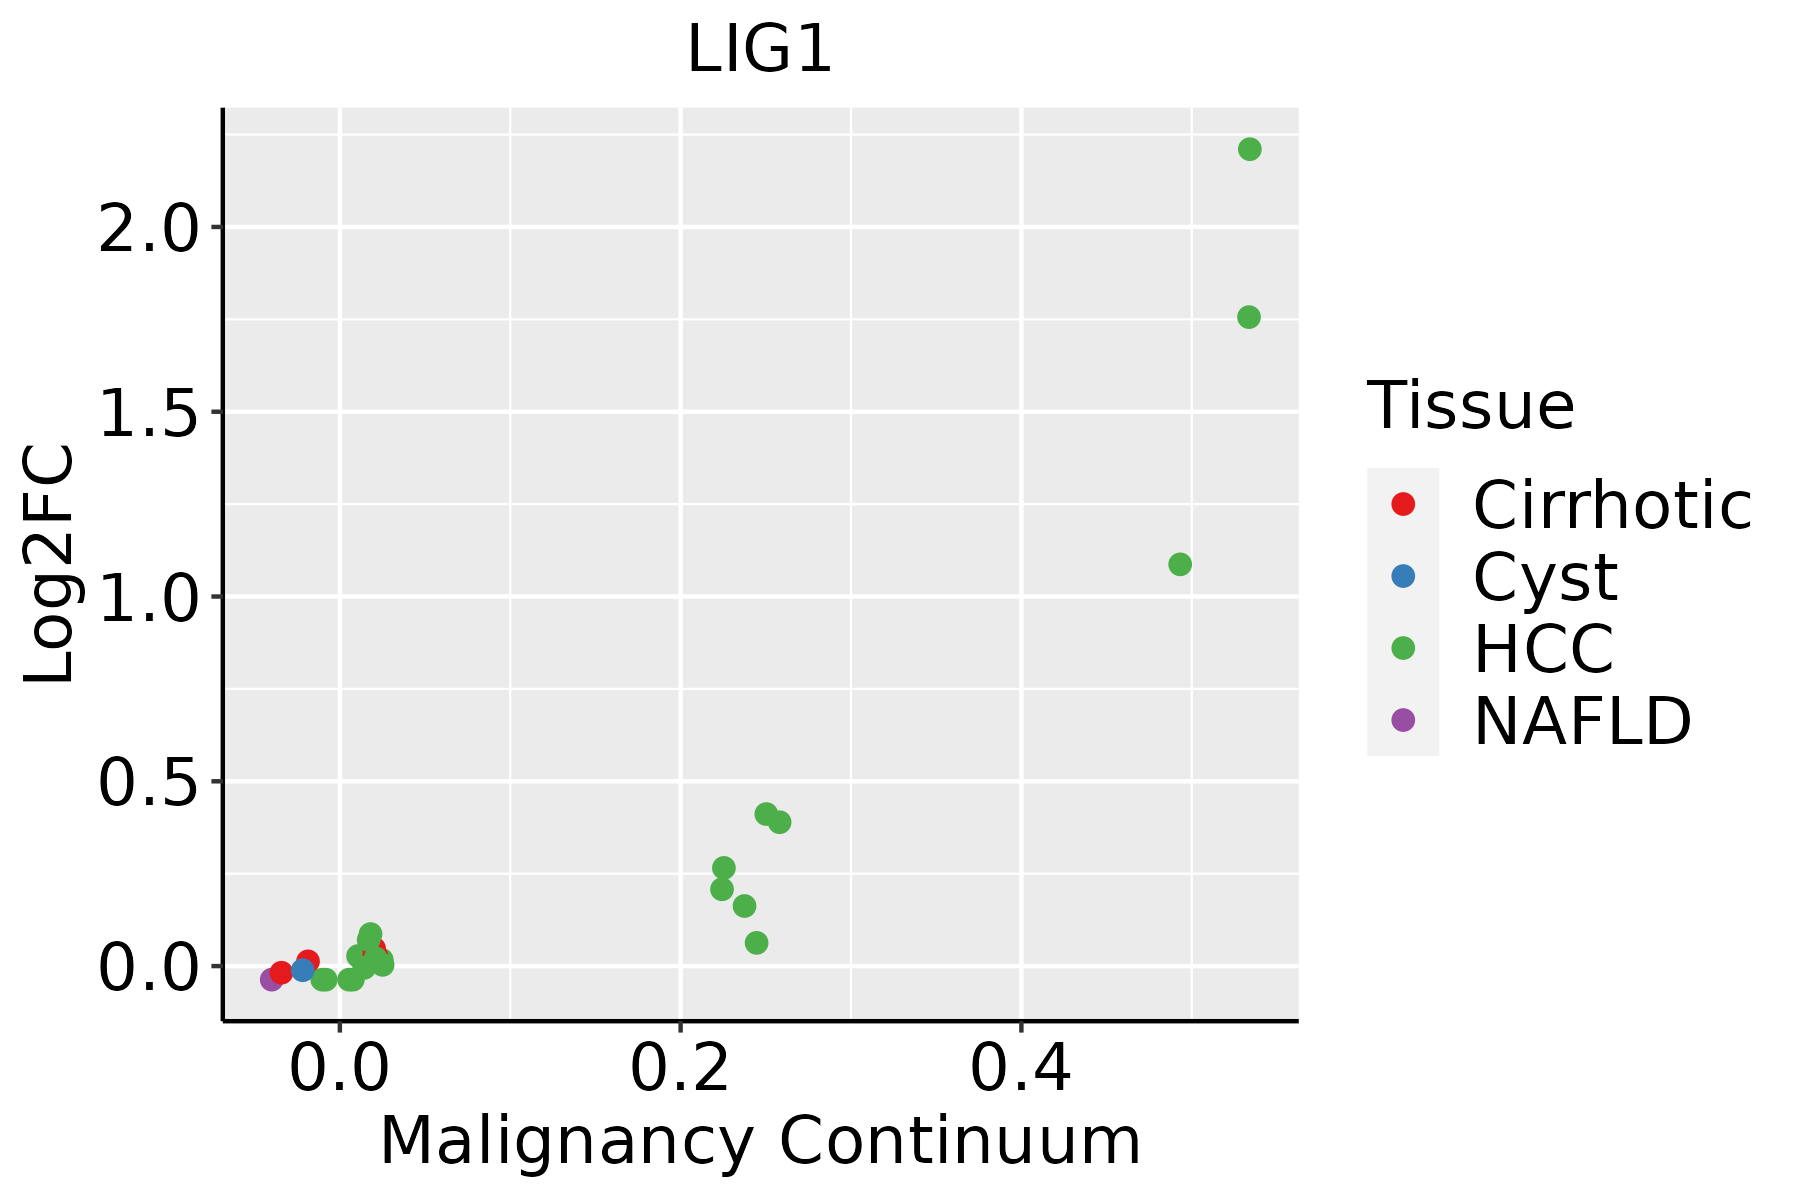 | HCC: Hepatocellular carcinoma |
| NAFLD: Non-alcoholic fatty liver disease | ||
| Oral Cavity | 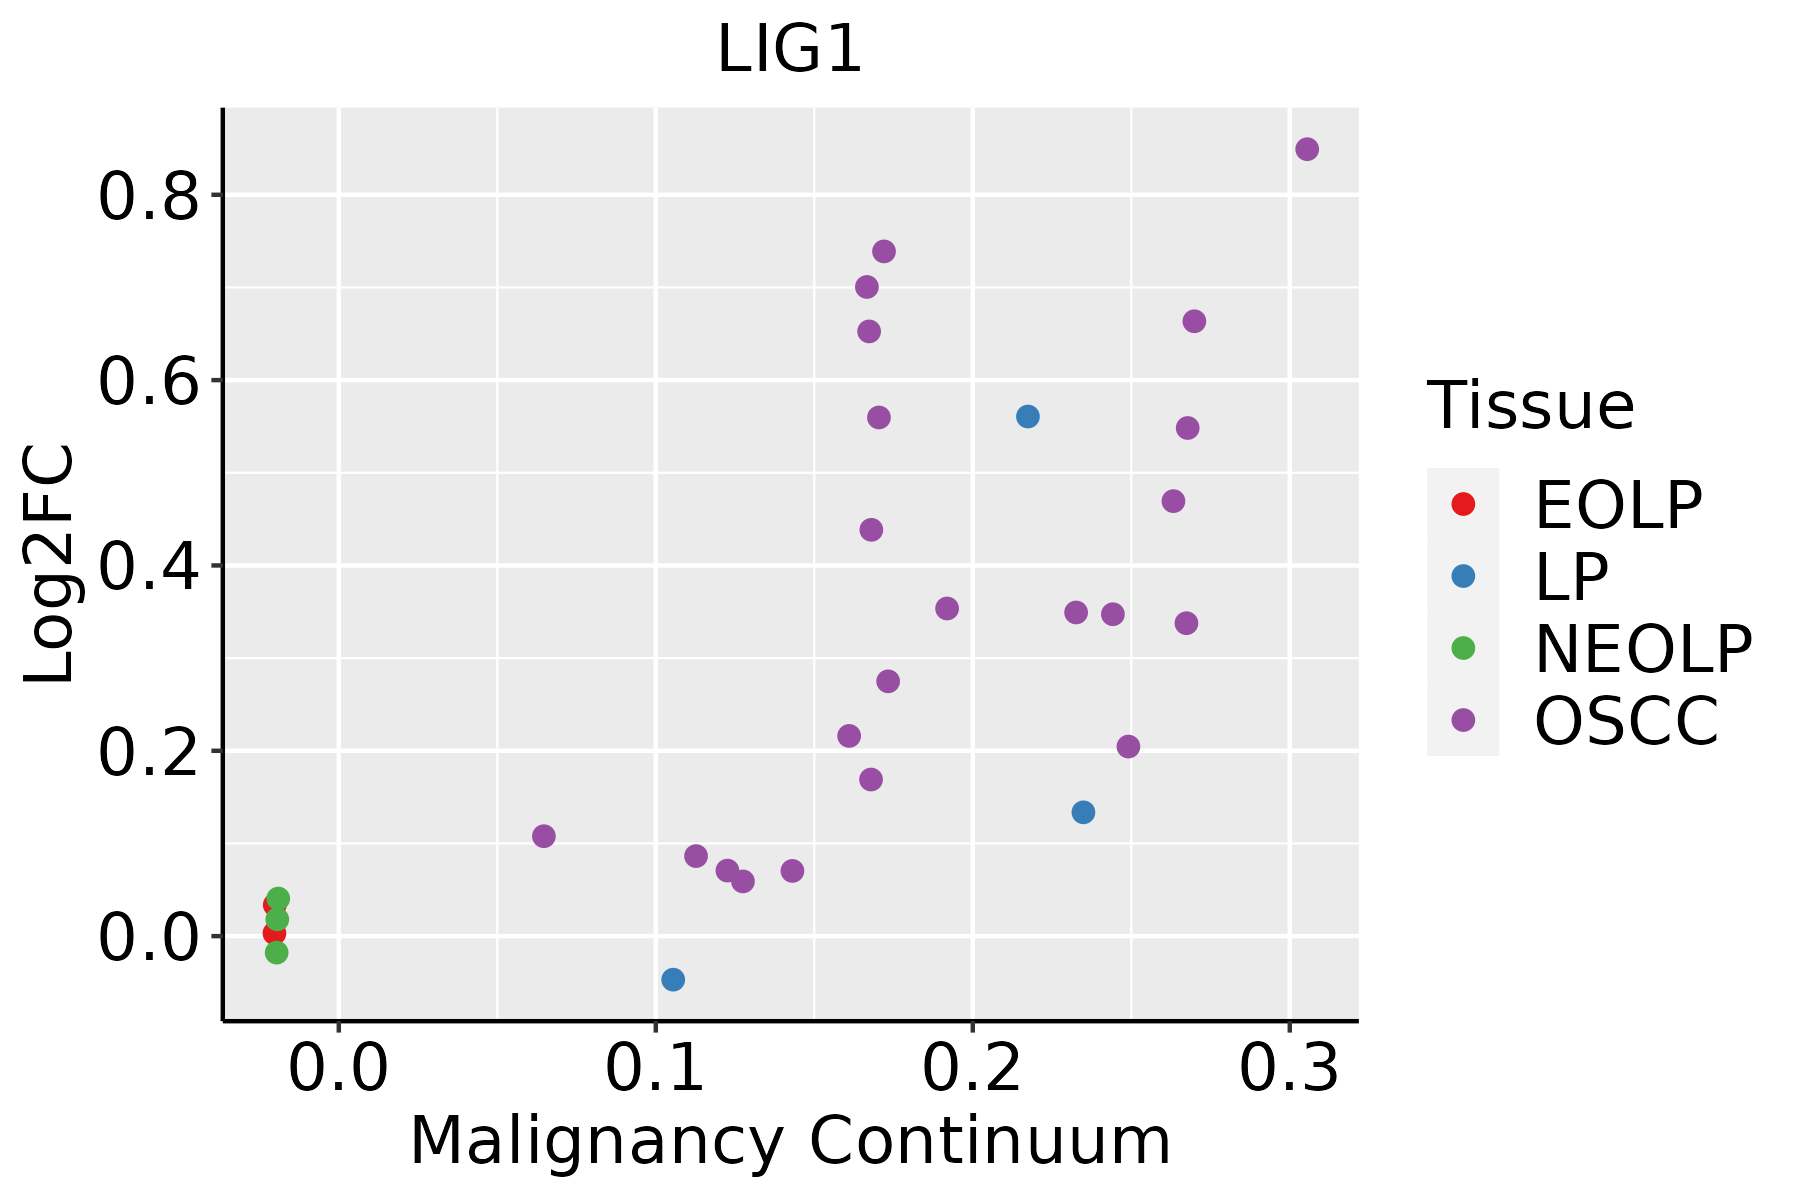 | EOLP: Erosive Oral lichen planus |
| LP: leukoplakia | ||
| NEOLP: Non-erosive oral lichen planus | ||
| OSCC: Oral squamous cell carcinoma |
| ∗log2FC in expression of this searched gene in stem-like cells from each diseased tissue sample relative to stem-like cells in normal samples in each tissue plotted against the malignancy continuum. Samples are colored based on if they are from different disease stage. |
Top |
Malignant transformation related pathway analysis |
| Find out the enriched GO biological processes and KEGG pathways involved in transition from healthy to precancer to cancer |
| Tissue | Disease Stage | Enriched GO biological Processes |
| Colorectum | AD |  |
| Colorectum | SER |  |
| Colorectum | MSS |  |
| Colorectum | MSI-H |  |
| Colorectum | FAP |  |
| ∗Top 15 enriched GO BP terms are showed in the bar plot of each disease state in each tissue. Each row represents a significant GO biological process which is colored according to the -log10(p.adjust). |
| Page: 1 2 3 4 5 6 7 8 9 |
| GO ID | Tissue | Disease Stage | Description | Gene Ratio | Bg Ratio | pvalue | p.adjust | Count |
| GO:007189710 | Esophagus | HGIN | DNA biosynthetic process | 44/2587 | 180/18723 | 8.97e-05 | 1.96e-03 | 44 |
| GO:00062604 | Esophagus | ESCC | DNA replication | 181/8552 | 260/18723 | 3.55e-15 | 2.05e-13 | 181 |
| GO:007189716 | Esophagus | ESCC | DNA biosynthetic process | 127/8552 | 180/18723 | 1.04e-11 | 3.85e-10 | 127 |
| GO:00062612 | Esophagus | ESCC | DNA-dependent DNA replication | 100/8552 | 151/18723 | 2.61e-07 | 3.94e-06 | 100 |
| GO:00062843 | Esophagus | ESCC | base-excision repair | 33/8552 | 43/18723 | 3.25e-05 | 2.69e-04 | 33 |
| GO:00062661 | Esophagus | ESCC | DNA ligation | 13/8552 | 16/18723 | 4.05e-03 | 1.62e-02 | 13 |
| GO:0006287 | Esophagus | ESCC | base-excision repair, gap-filling | 11/8552 | 14/18723 | 1.30e-02 | 4.27e-02 | 11 |
| GO:1902969 | Esophagus | ESCC | mitotic DNA replication | 11/8552 | 14/18723 | 1.30e-02 | 4.27e-02 | 11 |
| GO:00062601 | Liver | HCC | DNA replication | 146/7958 | 260/18723 | 5.68e-06 | 7.02e-05 | 146 |
| GO:00718975 | Liver | HCC | DNA biosynthetic process | 99/7958 | 180/18723 | 4.66e-04 | 3.08e-03 | 99 |
| GO:0006284 | Liver | HCC | base-excision repair | 27/7958 | 43/18723 | 5.79e-03 | 2.40e-02 | 27 |
| GO:0006261 | Liver | HCC | DNA-dependent DNA replication | 80/7958 | 151/18723 | 5.91e-03 | 2.44e-02 | 80 |
| GO:00062603 | Oral cavity | OSCC | DNA replication | 159/7305 | 260/18723 | 3.25e-13 | 1.59e-11 | 159 |
| GO:00718979 | Oral cavity | OSCC | DNA biosynthetic process | 106/7305 | 180/18723 | 4.86e-08 | 8.95e-07 | 106 |
| GO:00062611 | Oral cavity | OSCC | DNA-dependent DNA replication | 84/7305 | 151/18723 | 2.46e-05 | 2.30e-04 | 84 |
| GO:00062842 | Oral cavity | OSCC | base-excision repair | 28/7305 | 43/18723 | 4.71e-04 | 2.79e-03 | 28 |
| GO:0006266 | Oral cavity | OSCC | DNA ligation | 12/7305 | 16/18723 | 3.83e-03 | 1.57e-02 | 12 |
| GO:000626011 | Oral cavity | LP | DNA replication | 97/4623 | 260/18723 | 3.67e-06 | 7.75e-05 | 97 |
| GO:007189715 | Oral cavity | LP | DNA biosynthetic process | 71/4623 | 180/18723 | 8.04e-06 | 1.52e-04 | 71 |
| GO:00062841 | Oral cavity | LP | base-excision repair | 19/4623 | 43/18723 | 4.04e-03 | 2.61e-02 | 19 |
| Page: 1 |
| Pathway ID | Tissue | Disease Stage | Description | Gene Ratio | Bg Ratio | pvalue | p.adjust | qvalue | Count |
| hsa034205 | Esophagus | HGIN | Nucleotide excision repair | 29/1383 | 63/8465 | 2.96e-08 | 5.36e-07 | 4.26e-07 | 29 |
| hsa0342012 | Esophagus | HGIN | Nucleotide excision repair | 29/1383 | 63/8465 | 2.96e-08 | 5.36e-07 | 4.26e-07 | 29 |
| hsa0342022 | Esophagus | ESCC | Nucleotide excision repair | 54/4205 | 63/8465 | 2.01e-09 | 2.17e-08 | 1.11e-08 | 54 |
| hsa034104 | Esophagus | ESCC | Base excision repair | 38/4205 | 44/8465 | 3.59e-07 | 2.62e-06 | 1.34e-06 | 38 |
| hsa030304 | Esophagus | ESCC | DNA replication | 32/4205 | 36/8465 | 7.71e-07 | 5.06e-06 | 2.59e-06 | 32 |
| hsa034304 | Esophagus | ESCC | Mismatch repair | 21/4205 | 23/8465 | 2.85e-05 | 1.35e-04 | 6.90e-05 | 21 |
| hsa0342032 | Esophagus | ESCC | Nucleotide excision repair | 54/4205 | 63/8465 | 2.01e-09 | 2.17e-08 | 1.11e-08 | 54 |
| hsa0341011 | Esophagus | ESCC | Base excision repair | 38/4205 | 44/8465 | 3.59e-07 | 2.62e-06 | 1.34e-06 | 38 |
| hsa0303011 | Esophagus | ESCC | DNA replication | 32/4205 | 36/8465 | 7.71e-07 | 5.06e-06 | 2.59e-06 | 32 |
| hsa0343011 | Esophagus | ESCC | Mismatch repair | 21/4205 | 23/8465 | 2.85e-05 | 1.35e-04 | 6.90e-05 | 21 |
| hsa034202 | Liver | HCC | Nucleotide excision repair | 41/4020 | 63/8465 | 3.59e-03 | 1.12e-02 | 6.22e-03 | 41 |
| hsa034203 | Liver | HCC | Nucleotide excision repair | 41/4020 | 63/8465 | 3.59e-03 | 1.12e-02 | 6.22e-03 | 41 |
| hsa034204 | Oral cavity | OSCC | Nucleotide excision repair | 49/3704 | 63/8465 | 3.48e-08 | 2.91e-07 | 1.48e-07 | 49 |
| hsa03030 | Oral cavity | OSCC | DNA replication | 31/3704 | 36/8465 | 1.70e-07 | 1.19e-06 | 6.03e-07 | 31 |
| hsa03410 | Oral cavity | OSCC | Base excision repair | 32/3704 | 44/8465 | 9.11e-05 | 3.25e-04 | 1.65e-04 | 32 |
| hsa0342011 | Oral cavity | OSCC | Nucleotide excision repair | 49/3704 | 63/8465 | 3.48e-08 | 2.91e-07 | 1.48e-07 | 49 |
| hsa030301 | Oral cavity | OSCC | DNA replication | 31/3704 | 36/8465 | 1.70e-07 | 1.19e-06 | 6.03e-07 | 31 |
| hsa034101 | Oral cavity | OSCC | Base excision repair | 32/3704 | 44/8465 | 9.11e-05 | 3.25e-04 | 1.65e-04 | 32 |
| hsa0342021 | Oral cavity | LP | Nucleotide excision repair | 37/2418 | 63/8465 | 5.14e-07 | 6.33e-06 | 4.08e-06 | 37 |
| hsa034102 | Oral cavity | LP | Base excision repair | 23/2418 | 44/8465 | 7.66e-04 | 3.75e-03 | 2.42e-03 | 23 |
| Page: 1 2 |
Top |
Cell-cell communication analysis |
| Identification of potential cell-cell interactions between two cell types and their ligand-receptor pairs for different disease states |
| Ligand | Receptor | LRpair | Pathway | Tissue | Disease Stage |
| Page: 1 |
Top |
Single-cell gene regulatory network inference analysis |
| Find out the significant the regulons (TFs) and the target genes of each regulon across cell types for different disease states |
| TF | Cell Type | Tissue | Disease Stage | Target Gene | RSS | Regulon Activity |
| ∗The dot plots of a searched regulon are shown for all cell subpopulations in each disease state of each tissue based on the regulon specific score inferred using pySCENIC and by calculating the average expression. |
| Page: 1 |
Top |
Somatic mutation of malignant transformation related genes |
| Annotation of somatic variants for genes involved in malignant transformation |
| Hugo Symbol | Variant Class | Variant Classification | dbSNP RS | HGVSc | HGVSp | HGVSp Short | SWISSPROT | BIOTYPE | SIFT | PolyPhen | Tumor Sample Barcode | Tissue | Histology | Sex | Age | Stage | Therapy Types | Drugs | Outcome |
| LIG1 | SNV | Missense_Mutation | novel | c.2183A>G | p.Asp728Gly | p.D728G | P18858 | protein_coding | deleterious(0.03) | benign(0.205) | TCGA-B6-A0IM-01 | Breast | breast invasive carcinoma | Female | >=65 | I/II | Unknown | Unknown | SD |
| LIG1 | SNV | Missense_Mutation | c.2562N>G | p.Ile854Met | p.I854M | P18858 | protein_coding | deleterious(0.01) | benign(0.436) | TCGA-E2-A150-01 | Breast | breast invasive carcinoma | Female | <65 | I/II | Chemotherapy | doxorubicin | SD | |
| LIG1 | SNV | Missense_Mutation | c.751N>G | p.Pro251Ala | p.P251A | P18858 | protein_coding | tolerated(0.25) | benign(0) | TCGA-EW-A1PB-01 | Breast | breast invasive carcinoma | Female | >=65 | III/IV | Unknown | Unknown | SD | |
| LIG1 | insertion | Frame_Shift_Ins | novel | c.2048_2049insCCCCCAGGGCCTTTCATTTCTTTCCATCTCC | p.Glu684ProfsTer57 | p.E684Pfs*57 | P18858 | protein_coding | TCGA-A2-A0CU-01 | Breast | breast invasive carcinoma | Female | >=65 | I/II | Hormone Therapy | tamoxiphen | SD | ||
| LIG1 | insertion | In_Frame_Ins | novel | c.2181_2182insACTTTTATAAATCACAAATGTTTT | p.Leu727_Asp728insThrPheIleAsnHisLysCysPhe | p.L727_D728insTFINHKCF | P18858 | protein_coding | TCGA-B6-A0IM-01 | Breast | breast invasive carcinoma | Female | >=65 | I/II | Unknown | Unknown | SD | ||
| LIG1 | deletion | Frame_Shift_Del | novel | c.2392delN | p.Thr798LeufsTer29 | p.T798Lfs*29 | P18858 | protein_coding | TCGA-EW-A2FV-01 | Breast | breast invasive carcinoma | Female | <65 | III/IV | Chemotherapy | docetaxel | SD | ||
| LIG1 | deletion | Frame_Shift_Del | novel | c.205delN | p.Glu69LysfsTer120 | p.E69Kfs*120 | P18858 | protein_coding | TCGA-EW-A2FV-01 | Breast | breast invasive carcinoma | Female | <65 | III/IV | Chemotherapy | docetaxel | SD | ||
| LIG1 | SNV | Missense_Mutation | novel | c.1900N>T | p.Pro634Ser | p.P634S | P18858 | protein_coding | deleterious(0.03) | possibly_damaging(0.591) | TCGA-2W-A8YY-01 | Cervix | cervical & endocervical cancer | Female | <65 | I/II | Chemotherapy | cisplatin | CR |
| LIG1 | SNV | Missense_Mutation | novel | c.1525N>A | p.Glu509Lys | p.E509K | P18858 | protein_coding | deleterious(0) | possibly_damaging(0.554) | TCGA-2W-A8YY-01 | Cervix | cervical & endocervical cancer | Female | <65 | I/II | Chemotherapy | cisplatin | CR |
| LIG1 | SNV | Missense_Mutation | c.661N>T | p.Pro221Ser | p.P221S | P18858 | protein_coding | tolerated(0.24) | benign(0.003) | TCGA-DR-A0ZM-01 | Cervix | cervical & endocervical cancer | Female | <65 | III/IV | Unspecific | Cisplatin | SD |
| Page: 1 2 3 4 5 6 7 8 9 10 11 |
Top |
Related drugs of malignant transformation related genes |
| Identification of chemicals and drugs interact with genes involved in malignant transfromation |
| (DGIdb 4.0) |
| Entrez ID | Symbol | Category | Interaction Types | Drug Claim Name | Drug Name | PMIDs |
| 3978 | LIG1 | DNA REPAIR, DRUGGABLE GENOME | BLEOMYCIN | BLEOMYCIN | ||
| 3978 | LIG1 | DNA REPAIR, DRUGGABLE GENOME | BLEOMYCIN | BLEOMYCIN |
| Page: 1 |

Copyright 2023-Present -The University of Texas Health Science Center at Houston |