
|
|||||
|
 | |
| |
| |
| |
| |
| |
|
Gene: LIFR |
Gene summary for LIFR |
| Gene information | Species | Human | Gene symbol | LIFR | Gene ID | 3977 |
| Gene name | LIF receptor subunit alpha | |
| Gene Alias | CD118 | |
| Cytomap | 5p13.1 | |
| Gene Type | protein-coding | GO ID | GO:0007154 | UniProtAcc | A8K1Z4 |
Top |
Malignant transformation analysis |
| Identification of the aberrant gene expression in precancerous and cancerous lesions by comparing the gene expression of stem-like cells in diseased tissues with normal stem cells |
| Entrez ID | Symbol | Replicates | Species | Organ | Tissue | Adj P-value | Log2FC | Malignancy |
| 3977 | LIFR | RNA-P17T-P17T-6 | Human | Lung | IAC | 1.33e-02 | 3.36e-01 | 0.3385 |
| 3977 | LIFR | RNA-P25T1-P25T1-1 | Human | Lung | AIS | 2.71e-24 | 1.06e+00 | -0.2116 |
| 3977 | LIFR | RNA-P25T1-P25T1-2 | Human | Lung | AIS | 4.25e-06 | 7.71e-01 | -0.1941 |
| 3977 | LIFR | RNA-P25T1-P25T1-3 | Human | Lung | AIS | 3.47e-11 | 8.01e-01 | -0.2107 |
| 3977 | LIFR | RNA-P25T1-P25T1-4 | Human | Lung | AIS | 5.68e-15 | 8.82e-01 | -0.2119 |
| 3977 | LIFR | RNA-P6T2-P6T2-1 | Human | Lung | IAC | 2.50e-04 | 2.17e-01 | -0.0166 |
| 3977 | LIFR | RNA-P6T2-P6T2-3 | Human | Lung | IAC | 3.08e-03 | 1.65e-01 | -0.013 |
| 3977 | LIFR | Adj_PTCwithHT_6 | Human | Thyroid | HT | 4.82e-02 | -2.42e-01 | 0.02 |
| 3977 | LIFR | PTCwithHT_6 | Human | Thyroid | HT | 2.29e-02 | -2.42e-01 | 0.02 |
| 3977 | LIFR | PTCwithHT_8 | Human | Thyroid | HT | 4.82e-02 | -2.42e-01 | 0.0351 |
| 3977 | LIFR | PTCwithoutHT_2 | Human | Thyroid | PTC | 4.82e-02 | -2.42e-01 | 0.0419 |
| 3977 | LIFR | male-WTA | Human | Thyroid | PTC | 1.82e-03 | -1.84e-01 | 0.1037 |
| 3977 | LIFR | PTC01 | Human | Thyroid | PTC | 5.84e-06 | -1.92e-01 | 0.1899 |
| 3977 | LIFR | PTC03 | Human | Thyroid | PTC | 3.71e-02 | 1.59e-02 | 0.1784 |
| 3977 | LIFR | PTC04 | Human | Thyroid | PTC | 4.61e-03 | -1.36e-01 | 0.1927 |
| 3977 | LIFR | PTC06 | Human | Thyroid | PTC | 5.18e-03 | -1.18e-01 | 0.2057 |
| 3977 | LIFR | PTC07 | Human | Thyroid | PTC | 2.78e-06 | -1.58e-01 | 0.2044 |
| 3977 | LIFR | ATC09 | Human | Thyroid | ATC | 9.76e-06 | -1.08e-01 | 0.2871 |
| 3977 | LIFR | ATC11 | Human | Thyroid | ATC | 5.04e-03 | 1.26e-01 | 0.3386 |
| 3977 | LIFR | ATC12 | Human | Thyroid | ATC | 5.25e-14 | 2.50e-01 | 0.34 |
| Page: 1 2 |
| Tissue | Expression Dynamics | Abbreviation |
| Lung |  | AAH: Atypical adenomatous hyperplasia |
| AIS: Adenocarcinoma in situ | ||
| IAC: Invasive lung adenocarcinoma | ||
| MIA: Minimally invasive adenocarcinoma | ||
| Prostate | 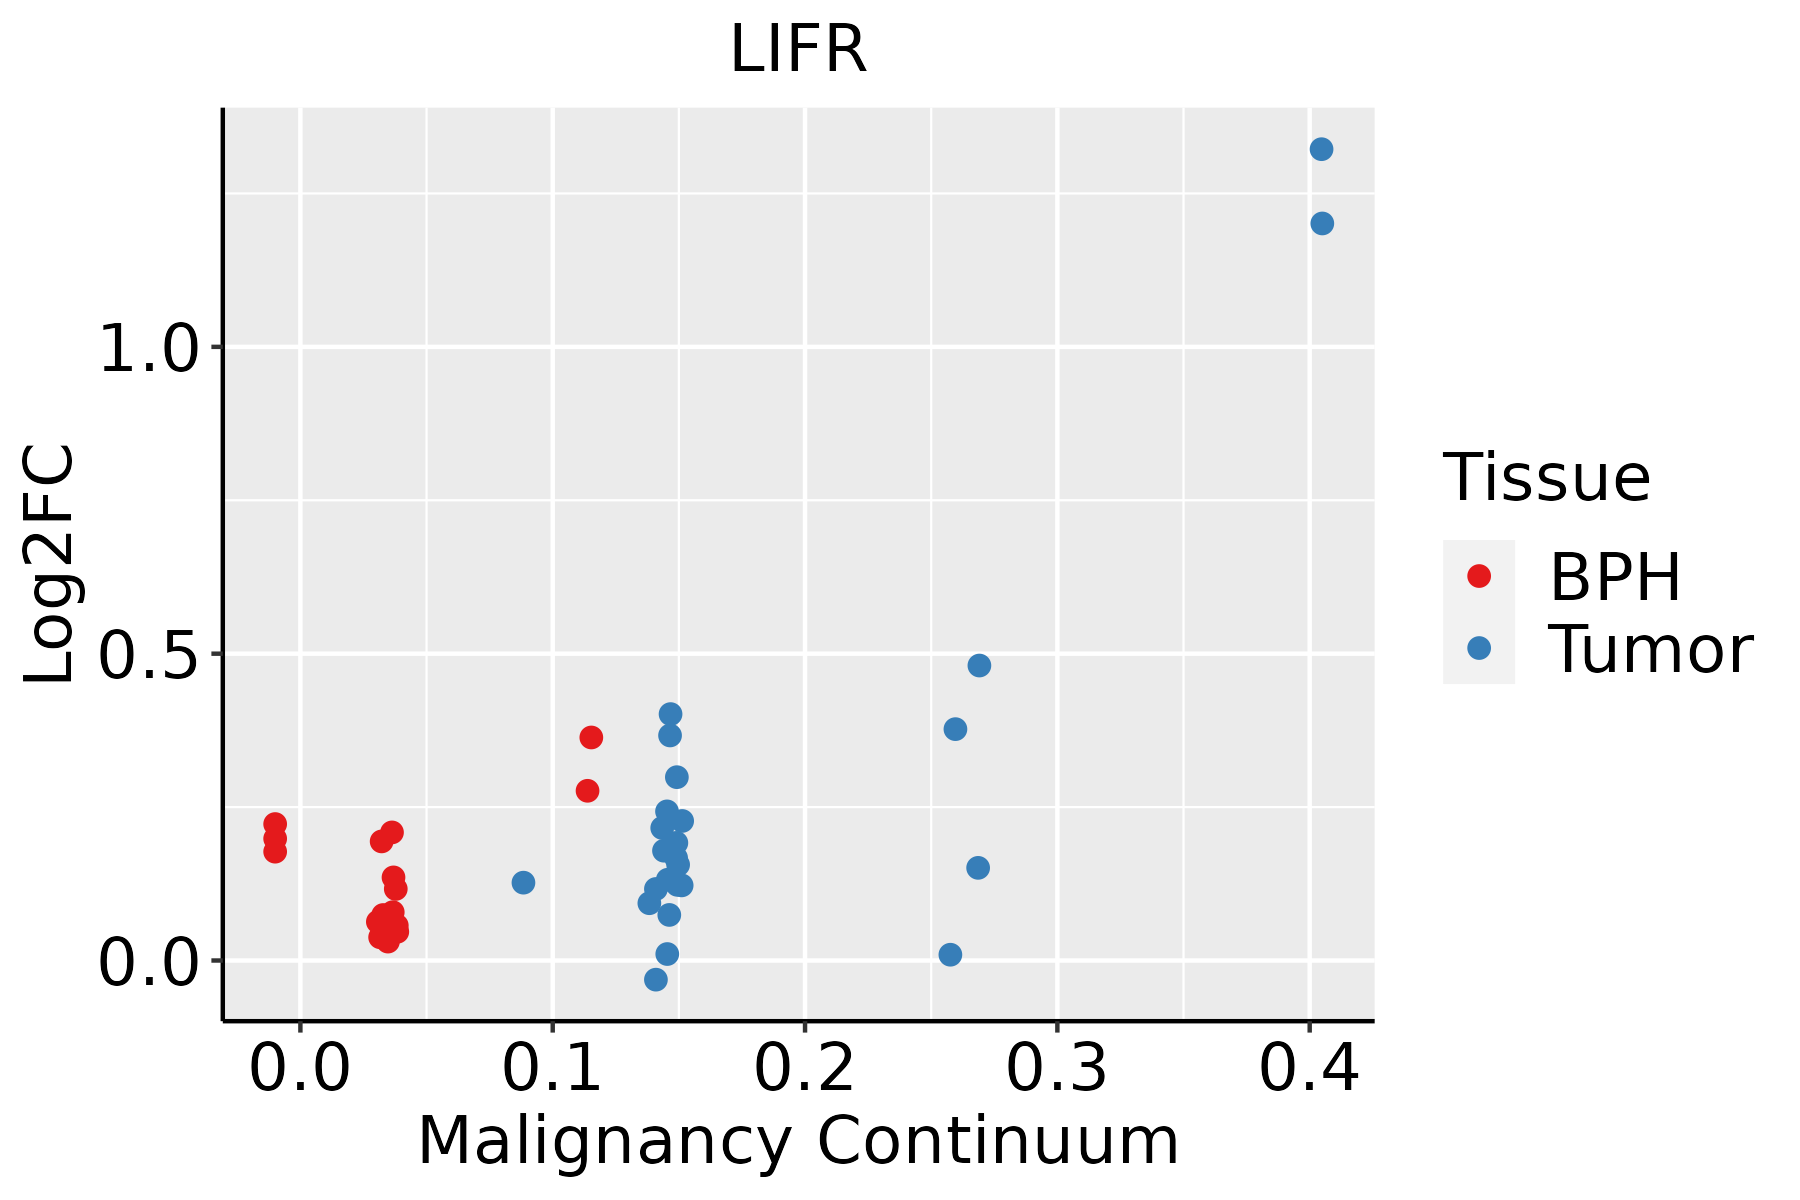 | BPH: Benign Prostatic Hyperplasia |
| Thyroid |  | ATC: Anaplastic thyroid cancer |
| HT: Hashimoto's thyroiditis | ||
| PTC: Papillary thyroid cancer |
| ∗log2FC in expression of this searched gene in stem-like cells from each diseased tissue sample relative to stem-like cells in normal samples in each tissue plotted against the malignancy continuum. Samples are colored based on if they are from different disease stage. |
Top |
Malignant transformation related pathway analysis |
| Find out the enriched GO biological processes and KEGG pathways involved in transition from healthy to precancer to cancer |
| Tissue | Disease Stage | Enriched GO biological Processes |
| Colorectum | AD |  |
| Colorectum | SER |  |
| Colorectum | MSS |  |
| Colorectum | MSI-H |  |
| Colorectum | FAP |  |
| ∗Top 15 enriched GO BP terms are showed in the bar plot of each disease state in each tissue. Each row represents a significant GO biological process which is colored according to the -log10(p.adjust). |
| Page: 1 2 3 4 5 6 7 8 9 |
| GO ID | Tissue | Disease Stage | Description | Gene Ratio | Bg Ratio | pvalue | p.adjust | Count |
| Page: 1 |
| Pathway ID | Tissue | Disease Stage | Description | Gene Ratio | Bg Ratio | pvalue | p.adjust | qvalue | Count |
| Page: 1 |
Top |
Cell-cell communication analysis |
| Identification of potential cell-cell interactions between two cell types and their ligand-receptor pairs for different disease states |
| Ligand | Receptor | LRpair | Pathway | Tissue | Disease Stage |
| OSM | LIFR_IL6ST | OSM_LIFR_IL6ST | OSM | Breast | DCIS |
| LIF | LIFR_IL6ST | LIF_LIFR_IL6ST | LIFR | Breast | Healthy |
| OSM | LIFR_IL6ST | OSM_LIFR_IL6ST | OSM | Breast | Healthy |
| LIF | LIFR_IL6ST | LIF_LIFR_IL6ST | LIFR | Cervix | ADJ |
| OSM | LIFR_IL6ST | OSM_LIFR_IL6ST | OSM | Cervix | CC |
| LIF | LIFR_IL6ST | LIF_LIFR_IL6ST | LIFR | Cervix | CC |
| OSM | LIFR_IL6ST | OSM_LIFR_IL6ST | OSM | Cervix | Precancer |
| LIF | LIFR_IL6ST | LIF_LIFR_IL6ST | LIFR | Endometrium | ADJ |
| OSM | LIFR_IL6ST | OSM_LIFR_IL6ST | OSM | Endometrium | ADJ |
| LIF | LIFR_IL6ST | LIF_LIFR_IL6ST | LIFR | Endometrium | AEH |
| OSM | LIFR_IL6ST | OSM_LIFR_IL6ST | OSM | Endometrium | AEH |
| OSM | LIFR_IL6ST | OSM_LIFR_IL6ST | OSM | Endometrium | EEC |
| LIF | LIFR_IL6ST | LIF_LIFR_IL6ST | LIFR | Endometrium | EEC |
| LIF | LIFR_IL6ST | LIF_LIFR_IL6ST | LIFR | Endometrium | Healthy |
| OSM | LIFR_IL6ST | OSM_LIFR_IL6ST | OSM | Endometrium | Healthy |
| OSM | LIFR_IL6ST | OSM_LIFR_IL6ST | OSM | Esophagus | ESCC |
| LIF | LIFR_IL6ST | LIF_LIFR_IL6ST | LIFR | Esophagus | ESCC |
| OSM | LIFR_IL6ST | OSM_LIFR_IL6ST | OSM | HNSCC | ADJ |
| OSM | LIFR_IL6ST | OSM_LIFR_IL6ST | OSM | HNSCC | Healthy |
| OSM | LIFR_IL6ST | OSM_LIFR_IL6ST | OSM | HNSCC | OSCC |
| Page: 1 |
Top |
Single-cell gene regulatory network inference analysis |
| Find out the significant the regulons (TFs) and the target genes of each regulon across cell types for different disease states |
| TF | Cell Type | Tissue | Disease Stage | Target Gene | RSS | Regulon Activity |
| ∗The dot plots of a searched regulon are shown for all cell subpopulations in each disease state of each tissue based on the regulon specific score inferred using pySCENIC and by calculating the average expression. |
| Page: 1 |
Top |
Somatic mutation of malignant transformation related genes |
| Annotation of somatic variants for genes involved in malignant transformation |
| Hugo Symbol | Variant Class | Variant Classification | dbSNP RS | HGVSc | HGVSp | HGVSp Short | SWISSPROT | BIOTYPE | SIFT | PolyPhen | Tumor Sample Barcode | Tissue | Histology | Sex | Age | Stage | Therapy Types | Drugs | Outcome |
| LIFR | SNV | Missense_Mutation | novel | c.2024N>T | p.Arg675Ile | p.R675I | P42702 | protein_coding | tolerated(0.08) | benign(0) | TCGA-AN-A046-01 | Breast | breast invasive carcinoma | Female | >=65 | I/II | Unknown | Unknown | SD |
| LIFR | SNV | Missense_Mutation | c.1405N>A | p.Glu469Lys | p.E469K | P42702 | protein_coding | tolerated(0.14) | benign(0.062) | TCGA-B6-A0IK-01 | Breast | breast invasive carcinoma | Female | <65 | III/IV | Unknown | Unknown | PD | |
| LIFR | SNV | Missense_Mutation | c.3199N>A | p.Gln1067Lys | p.Q1067K | P42702 | protein_coding | deleterious(0.02) | possibly_damaging(0.679) | TCGA-B6-A1KF-01 | Breast | breast invasive carcinoma | Female | >=65 | I/II | Unknown | Unknown | SD | |
| LIFR | SNV | Missense_Mutation | c.2036N>T | p.Ser679Leu | p.S679L | P42702 | protein_coding | tolerated(0.1) | benign(0.086) | TCGA-BH-A0HP-01 | Breast | breast invasive carcinoma | Female | >=65 | III/IV | Chemotherapy | doxorubicin | SD | |
| LIFR | SNV | Missense_Mutation | rs368698516 | c.3197G>A | p.Arg1066Gln | p.R1066Q | P42702 | protein_coding | tolerated(0.09) | probably_damaging(0.994) | TCGA-BH-A18G-01 | Breast | breast invasive carcinoma | Female | >=65 | I/II | Unknown | Unknown | SD |
| LIFR | SNV | Missense_Mutation | rs762515314 | c.1594N>A | p.Glu532Lys | p.E532K | P42702 | protein_coding | deleterious(0.01) | possibly_damaging(0.663) | TCGA-E9-A295-01 | Breast | breast invasive carcinoma | Female | >=65 | I/II | Hormone Therapy | tamoxiphen | SD |
| LIFR | insertion | Nonsense_Mutation | novel | c.3190_3191insTGAATCCTGATTTTAACTGCTAGGATT | p.Asn1064delinsMetAsnProAspPheAsnCysTerAspTyr | p.N1064delinsMNPDFNC*DY | P42702 | protein_coding | TCGA-A2-A0EO-01 | Breast | breast invasive carcinoma | Female | <65 | I/II | Hormone Therapy | tamoxiphen | SD | ||
| LIFR | insertion | Nonsense_Mutation | novel | c.1973_1974insGATTGGAGAACTAATGCTTTAACCACACCAGAATAATTG | p.Ile659_Lys660insGlyGluLeuMetLeuTerProHisGlnAsnAsnCysIle | p.I659_K660insGELML*PHQNNCI | P42702 | protein_coding | TCGA-BH-A0H7-01 | Breast | breast invasive carcinoma | Female | >=65 | III/IV | Chemotherapy | doxorubicin | SD | ||
| LIFR | deletion | Frame_Shift_Del | novel | c.1799delN | p.Lys600ArgfsTer8 | p.K600Rfs*8 | P42702 | protein_coding | TCGA-EW-A2FV-01 | Breast | breast invasive carcinoma | Female | <65 | III/IV | Chemotherapy | docetaxel | SD | ||
| LIFR | SNV | Missense_Mutation | novel | c.2339G>A | p.Arg780His | p.R780H | P42702 | protein_coding | tolerated(0.46) | benign(0) | TCGA-2W-A8YY-01 | Cervix | cervical & endocervical cancer | Female | <65 | I/II | Chemotherapy | cisplatin | CR |
| Page: 1 2 3 4 5 6 7 8 9 10 11 12 13 14 15 16 17 |
Top |
Related drugs of malignant transformation related genes |
| Identification of chemicals and drugs interact with genes involved in malignant transfromation |
| (DGIdb 4.0) |
| Entrez ID | Symbol | Category | Interaction Types | Drug Claim Name | Drug Name | PMIDs |
| 3977 | LIFR | DRUGGABLE GENOME, CLINICALLY ACTIONABLE, EXTERNAL SIDE OF PLASMA MEMBRANE | Emfilermin | EMFILERMIN | 15089810 |
| Page: 1 |

Copyright 2023-Present -The University of Texas Health Science Center at Houston |