
|
|||||
|
 | |
| |
| |
| |
| |
| |
|
Gene: LIAS |
Gene summary for LIAS |
| Gene information | Species | Human | Gene symbol | LIAS | Gene ID | 11019 |
| Gene name | lipoic acid synthetase | |
| Gene Alias | HGCLAS | |
| Cytomap | 4p14 | |
| Gene Type | protein-coding | GO ID | GO:0001838 | UniProtAcc | O43766 |
Top |
Malignant transformation analysis |
| Identification of the aberrant gene expression in precancerous and cancerous lesions by comparing the gene expression of stem-like cells in diseased tissues with normal stem cells |
| Entrez ID | Symbol | Replicates | Species | Organ | Tissue | Adj P-value | Log2FC | Malignancy |
| 11019 | LIAS | P2T-E | Human | Esophagus | ESCC | 4.87e-17 | 2.95e-01 | 0.1177 |
| 11019 | LIAS | P4T-E | Human | Esophagus | ESCC | 1.77e-10 | 3.35e-01 | 0.1323 |
| 11019 | LIAS | P5T-E | Human | Esophagus | ESCC | 6.45e-03 | 7.66e-02 | 0.1327 |
| 11019 | LIAS | P8T-E | Human | Esophagus | ESCC | 3.50e-03 | 1.06e-01 | 0.0889 |
| 11019 | LIAS | P10T-E | Human | Esophagus | ESCC | 5.78e-06 | 6.99e-02 | 0.116 |
| 11019 | LIAS | P12T-E | Human | Esophagus | ESCC | 4.16e-08 | 2.07e-01 | 0.1122 |
| 11019 | LIAS | P15T-E | Human | Esophagus | ESCC | 3.53e-07 | 1.90e-01 | 0.1149 |
| 11019 | LIAS | P16T-E | Human | Esophagus | ESCC | 2.20e-11 | 2.06e-01 | 0.1153 |
| 11019 | LIAS | P21T-E | Human | Esophagus | ESCC | 2.98e-07 | 1.33e-01 | 0.1617 |
| 11019 | LIAS | P22T-E | Human | Esophagus | ESCC | 4.17e-03 | 7.91e-02 | 0.1236 |
| 11019 | LIAS | P23T-E | Human | Esophagus | ESCC | 2.05e-08 | 3.09e-01 | 0.108 |
| 11019 | LIAS | P24T-E | Human | Esophagus | ESCC | 3.96e-09 | 1.77e-01 | 0.1287 |
| 11019 | LIAS | P26T-E | Human | Esophagus | ESCC | 8.55e-12 | 2.38e-01 | 0.1276 |
| 11019 | LIAS | P27T-E | Human | Esophagus | ESCC | 3.68e-14 | 1.82e-01 | 0.1055 |
| 11019 | LIAS | P28T-E | Human | Esophagus | ESCC | 6.63e-08 | 1.83e-01 | 0.1149 |
| 11019 | LIAS | P30T-E | Human | Esophagus | ESCC | 2.25e-06 | 2.66e-01 | 0.137 |
| 11019 | LIAS | P31T-E | Human | Esophagus | ESCC | 3.23e-10 | 1.88e-01 | 0.1251 |
| 11019 | LIAS | P32T-E | Human | Esophagus | ESCC | 2.32e-12 | 2.39e-01 | 0.1666 |
| 11019 | LIAS | P37T-E | Human | Esophagus | ESCC | 1.53e-04 | 6.78e-02 | 0.1371 |
| 11019 | LIAS | P39T-E | Human | Esophagus | ESCC | 2.66e-08 | 1.62e-01 | 0.0894 |
| Page: 1 2 3 |
| Tissue | Expression Dynamics | Abbreviation |
| Esophagus | 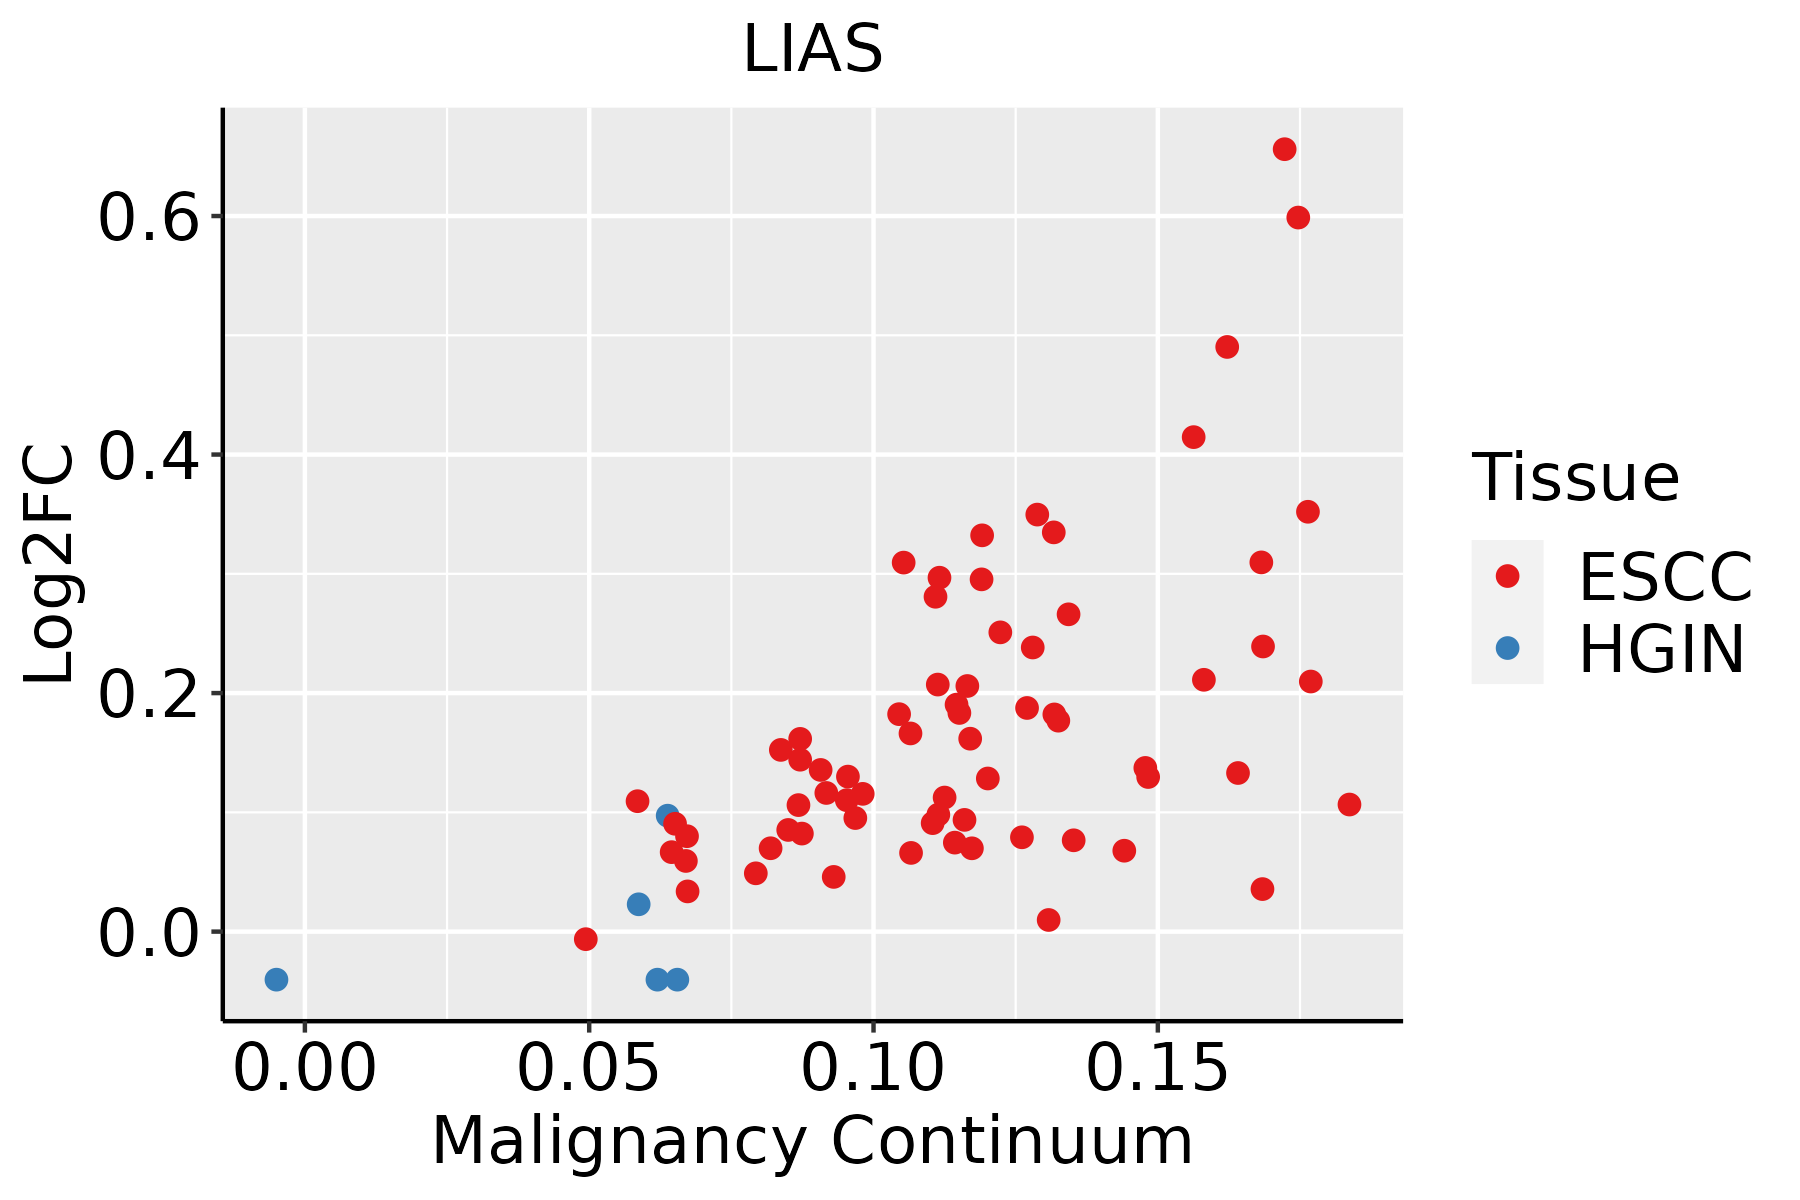 | ESCC: Esophageal squamous cell carcinoma |
| HGIN: High-grade intraepithelial neoplasias | ||
| LGIN: Low-grade intraepithelial neoplasias | ||
| Liver | 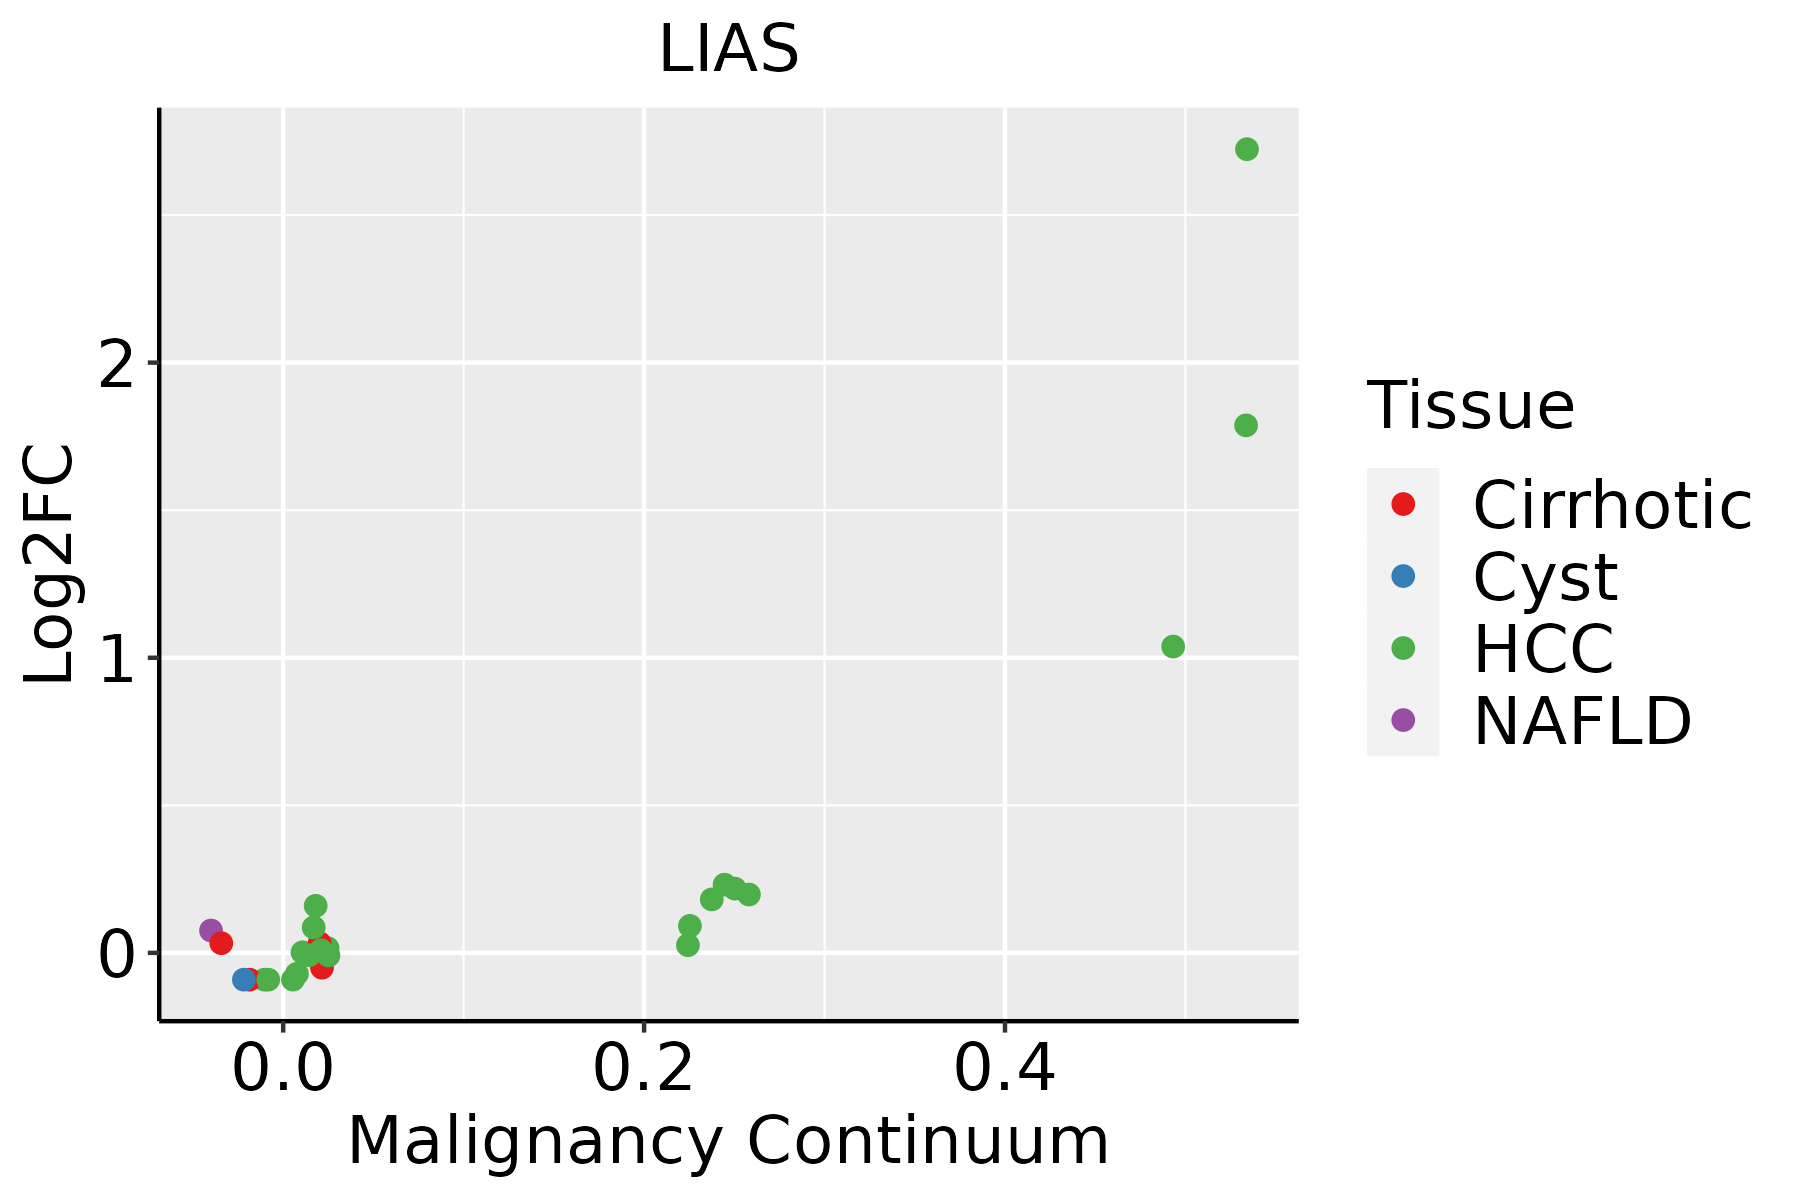 | HCC: Hepatocellular carcinoma |
| NAFLD: Non-alcoholic fatty liver disease | ||
| Oral Cavity | 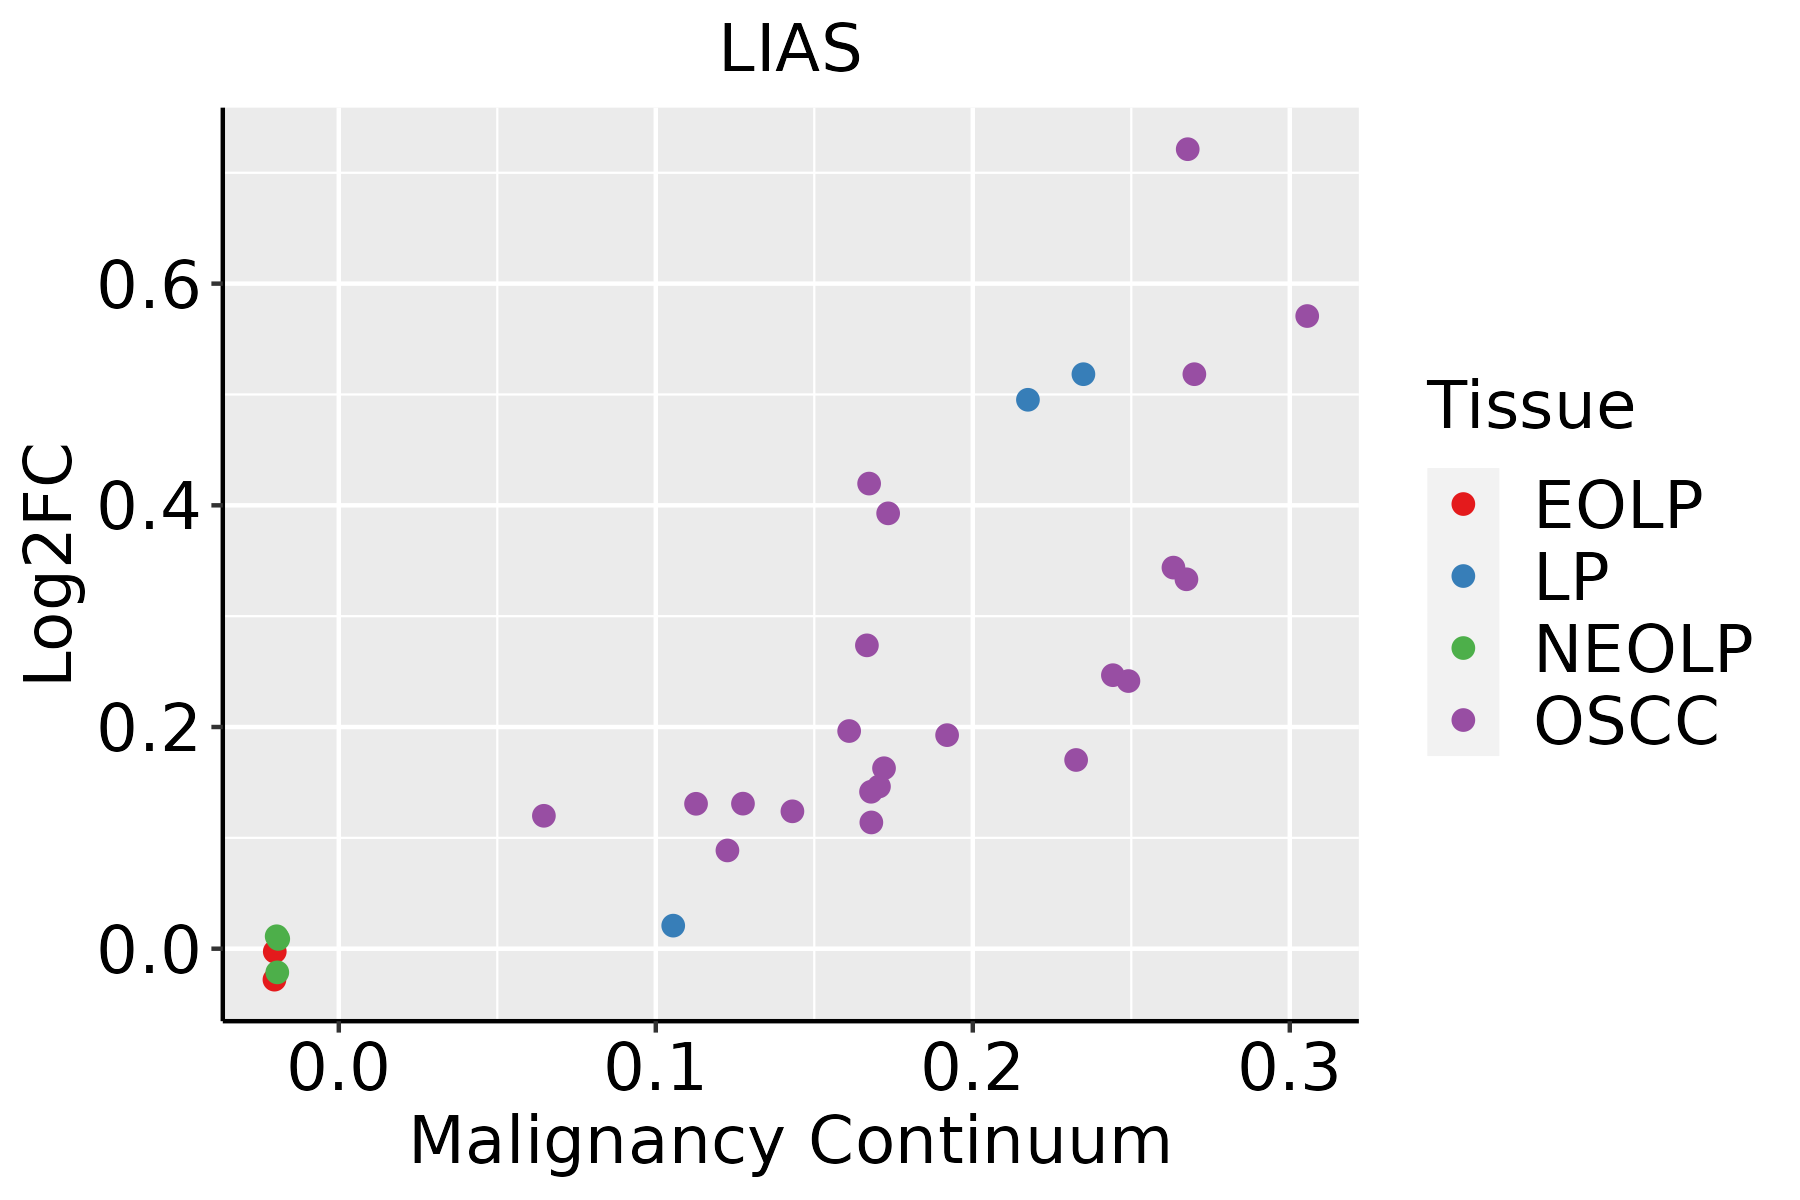 | EOLP: Erosive Oral lichen planus |
| LP: leukoplakia | ||
| NEOLP: Non-erosive oral lichen planus | ||
| OSCC: Oral squamous cell carcinoma |
| ∗log2FC in expression of this searched gene in stem-like cells from each diseased tissue sample relative to stem-like cells in normal samples in each tissue plotted against the malignancy continuum. Samples are colored based on if they are from different disease stage. |
Top |
Malignant transformation related pathway analysis |
| Find out the enriched GO biological processes and KEGG pathways involved in transition from healthy to precancer to cancer |
| Tissue | Disease Stage | Enriched GO biological Processes |
| Colorectum | AD |  |
| Colorectum | SER |  |
| Colorectum | MSS |  |
| Colorectum | MSI-H |  |
| Colorectum | FAP |  |
| ∗Top 15 enriched GO BP terms are showed in the bar plot of each disease state in each tissue. Each row represents a significant GO biological process which is colored according to the -log10(p.adjust). |
| Page: 1 2 3 4 5 6 7 8 9 |
| GO ID | Tissue | Disease Stage | Description | Gene Ratio | Bg Ratio | pvalue | p.adjust | Count |
| GO:0006979111 | Esophagus | ESCC | response to oxidative stress | 303/8552 | 446/18723 | 7.15e-22 | 1.30e-19 | 303 |
| GO:001820514 | Esophagus | ESCC | peptidyl-lysine modification | 259/8552 | 376/18723 | 3.90e-20 | 5.26e-18 | 259 |
| GO:005160418 | Esophagus | ESCC | protein maturation | 189/8552 | 294/18723 | 7.64e-11 | 2.39e-09 | 189 |
| GO:000184115 | Esophagus | ESCC | neural tube formation | 75/8552 | 102/18723 | 9.68e-09 | 1.95e-07 | 75 |
| GO:000184314 | Esophagus | ESCC | neural tube closure | 66/8552 | 88/18723 | 1.98e-08 | 3.82e-07 | 66 |
| GO:001402014 | Esophagus | ESCC | primary neural tube formation | 69/8552 | 94/18723 | 4.22e-08 | 7.76e-07 | 69 |
| GO:006060614 | Esophagus | ESCC | tube closure | 66/8552 | 89/18723 | 4.24e-08 | 7.76e-07 | 66 |
| GO:00219159 | Esophagus | ESCC | neural tube development | 101/8552 | 152/18723 | 1.78e-07 | 2.79e-06 | 101 |
| GO:00163316 | Esophagus | ESCC | morphogenesis of embryonic epithelium | 98/8552 | 147/18723 | 2.12e-07 | 3.27e-06 | 98 |
| GO:00067906 | Esophagus | ESCC | sulfur compound metabolic process | 201/8552 | 339/18723 | 2.64e-07 | 3.94e-06 | 201 |
| GO:000183814 | Esophagus | ESCC | embryonic epithelial tube formation | 83/8552 | 121/18723 | 2.78e-07 | 4.08e-06 | 83 |
| GO:003514815 | Esophagus | ESCC | tube formation | 96/8552 | 148/18723 | 1.86e-06 | 2.16e-05 | 96 |
| GO:00442725 | Esophagus | ESCC | sulfur compound biosynthetic process | 96/8552 | 148/18723 | 1.86e-06 | 2.16e-05 | 96 |
| GO:00721759 | Esophagus | ESCC | epithelial tube formation | 86/8552 | 132/18723 | 4.81e-06 | 5.10e-05 | 86 |
| GO:006056210 | Esophagus | ESCC | epithelial tube morphogenesis | 187/8552 | 325/18723 | 9.95e-06 | 9.44e-05 | 187 |
| GO:00066318 | Esophagus | ESCC | fatty acid metabolic process | 217/8552 | 390/18723 | 4.21e-05 | 3.39e-04 | 217 |
| GO:003249619 | Esophagus | ESCC | response to lipopolysaccharide | 191/8552 | 343/18723 | 1.11e-04 | 7.73e-04 | 191 |
| GO:00463948 | Esophagus | ESCC | carboxylic acid biosynthetic process | 175/8552 | 314/18723 | 1.98e-04 | 1.26e-03 | 175 |
| GO:00160538 | Esophagus | ESCC | organic acid biosynthetic process | 175/8552 | 316/18723 | 3.04e-04 | 1.82e-03 | 175 |
| GO:000223719 | Esophagus | ESCC | response to molecule of bacterial origin | 194/8552 | 363/18723 | 1.64e-03 | 7.61e-03 | 194 |
| Page: 1 2 3 4 |
| Pathway ID | Tissue | Disease Stage | Description | Gene Ratio | Bg Ratio | pvalue | p.adjust | qvalue | Count |
| hsa012405 | Esophagus | ESCC | Biosynthesis of cofactors | 97/4205 | 153/8465 | 3.88e-04 | 1.35e-03 | 6.94e-04 | 97 |
| hsa0124012 | Esophagus | ESCC | Biosynthesis of cofactors | 97/4205 | 153/8465 | 3.88e-04 | 1.35e-03 | 6.94e-04 | 97 |
| hsa01240 | Liver | Cirrhotic | Biosynthesis of cofactors | 66/2530 | 153/8465 | 3.11e-04 | 1.99e-03 | 1.23e-03 | 66 |
| hsa012401 | Liver | Cirrhotic | Biosynthesis of cofactors | 66/2530 | 153/8465 | 3.11e-04 | 1.99e-03 | 1.23e-03 | 66 |
| hsa012402 | Liver | HCC | Biosynthesis of cofactors | 103/4020 | 153/8465 | 4.67e-07 | 5.05e-06 | 2.81e-06 | 103 |
| hsa00785 | Liver | HCC | Lipoic acid metabolism | 14/4020 | 19/8465 | 1.89e-02 | 4.40e-02 | 2.45e-02 | 14 |
| hsa012403 | Liver | HCC | Biosynthesis of cofactors | 103/4020 | 153/8465 | 4.67e-07 | 5.05e-06 | 2.81e-06 | 103 |
| hsa007851 | Liver | HCC | Lipoic acid metabolism | 14/4020 | 19/8465 | 1.89e-02 | 4.40e-02 | 2.45e-02 | 14 |
| hsa012404 | Oral cavity | OSCC | Biosynthesis of cofactors | 88/3704 | 153/8465 | 3.84e-04 | 1.20e-03 | 6.12e-04 | 88 |
| hsa0124011 | Oral cavity | OSCC | Biosynthesis of cofactors | 88/3704 | 153/8465 | 3.84e-04 | 1.20e-03 | 6.12e-04 | 88 |
| Page: 1 |
Top |
Cell-cell communication analysis |
| Identification of potential cell-cell interactions between two cell types and their ligand-receptor pairs for different disease states |
| Ligand | Receptor | LRpair | Pathway | Tissue | Disease Stage |
| Page: 1 |
Top |
Single-cell gene regulatory network inference analysis |
| Find out the significant the regulons (TFs) and the target genes of each regulon across cell types for different disease states |
| TF | Cell Type | Tissue | Disease Stage | Target Gene | RSS | Regulon Activity |
| ∗The dot plots of a searched regulon are shown for all cell subpopulations in each disease state of each tissue based on the regulon specific score inferred using pySCENIC and by calculating the average expression. |
| Page: 1 |
Top |
Somatic mutation of malignant transformation related genes |
| Annotation of somatic variants for genes involved in malignant transformation |
| Hugo Symbol | Variant Class | Variant Classification | dbSNP RS | HGVSc | HGVSp | HGVSp Short | SWISSPROT | BIOTYPE | SIFT | PolyPhen | Tumor Sample Barcode | Tissue | Histology | Sex | Age | Stage | Therapy Types | Drugs | Outcome |
| LIAS | SNV | Missense_Mutation | rs753903111 | c.212N>A | p.Gly71Glu | p.G71E | protein_coding | tolerated(0.06) | possibly_damaging(0.898) | TCGA-AC-A23H-01 | Breast | breast invasive carcinoma | Female | >=65 | I/II | Unknown | Unknown | PD | |
| LIAS | SNV | Missense_Mutation | novel | c.1100G>T | p.Arg367Ile | p.R367I | protein_coding | deleterious(0) | possibly_damaging(0.873) | TCGA-AN-A046-01 | Breast | breast invasive carcinoma | Female | >=65 | I/II | Unknown | Unknown | SD | |
| LIAS | deletion | Frame_Shift_Del | novel | c.3delN | p.Met1? | p.M1? | protein_coding | TCGA-D8-A27V-01 | Breast | breast invasive carcinoma | Female | <65 | I/II | Hormone Therapy | tamoxiphen | SD | |||
| LIAS | SNV | Missense_Mutation | c.319N>A | p.Glu107Lys | p.E107K | protein_coding | deleterious(0) | probably_damaging(0.967) | TCGA-JW-A5VJ-01 | Cervix | cervical & endocervical cancer | Female | <65 | I/II | Unknown | Unknown | PD | ||
| LIAS | deletion | Frame_Shift_Del | rs748571616 | c.100delN | p.Lys36ArgfsTer31 | p.K36Rfs*31 | protein_coding | TCGA-EA-A410-01 | Cervix | cervical & endocervical cancer | Female | <65 | I/II | Unknown | Unknown | SD | |||
| LIAS | SNV | Missense_Mutation | novel | c.680N>T | p.Ala227Val | p.A227V | protein_coding | tolerated(0.15) | possibly_damaging(0.447) | TCGA-AA-3984-01 | Colorectum | colon adenocarcinoma | Female | <65 | I/II | Unknown | Unknown | SD | |
| LIAS | SNV | Missense_Mutation | c.434N>A | p.Ser145Tyr | p.S145Y | protein_coding | deleterious(0) | probably_damaging(0.992) | TCGA-AA-A00N-01 | Colorectum | colon adenocarcinoma | Male | >=65 | I/II | Unknown | Unknown | PD | ||
| LIAS | SNV | Missense_Mutation | rs866532098 | c.371N>T | p.Ala124Val | p.A124V | protein_coding | deleterious(0.03) | benign(0.018) | TCGA-CK-4951-01 | Colorectum | colon adenocarcinoma | Female | >=65 | I/II | Unknown | Unknown | PD | |
| LIAS | SNV | Missense_Mutation | novel | c.142N>G | p.Phe48Val | p.F48V | protein_coding | deleterious(0) | probably_damaging(0.999) | TCGA-AG-A002-01 | Colorectum | rectum adenocarcinoma | Male | <65 | I/II | Unknown | Unknown | SD | |
| LIAS | deletion | Frame_Shift_Del | rs748571616 | c.100delN | p.Lys36ArgfsTer31 | p.K36Rfs*31 | protein_coding | TCGA-AA-3715-01 | Colorectum | colon adenocarcinoma | Male | >=65 | I/II | Unknown | Unknown | PD |
| Page: 1 2 3 4 5 |
Top |
Related drugs of malignant transformation related genes |
| Identification of chemicals and drugs interact with genes involved in malignant transfromation |
| (DGIdb 4.0) |
| Entrez ID | Symbol | Category | Interaction Types | Drug Claim Name | Drug Name | PMIDs |
| Page: 1 |

Copyright 2023-Present -The University of Texas Health Science Center at Houston |