
|
|||||
|
 | |
| |
| |
| |
| |
| |
|
Gene: LHX2 |
Gene summary for LHX2 |
| Gene information | Species | Human | Gene symbol | LHX2 | Gene ID | 9355 |
| Gene name | LIM homeobox 2 | |
| Gene Alias | LH2 | |
| Cytomap | 9q33.3 | |
| Gene Type | protein-coding | GO ID | GO:0000902 | UniProtAcc | B3KNJ5 |
Top |
Malignant transformation analysis |
| Identification of the aberrant gene expression in precancerous and cancerous lesions by comparing the gene expression of stem-like cells in diseased tissues with normal stem cells |
| Entrez ID | Symbol | Replicates | Species | Organ | Tissue | Adj P-value | Log2FC | Malignancy |
| 9355 | LHX2 | P1_S1_AK | Human | Skin | AK | 1.93e-11 | 3.58e-01 | -0.3399 |
| 9355 | LHX2 | P2_S3_AK | Human | Skin | AK | 1.13e-16 | 4.40e-01 | -0.3287 |
| 9355 | LHX2 | P2_S4_SCCIS | Human | Skin | SCCIS | 2.16e-07 | 2.39e-01 | -0.3043 |
| 9355 | LHX2 | P3_S6_AK | Human | Skin | AK | 2.08e-05 | 2.07e-01 | -0.3256 |
| 9355 | LHX2 | P2_cSCC | Human | Skin | cSCC | 4.51e-15 | 5.45e-01 | -0.024 |
| 9355 | LHX2 | cSCC_p3 | Human | Skin | cSCC | 3.76e-02 | 8.09e-02 | -0.2085 |
| Page: 1 |
| Tissue | Expression Dynamics | Abbreviation |
| Skin | 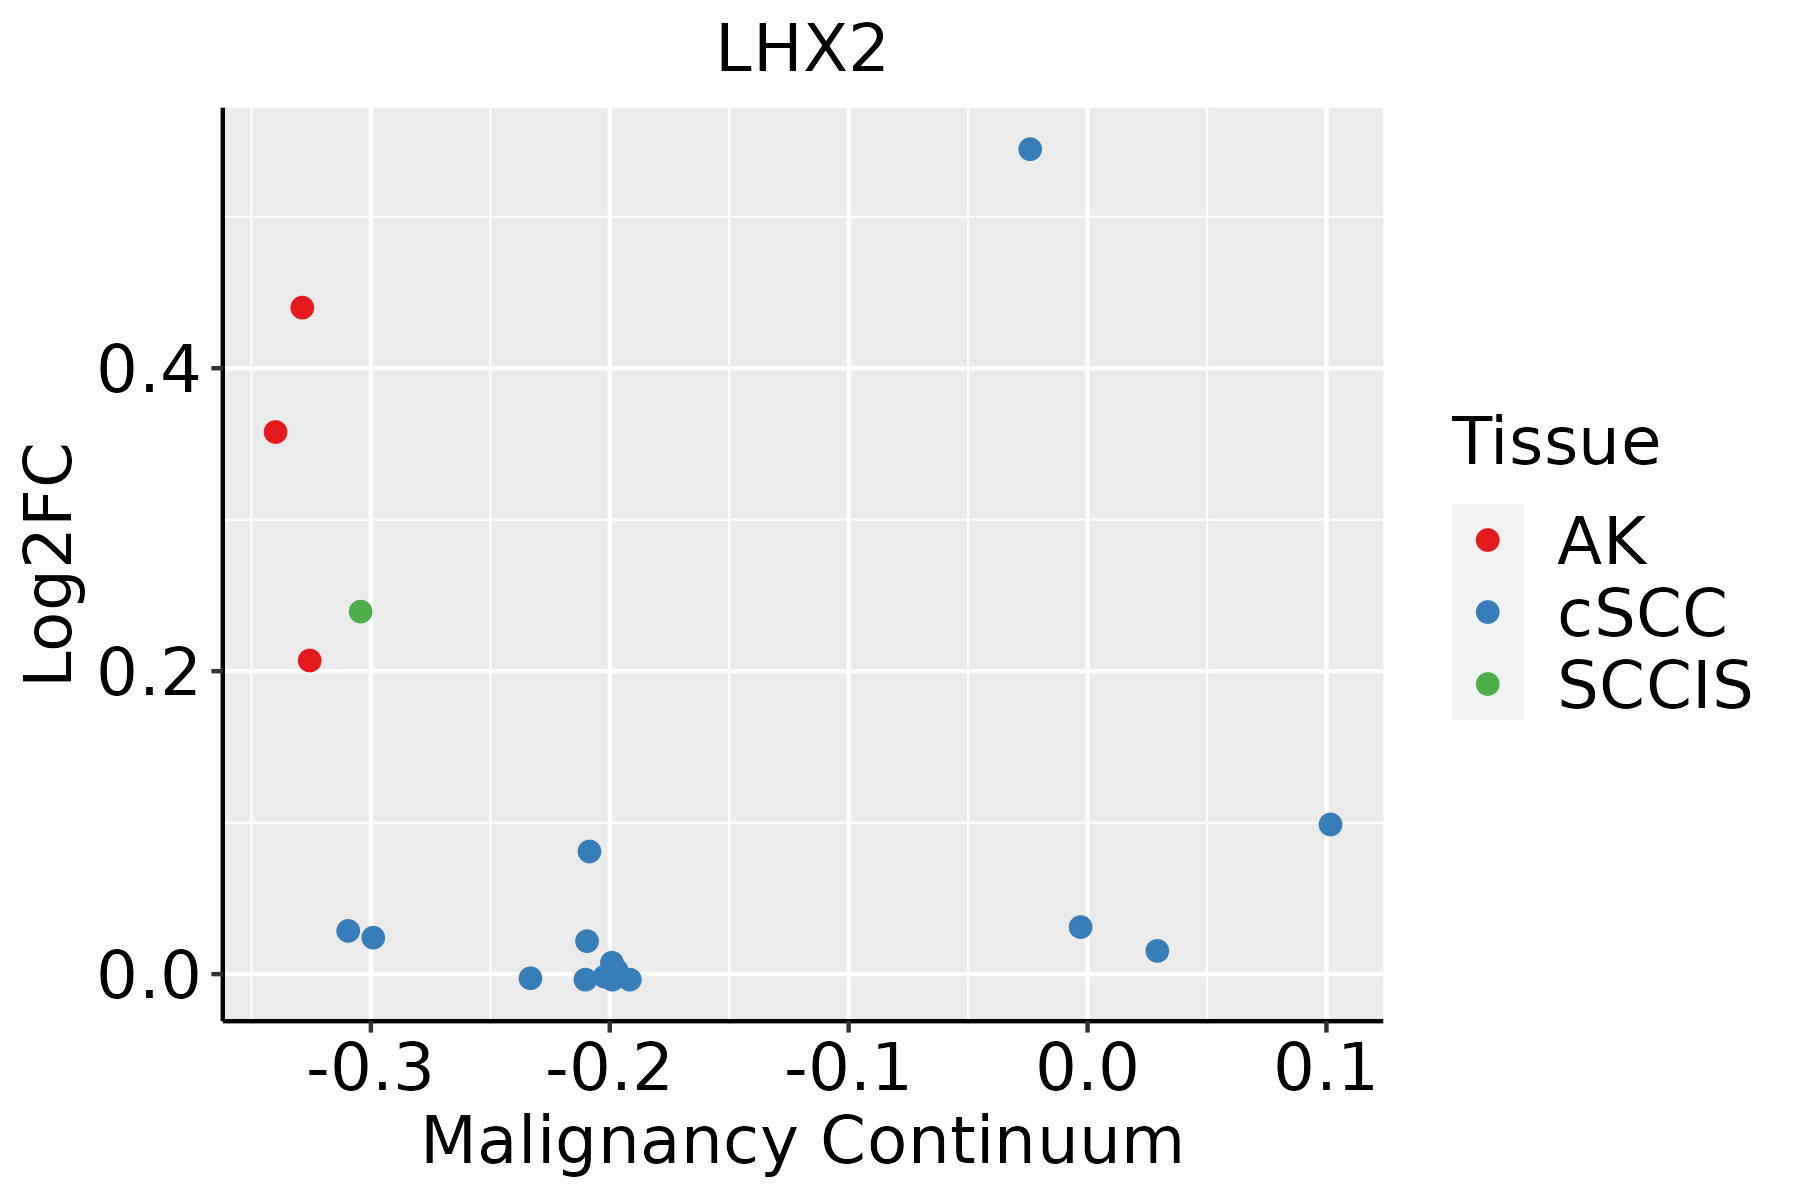 | AK: Actinic keratosis |
| cSCC: Cutaneous squamous cell carcinoma | ||
| SCCIS:squamous cell carcinoma in situ |
| ∗log2FC in expression of this searched gene in stem-like cells from each diseased tissue sample relative to stem-like cells in normal samples in each tissue plotted against the malignancy continuum. Samples are colored based on if they are from different disease stage. |
Top |
Malignant transformation related pathway analysis |
| Find out the enriched GO biological processes and KEGG pathways involved in transition from healthy to precancer to cancer |
| Tissue | Disease Stage | Enriched GO biological Processes |
| Colorectum | AD |  |
| Colorectum | SER |  |
| Colorectum | MSS |  |
| Colorectum | MSI-H |  |
| Colorectum | FAP |  |
| ∗Top 15 enriched GO BP terms are showed in the bar plot of each disease state in each tissue. Each row represents a significant GO biological process which is colored according to the -log10(p.adjust). |
| Page: 1 2 3 4 5 6 7 8 9 |
| GO ID | Tissue | Disease Stage | Description | Gene Ratio | Bg Ratio | pvalue | p.adjust | Count |
| GO:000854417 | Skin | AK | epidermis development | 79/1910 | 324/18723 | 1.04e-13 | 3.25e-11 | 79 |
| GO:00435889 | Skin | AK | skin development | 67/1910 | 263/18723 | 9.02e-13 | 2.14e-10 | 67 |
| GO:006156416 | Skin | AK | axon development | 91/1910 | 467/18723 | 8.60e-10 | 8.63e-08 | 91 |
| GO:001604920 | Skin | AK | cell growth | 93/1910 | 482/18723 | 9.55e-10 | 9.42e-08 | 93 |
| GO:000716326 | Skin | AK | establishment or maintenance of cell polarity | 53/1910 | 218/18723 | 1.32e-09 | 1.26e-07 | 53 |
| GO:005109826 | Skin | AK | regulation of binding | 74/1910 | 363/18723 | 4.40e-09 | 3.30e-07 | 74 |
| GO:000740916 | Skin | AK | axonogenesis | 80/1910 | 418/18723 | 2.07e-08 | 1.19e-06 | 80 |
| GO:00423034 | Skin | AK | molting cycle | 29/1910 | 107/18723 | 6.35e-07 | 2.20e-05 | 29 |
| GO:00426334 | Skin | AK | hair cycle | 29/1910 | 107/18723 | 6.35e-07 | 2.20e-05 | 29 |
| GO:00987733 | Skin | AK | skin epidermis development | 25/1910 | 85/18723 | 7.05e-07 | 2.41e-05 | 25 |
| GO:00019423 | Skin | AK | hair follicle development | 24/1910 | 81/18723 | 1.01e-06 | 3.21e-05 | 24 |
| GO:00224044 | Skin | AK | molting cycle process | 24/1910 | 84/18723 | 2.08e-06 | 6.00e-05 | 24 |
| GO:00224054 | Skin | AK | hair cycle process | 24/1910 | 84/18723 | 2.08e-06 | 6.00e-05 | 24 |
| GO:006056016 | Skin | AK | developmental growth involved in morphogenesis | 47/1910 | 234/18723 | 4.30e-06 | 1.05e-04 | 47 |
| GO:005076713 | Skin | AK | regulation of neurogenesis | 65/1910 | 364/18723 | 5.10e-06 | 1.19e-04 | 65 |
| GO:00309006 | Skin | AK | forebrain development | 66/1910 | 379/18723 | 1.02e-05 | 2.17e-04 | 66 |
| GO:005110126 | Skin | AK | regulation of DNA binding | 28/1910 | 118/18723 | 1.60e-05 | 3.09e-04 | 28 |
| GO:00163317 | Skin | AK | morphogenesis of embryonic epithelium | 32/1910 | 147/18723 | 2.69e-05 | 4.76e-04 | 32 |
| GO:003514816 | Skin | AK | tube formation | 32/1910 | 148/18723 | 3.11e-05 | 5.26e-04 | 32 |
| GO:00519607 | Skin | AK | regulation of nervous system development | 72/1910 | 443/18723 | 4.53e-05 | 7.11e-04 | 72 |
| Page: 1 2 3 4 5 6 |
| Pathway ID | Tissue | Disease Stage | Description | Gene Ratio | Bg Ratio | pvalue | p.adjust | qvalue | Count |
| Page: 1 |
Top |
Cell-cell communication analysis |
| Identification of potential cell-cell interactions between two cell types and their ligand-receptor pairs for different disease states |
| Ligand | Receptor | LRpair | Pathway | Tissue | Disease Stage |
| Page: 1 |
Top |
Single-cell gene regulatory network inference analysis |
| Find out the significant the regulons (TFs) and the target genes of each regulon across cell types for different disease states |
| TF | Cell Type | Tissue | Disease Stage | Target Gene | RSS | Regulon Activity |
| LHX2 | STM | Skin | AK | LMCD1,BOC,CYP1B1, etc. | 1.22e-01 |  |
| ∗The dot plots of a searched regulon are shown for all cell subpopulations in each disease state of each tissue based on the regulon specific score inferred using pySCENIC and by calculating the average expression. |
| Page: 1 |
Top |
Somatic mutation of malignant transformation related genes |
| Annotation of somatic variants for genes involved in malignant transformation |
| Hugo Symbol | Variant Class | Variant Classification | dbSNP RS | HGVSc | HGVSp | HGVSp Short | SWISSPROT | BIOTYPE | SIFT | PolyPhen | Tumor Sample Barcode | Tissue | Histology | Sex | Age | Stage | Therapy Types | Drugs | Outcome |
| LHX2 | SNV | Missense_Mutation | novel | c.270N>T | p.Glu90Asp | p.E90D | P50458 | protein_coding | deleterious(0.01) | benign(0.238) | TCGA-C8-A12Z-01 | Breast | breast invasive carcinoma | Female | <65 | I/II | Chemotherapy | 5-fluorouracil | CR |
| LHX2 | SNV | Missense_Mutation | c.1070C>G | p.Ser357Trp | p.S357W | P50458 | protein_coding | deleterious(0) | probably_damaging(0.996) | TCGA-C8-A1HM-01 | Breast | breast invasive carcinoma | Female | >=65 | I/II | Chemotherapy | doxorubicin | CR | |
| LHX2 | SNV | Missense_Mutation | novel | c.182C>G | p.Ser61Trp | p.S61W | P50458 | protein_coding | tolerated(0.13) | possibly_damaging(0.881) | TCGA-C8-A8HQ-01 | Breast | breast invasive carcinoma | Female | <65 | I/II | Unknown | Unknown | SD |
| LHX2 | insertion | Nonsense_Mutation | novel | c.459_460insTTGCGGAGACTCTGGGTGAAGTAGAAGTCTCT | p.Asp154LeufsTer8 | p.D154Lfs*8 | P50458 | protein_coding | TCGA-A7-A0CE-01 | Breast | breast invasive carcinoma | Female | <65 | I/II | Chemotherapy | adriamycin | SD | ||
| LHX2 | insertion | Frame_Shift_Ins | novel | c.492_493insGTCTGTGTCTCTCTCTCTT | p.Cys165ValfsTer71 | p.C165Vfs*71 | P50458 | protein_coding | TCGA-A8-A08O-01 | Breast | breast invasive carcinoma | Female | <65 | III/IV | Chemotherapy | docetaxel | PD | ||
| LHX2 | SNV | Missense_Mutation | c.173N>A | p.Gly58Asp | p.G58D | P50458 | protein_coding | tolerated(0.12) | benign(0.111) | TCGA-A6-5665-01 | Colorectum | colon adenocarcinoma | Female | >=65 | I/II | Unknown | Unknown | PD | |
| LHX2 | SNV | Missense_Mutation | c.566N>T | p.Ala189Val | p.A189V | P50458 | protein_coding | tolerated(0.3) | probably_damaging(0.939) | TCGA-A6-6137-01 | Colorectum | colon adenocarcinoma | Male | <65 | III/IV | Chemotherapy | fluorouracil | SD | |
| LHX2 | SNV | Missense_Mutation | c.340N>T | p.Arg114Cys | p.R114C | P50458 | protein_coding | deleterious(0) | probably_damaging(0.935) | TCGA-AA-3864-01 | Colorectum | colon adenocarcinoma | Male | >=65 | I/II | Unknown | Unknown | SD | |
| LHX2 | SNV | Missense_Mutation | rs549494441 | c.425N>T | p.Thr142Met | p.T142M | P50458 | protein_coding | deleterious(0.02) | benign(0.352) | TCGA-AA-3947-01 | Colorectum | colon adenocarcinoma | Female | <65 | I/II | Unknown | Unknown | SD |
| LHX2 | SNV | Missense_Mutation | novel | c.670C>T | p.Arg224Trp | p.R224W | P50458 | protein_coding | deleterious(0) | probably_damaging(0.992) | TCGA-AA-A022-01 | Colorectum | colon adenocarcinoma | Female | >=65 | I/II | Unknown | Unknown | SD |
| Page: 1 2 3 4 |
Top |
Related drugs of malignant transformation related genes |
| Identification of chemicals and drugs interact with genes involved in malignant transfromation |
| (DGIdb 4.0) |
| Entrez ID | Symbol | Category | Interaction Types | Drug Claim Name | Drug Name | PMIDs |
| Page: 1 |

Copyright 2023-Present -The University of Texas Health Science Center at Houston |