
|
|||||
|
 | |
| |
| |
| |
| |
| |
|
Gene: LHFPL2 |
Gene summary for LHFPL2 |
| Gene information | Species | Human | Gene symbol | LHFPL2 | Gene ID | 10184 |
| Gene name | LHFPL tetraspan subfamily member 2 | |
| Gene Alias | LHFPL2 | |
| Cytomap | 5q14.1 | |
| Gene Type | protein-coding | GO ID | GO:0000003 | UniProtAcc | A0A024RAM8 |
Top |
Malignant transformation analysis |
| Identification of the aberrant gene expression in precancerous and cancerous lesions by comparing the gene expression of stem-like cells in diseased tissues with normal stem cells |
| Entrez ID | Symbol | Replicates | Species | Organ | Tissue | Adj P-value | Log2FC | Malignancy |
| 10184 | LHFPL2 | HTA11_3410_2000001011 | Human | Colorectum | AD | 1.05e-07 | -3.54e-01 | 0.0155 |
| 10184 | LHFPL2 | HTA11_347_2000001011 | Human | Colorectum | AD | 5.46e-05 | 5.35e-01 | -0.1954 |
| 10184 | LHFPL2 | HTA11_83_2000001011 | Human | Colorectum | SER | 1.63e-02 | 6.29e-01 | -0.1526 |
| 10184 | LHFPL2 | HTA11_866_3004761011 | Human | Colorectum | AD | 2.66e-06 | -3.79e-01 | 0.096 |
| 10184 | LHFPL2 | HTA11_99999970781_79442 | Human | Colorectum | MSS | 2.71e-11 | -4.00e-01 | 0.294 |
| 10184 | LHFPL2 | HTA11_99999973899_84307 | Human | Colorectum | MSS | 7.50e-04 | -4.63e-01 | 0.2585 |
| 10184 | LHFPL2 | HTA11_99999974143_84620 | Human | Colorectum | MSS | 1.60e-10 | -3.78e-01 | 0.3005 |
| 10184 | LHFPL2 | A002-C-010 | Human | Colorectum | FAP | 1.79e-05 | -2.40e-01 | 0.242 |
| 10184 | LHFPL2 | A015-C-203 | Human | Colorectum | FAP | 7.62e-20 | -3.06e-01 | -0.1294 |
| 10184 | LHFPL2 | A015-C-204 | Human | Colorectum | FAP | 5.32e-03 | -1.02e-01 | -0.0228 |
| 10184 | LHFPL2 | A014-C-040 | Human | Colorectum | FAP | 6.92e-03 | -3.33e-01 | -0.1184 |
| 10184 | LHFPL2 | A002-C-201 | Human | Colorectum | FAP | 3.33e-10 | -2.44e-01 | 0.0324 |
| 10184 | LHFPL2 | A001-C-119 | Human | Colorectum | FAP | 7.23e-11 | -4.48e-01 | -0.1557 |
| 10184 | LHFPL2 | A001-C-108 | Human | Colorectum | FAP | 6.62e-09 | -1.47e-01 | -0.0272 |
| 10184 | LHFPL2 | A002-C-205 | Human | Colorectum | FAP | 1.16e-16 | -3.15e-01 | -0.1236 |
| 10184 | LHFPL2 | A015-C-005 | Human | Colorectum | FAP | 2.02e-06 | -2.60e-01 | -0.0336 |
| 10184 | LHFPL2 | A015-C-006 | Human | Colorectum | FAP | 5.10e-10 | -1.56e-01 | -0.0994 |
| 10184 | LHFPL2 | A015-C-106 | Human | Colorectum | FAP | 4.61e-06 | -2.51e-01 | -0.0511 |
| 10184 | LHFPL2 | A002-C-114 | Human | Colorectum | FAP | 2.43e-11 | -3.21e-01 | -0.1561 |
| 10184 | LHFPL2 | A015-C-104 | Human | Colorectum | FAP | 1.36e-19 | -3.25e-01 | -0.1899 |
| Page: 1 2 3 |
| Tissue | Expression Dynamics | Abbreviation |
| Colorectum (GSE201348) | 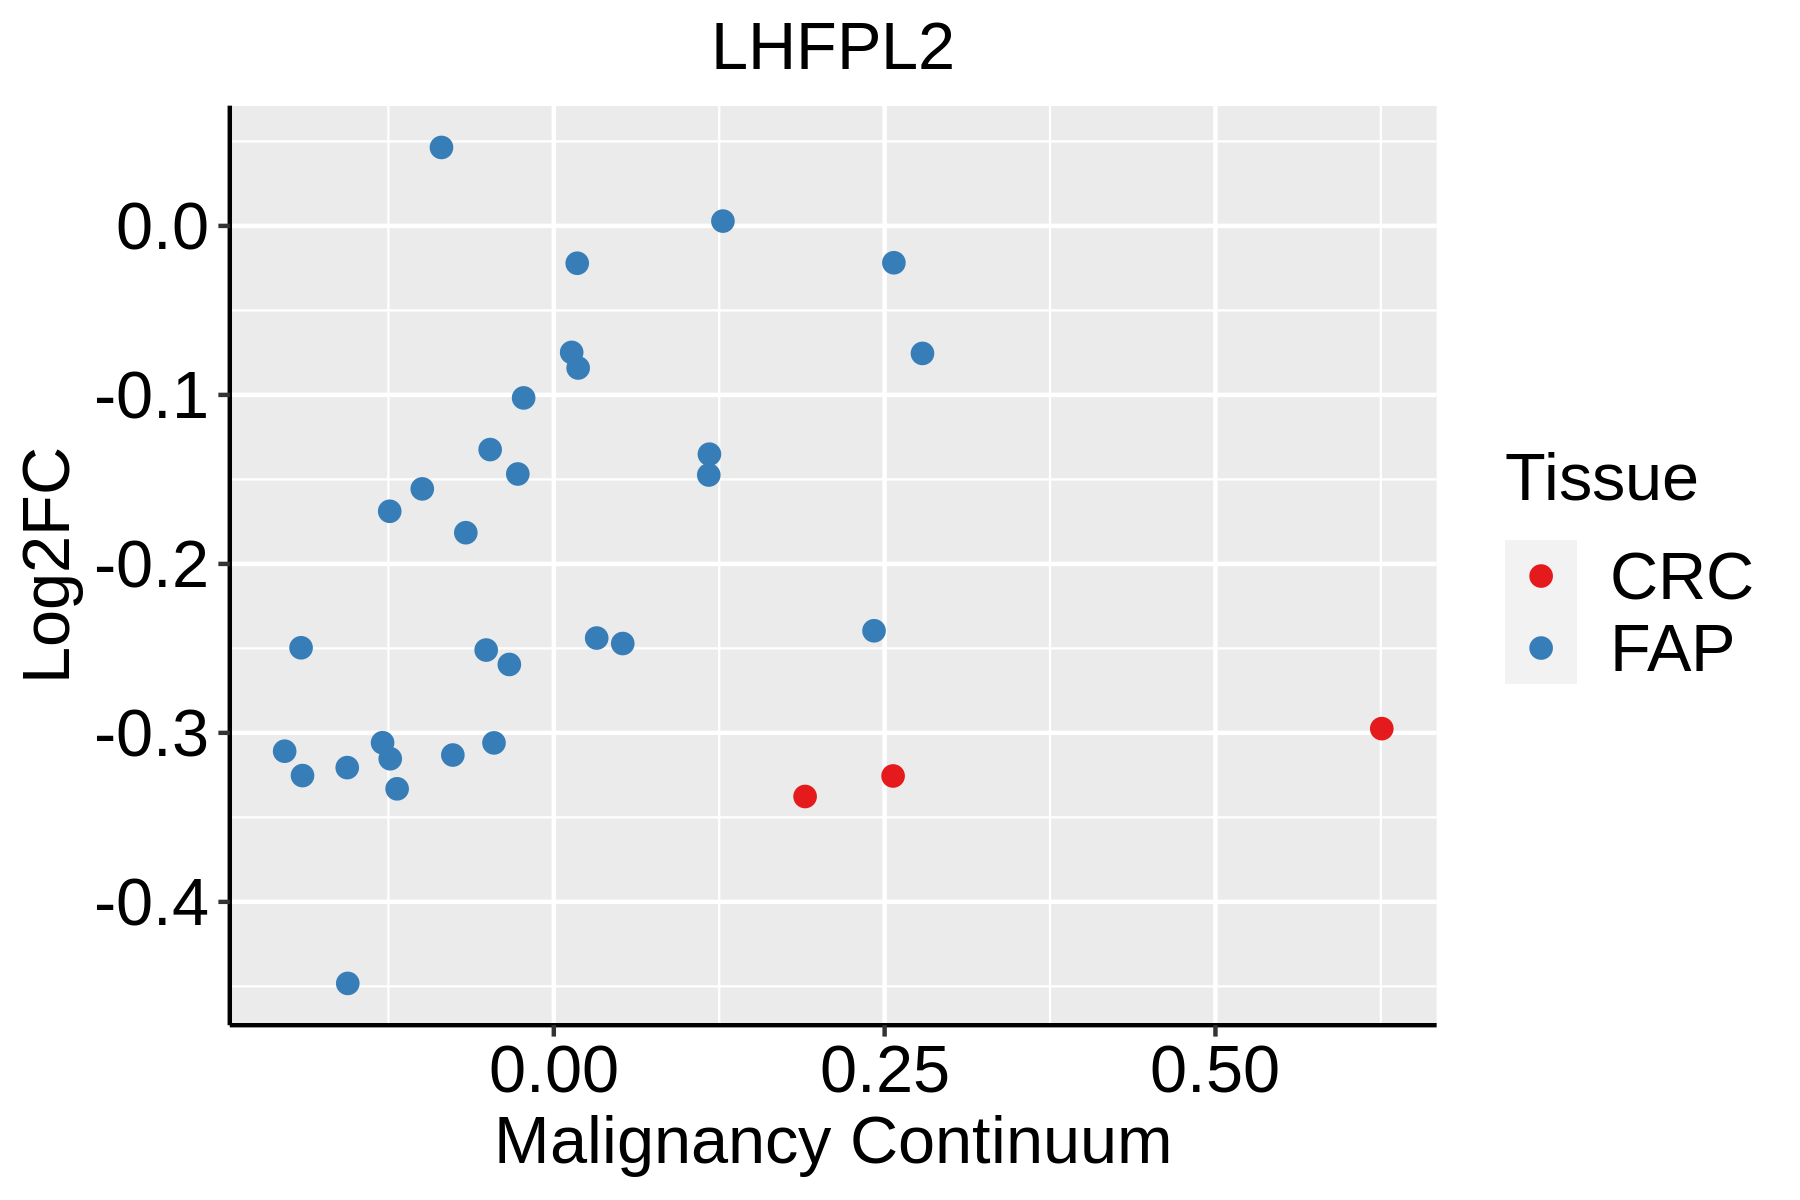 | FAP: Familial adenomatous polyposis |
| CRC: Colorectal cancer | ||
| Colorectum (HTA11) |  | AD: Adenomas |
| SER: Sessile serrated lesions | ||
| MSI-H: Microsatellite-high colorectal cancer | ||
| MSS: Microsatellite stable colorectal cancer | ||
| Thyroid | 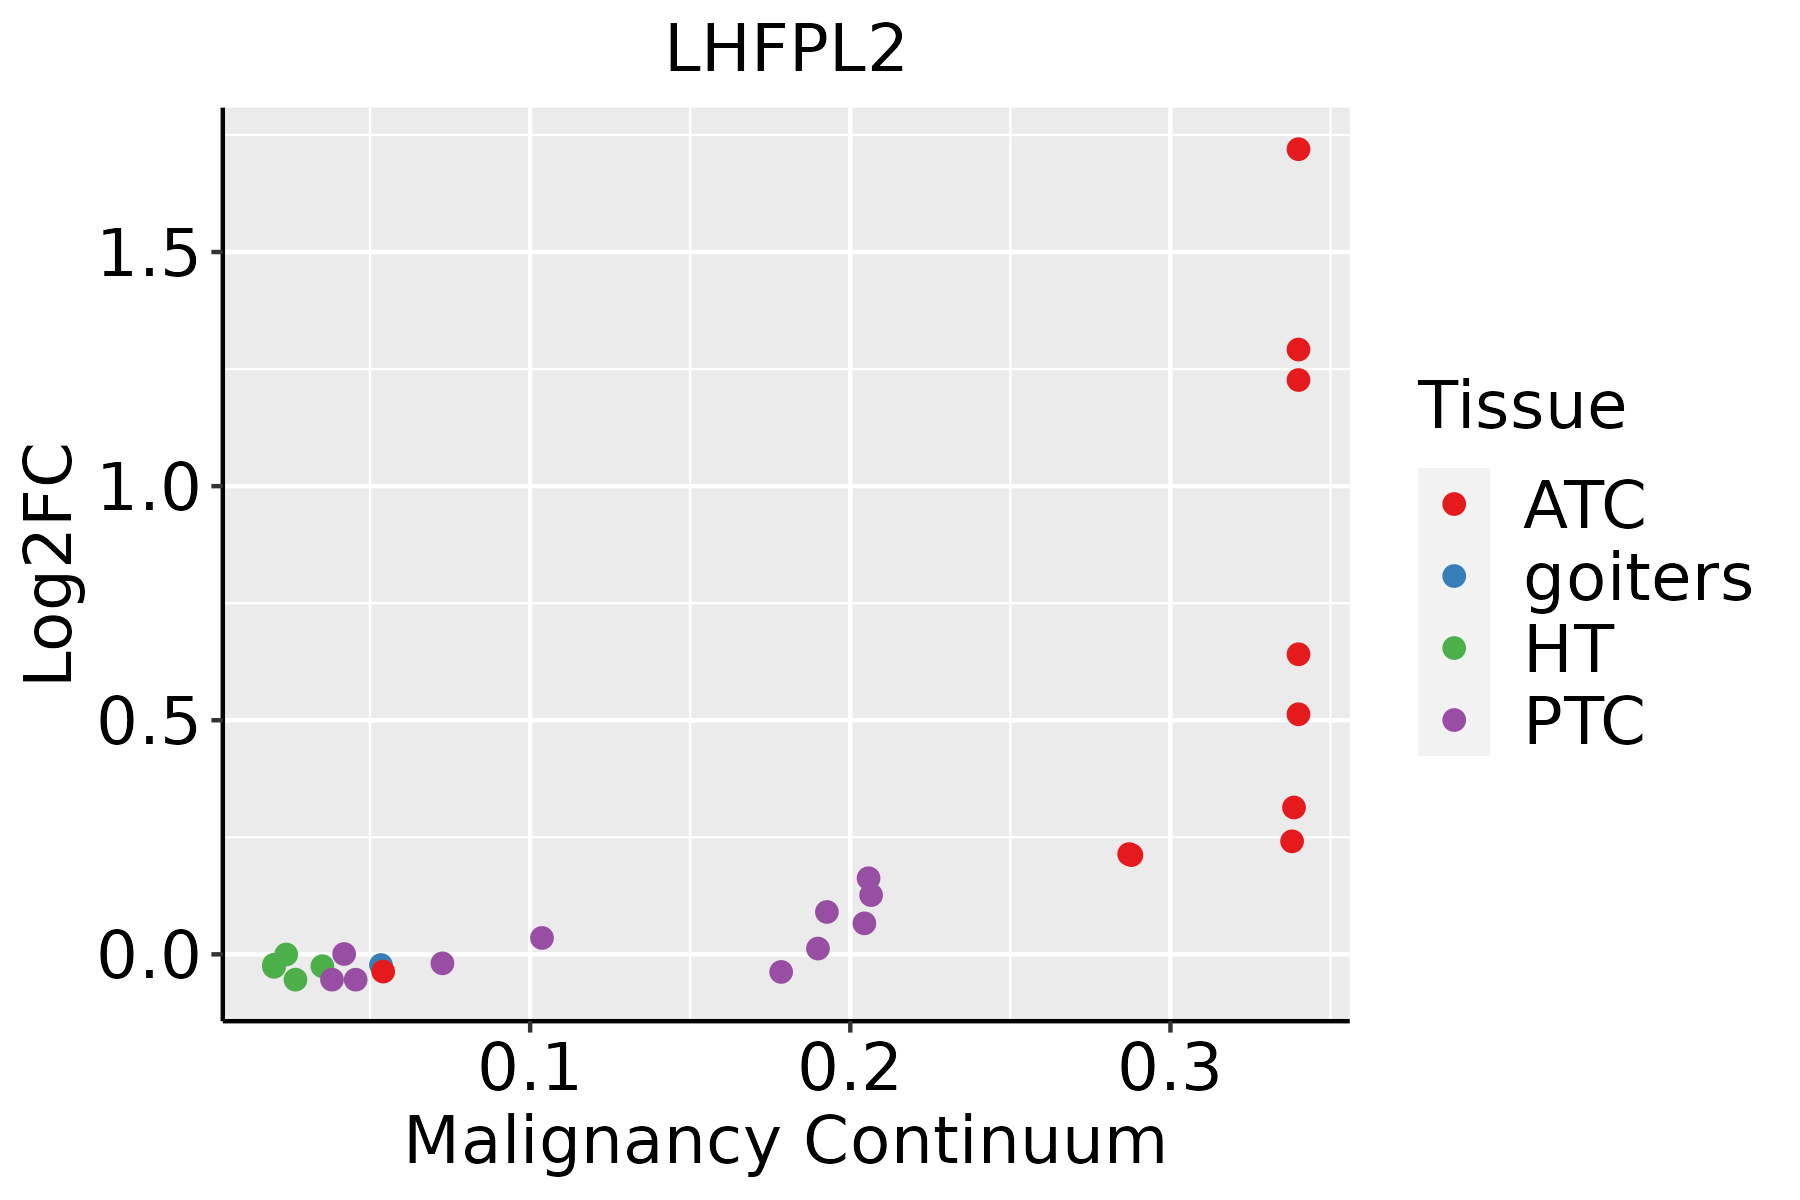 | ATC: Anaplastic thyroid cancer |
| HT: Hashimoto's thyroiditis | ||
| PTC: Papillary thyroid cancer |
| ∗log2FC in expression of this searched gene in stem-like cells from each diseased tissue sample relative to stem-like cells in normal samples in each tissue plotted against the malignancy continuum. Samples are colored based on if they are from different disease stage. |
Top |
Malignant transformation related pathway analysis |
| Find out the enriched GO biological processes and KEGG pathways involved in transition from healthy to precancer to cancer |
| Tissue | Disease Stage | Enriched GO biological Processes |
| Colorectum | AD |  |
| Colorectum | SER |  |
| Colorectum | MSS |  |
| Colorectum | MSI-H |  |
| Colorectum | FAP |  |
| ∗Top 15 enriched GO BP terms are showed in the bar plot of each disease state in each tissue. Each row represents a significant GO biological process which is colored according to the -log10(p.adjust). |
| Page: 1 2 3 4 5 6 7 8 9 |
| GO ID | Tissue | Disease Stage | Description | Gene Ratio | Bg Ratio | pvalue | p.adjust | Count |
| GO:004654612 | Thyroid | PTC | development of primary male sexual characteristics | 60/5968 | 142/18723 | 5.79e-03 | 2.61e-02 | 60 |
| GO:004654621 | Thyroid | ATC | development of primary male sexual characteristics | 72/6293 | 142/18723 | 1.85e-05 | 1.69e-04 | 72 |
| GO:004666112 | Thyroid | ATC | male sex differentiation | 77/6293 | 165/18723 | 3.27e-04 | 2.04e-03 | 77 |
| GO:00451374 | Thyroid | ATC | development of primary sexual characteristics | 97/6293 | 227/18723 | 2.47e-03 | 1.14e-02 | 97 |
| GO:00466603 | Thyroid | ATC | female sex differentiation | 51/6293 | 114/18723 | 8.62e-03 | 3.28e-02 | 51 |
| Page: 1 |
| Pathway ID | Tissue | Disease Stage | Description | Gene Ratio | Bg Ratio | pvalue | p.adjust | qvalue | Count |
| Page: 1 |
Top |
Cell-cell communication analysis |
| Identification of potential cell-cell interactions between two cell types and their ligand-receptor pairs for different disease states |
| Ligand | Receptor | LRpair | Pathway | Tissue | Disease Stage |
| Page: 1 |
Top |
Single-cell gene regulatory network inference analysis |
| Find out the significant the regulons (TFs) and the target genes of each regulon across cell types for different disease states |
| TF | Cell Type | Tissue | Disease Stage | Target Gene | RSS | Regulon Activity |
| ∗The dot plots of a searched regulon are shown for all cell subpopulations in each disease state of each tissue based on the regulon specific score inferred using pySCENIC and by calculating the average expression. |
| Page: 1 |
Top |
Somatic mutation of malignant transformation related genes |
| Annotation of somatic variants for genes involved in malignant transformation |
| Hugo Symbol | Variant Class | Variant Classification | dbSNP RS | HGVSc | HGVSp | HGVSp Short | SWISSPROT | BIOTYPE | SIFT | PolyPhen | Tumor Sample Barcode | Tissue | Histology | Sex | Age | Stage | Therapy Types | Drugs | Outcome |
| LHFPL2 | insertion | Frame_Shift_Ins | novel | c.12_13insTTACGTGG | p.Ile5LeufsTer15 | p.I5Lfs*15 | Q6ZUX7 | protein_coding | TCGA-A7-A0CE-01 | Breast | breast invasive carcinoma | Female | <65 | I/II | Chemotherapy | adriamycin | SD | ||
| LHFPL2 | insertion | Frame_Shift_Ins | novel | c.10_11insACAGGCTTGTTCTCTGG | p.Val4AspfsTer19 | p.V4Dfs*19 | Q6ZUX7 | protein_coding | TCGA-A7-A0CE-01 | Breast | breast invasive carcinoma | Female | <65 | I/II | Chemotherapy | adriamycin | SD | ||
| LHFPL2 | insertion | In_Frame_Ins | novel | c.192_193insTCCCTGAGGAATTATGGAGAGCGTGAG | p.Tyr64_Ala65insSerLeuArgAsnTyrGlyGluArgGlu | p.Y64_A65insSLRNYGERE | Q6ZUX7 | protein_coding | TCGA-A8-A08H-01 | Breast | breast invasive carcinoma | Female | >=65 | I/II | Unknown | Unknown | SD | ||
| LHFPL2 | insertion | Frame_Shift_Ins | novel | c.190_191insCCACTTCAGTGCA | p.Tyr64SerfsTer152 | p.Y64Sfs*152 | Q6ZUX7 | protein_coding | TCGA-A8-A08H-01 | Breast | breast invasive carcinoma | Female | >=65 | I/II | Unknown | Unknown | SD | ||
| LHFPL2 | SNV | Missense_Mutation | novel | c.196C>T | p.Arg66Cys | p.R66C | Q6ZUX7 | protein_coding | deleterious(0) | probably_damaging(0.95) | TCGA-AA-3845-01 | Colorectum | colon adenocarcinoma | Female | >=65 | I/II | Unknown | Unknown | PD |
| LHFPL2 | SNV | Missense_Mutation | c.623N>G | p.Ala208Gly | p.A208G | Q6ZUX7 | protein_coding | deleterious(0.03) | probably_damaging(0.991) | TCGA-AA-A00N-01 | Colorectum | colon adenocarcinoma | Male | >=65 | I/II | Unknown | Unknown | PD | |
| LHFPL2 | SNV | Missense_Mutation | c.497N>G | p.Tyr166Cys | p.Y166C | Q6ZUX7 | protein_coding | tolerated(0.05) | possibly_damaging(0.853) | TCGA-DM-A1HB-01 | Colorectum | colon adenocarcinoma | Male | >=65 | III/IV | Unknown | Unknown | SD | |
| LHFPL2 | SNV | Missense_Mutation | c.91N>A | p.Ala31Thr | p.A31T | Q6ZUX7 | protein_coding | tolerated(0.08) | benign(0.031) | TCGA-G4-6588-01 | Colorectum | colon adenocarcinoma | Female | <65 | I/II | Unknown | Unknown | SD | |
| LHFPL2 | SNV | Missense_Mutation | novel | c.283G>A | p.Gly95Ser | p.G95S | Q6ZUX7 | protein_coding | tolerated(0.15) | benign(0.234) | TCGA-DF-A2KU-01 | Endometrium | uterine corpus endometrioid carcinoma | Female | Unknown | I/II | Unknown | Unknown | SD |
| LHFPL2 | SNV | Missense_Mutation | novel | c.453N>C | p.Leu151Phe | p.L151F | Q6ZUX7 | protein_coding | deleterious(0.01) | probably_damaging(0.999) | TCGA-EY-A1GV-01 | Endometrium | uterine corpus endometrioid carcinoma | Female | >=65 | III/IV | Chemotherapy | carboplatin | SD |
| Page: 1 2 |
Top |
Related drugs of malignant transformation related genes |
| Identification of chemicals and drugs interact with genes involved in malignant transfromation |
| (DGIdb 4.0) |
| Entrez ID | Symbol | Category | Interaction Types | Drug Claim Name | Drug Name | PMIDs |
| Page: 1 |

Copyright 2023-Present -The University of Texas Health Science Center at Houston |