
|
|||||
|
 | |
| |
| |
| |
| |
| |
|
Gene: LHFP |
Gene summary for LHFP |
| Gene information | Species | Human | Gene symbol | LHFP | Gene ID | 10186 |
| Gene name | LHFPL tetraspan subfamily member 6 | |
| Gene Alias | LHFP | |
| Cytomap | 13q13.3-q14.11 | |
| Gene Type | protein-coding | GO ID | GO:0005575 | UniProtAcc | A0A024RDR1 |
Top |
Malignant transformation analysis |
| Identification of the aberrant gene expression in precancerous and cancerous lesions by comparing the gene expression of stem-like cells in diseased tissues with normal stem cells |
| Entrez ID | Symbol | Replicates | Species | Organ | Tissue | Adj P-value | Log2FC | Malignancy |
| 10186 | LHFP | HTA11_99999970781_79442 | Human | Colorectum | MSS | 3.52e-13 | 2.57e-01 | 0.294 |
| 10186 | LHFP | HTA11_99999965062_69753 | Human | Colorectum | MSI-H | 1.89e-11 | 1.14e+00 | 0.3487 |
| 10186 | LHFP | HTA11_99999965104_69814 | Human | Colorectum | MSS | 7.91e-05 | 2.35e-01 | 0.281 |
| 10186 | LHFP | HTA11_99999971662_82457 | Human | Colorectum | MSS | 3.80e-25 | 5.87e-01 | 0.3859 |
| 10186 | LHFP | HTA11_99999973899_84307 | Human | Colorectum | MSS | 5.98e-12 | 3.99e-01 | 0.2585 |
| 10186 | LHFP | HTA11_99999974143_84620 | Human | Colorectum | MSS | 4.51e-40 | 7.87e-01 | 0.3005 |
| 10186 | LHFP | P2T-E | Human | Esophagus | ESCC | 9.37e-05 | 8.41e-02 | 0.1177 |
| 10186 | LHFP | P4T-E | Human | Esophagus | ESCC | 8.41e-03 | 3.15e-01 | 0.1323 |
| 10186 | LHFP | P5T-E | Human | Esophagus | ESCC | 3.87e-10 | 4.23e-01 | 0.1327 |
| 10186 | LHFP | P8T-E | Human | Esophagus | ESCC | 3.10e-08 | 4.39e-01 | 0.0889 |
| 10186 | LHFP | P9T-E | Human | Esophagus | ESCC | 5.81e-08 | 5.01e-01 | 0.1131 |
| 10186 | LHFP | P10T-E | Human | Esophagus | ESCC | 1.12e-14 | 3.03e-01 | 0.116 |
| 10186 | LHFP | P11T-E | Human | Esophagus | ESCC | 2.35e-07 | 4.35e-01 | 0.1426 |
| 10186 | LHFP | P16T-E | Human | Esophagus | ESCC | 3.89e-12 | 2.28e-01 | 0.1153 |
| 10186 | LHFP | P19T-E | Human | Esophagus | ESCC | 1.55e-03 | 4.32e-01 | 0.1662 |
| 10186 | LHFP | P21T-E | Human | Esophagus | ESCC | 2.02e-06 | 2.73e-01 | 0.1617 |
| 10186 | LHFP | P23T-E | Human | Esophagus | ESCC | 5.14e-04 | 6.78e-01 | 0.108 |
| 10186 | LHFP | P26T-E | Human | Esophagus | ESCC | 1.47e-15 | 3.69e-01 | 0.1276 |
| 10186 | LHFP | P32T-E | Human | Esophagus | ESCC | 1.82e-12 | 3.41e-01 | 0.1666 |
| 10186 | LHFP | P37T-E | Human | Esophagus | ESCC | 4.75e-10 | 3.86e-01 | 0.1371 |
| Page: 1 2 3 |
| Tissue | Expression Dynamics | Abbreviation |
| Colorectum (GSE201348) |  | FAP: Familial adenomatous polyposis |
| CRC: Colorectal cancer | ||
| Colorectum (HTA11) | 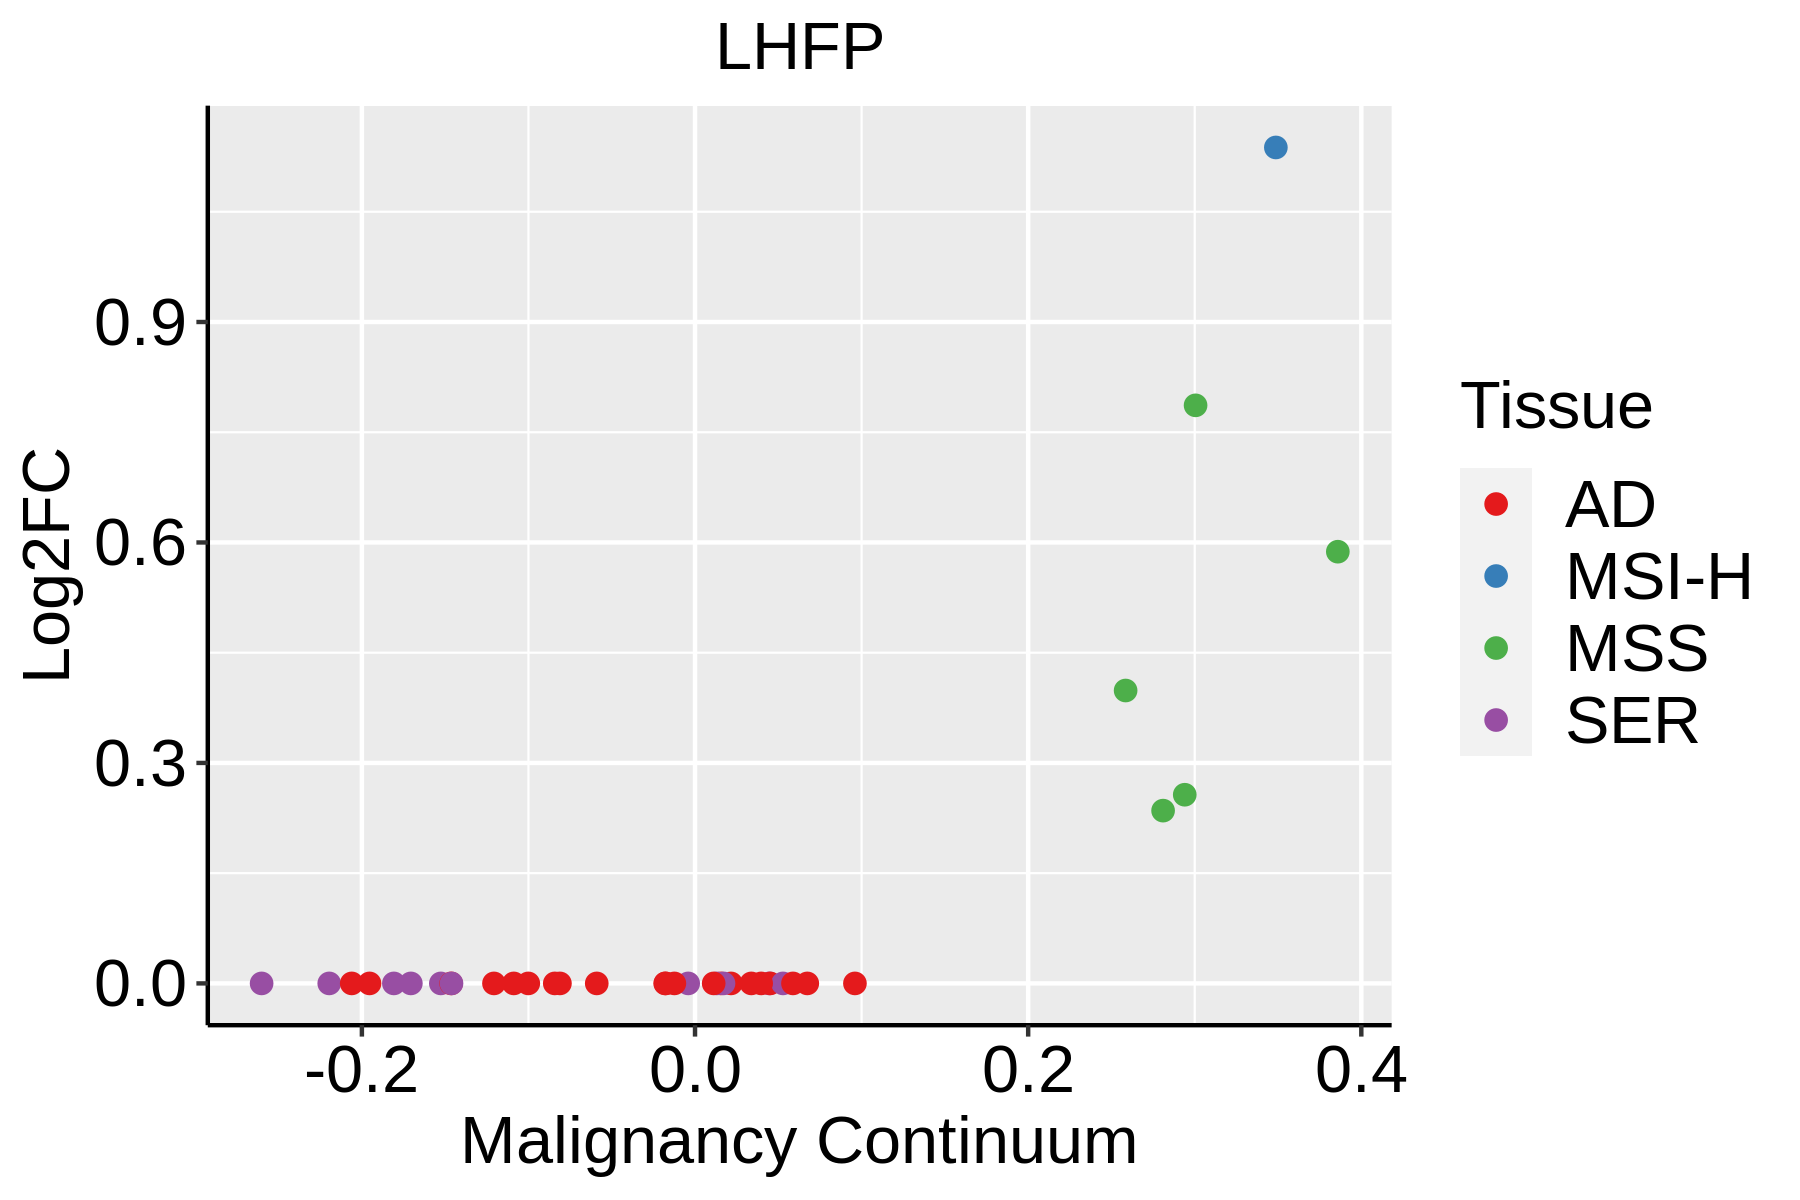 | AD: Adenomas |
| SER: Sessile serrated lesions | ||
| MSI-H: Microsatellite-high colorectal cancer | ||
| MSS: Microsatellite stable colorectal cancer | ||
| Esophagus | 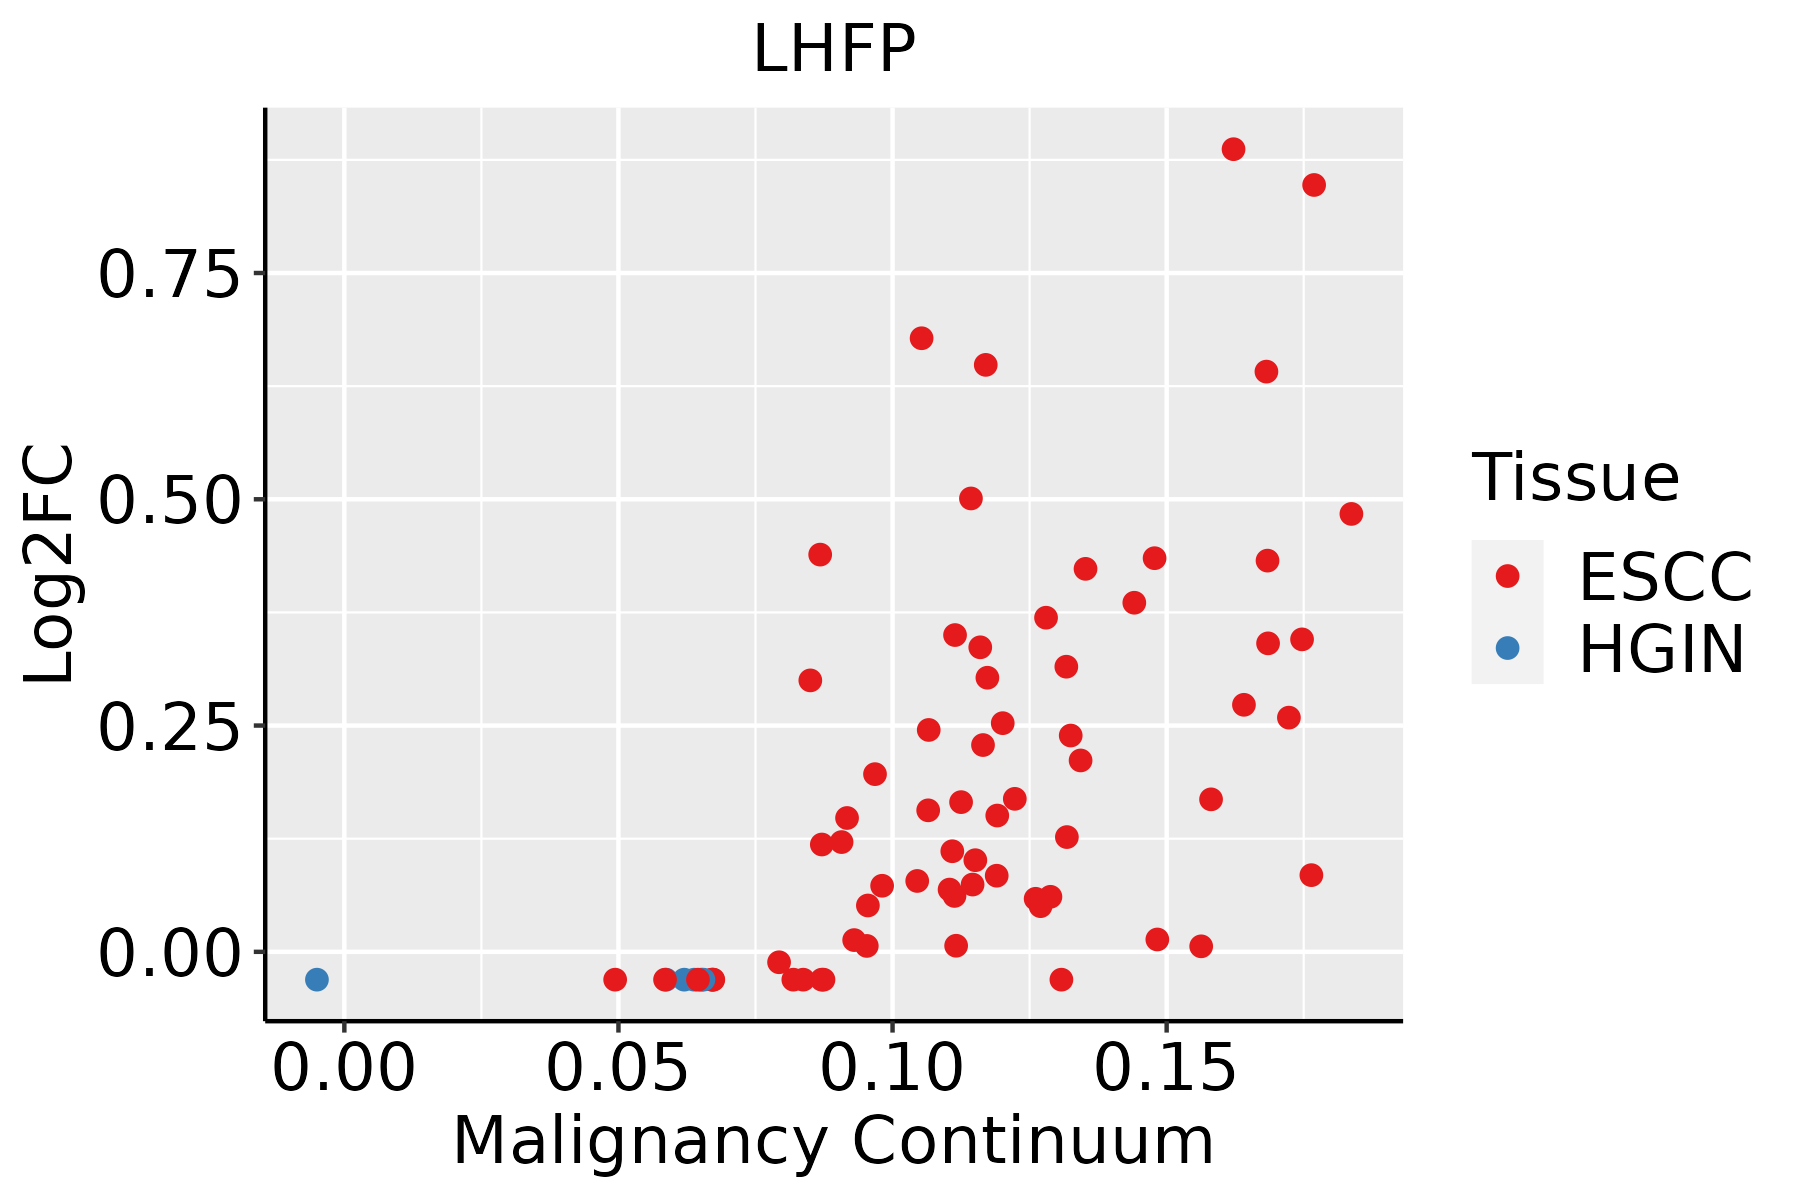 | ESCC: Esophageal squamous cell carcinoma |
| HGIN: High-grade intraepithelial neoplasias | ||
| LGIN: Low-grade intraepithelial neoplasias | ||
| Liver | 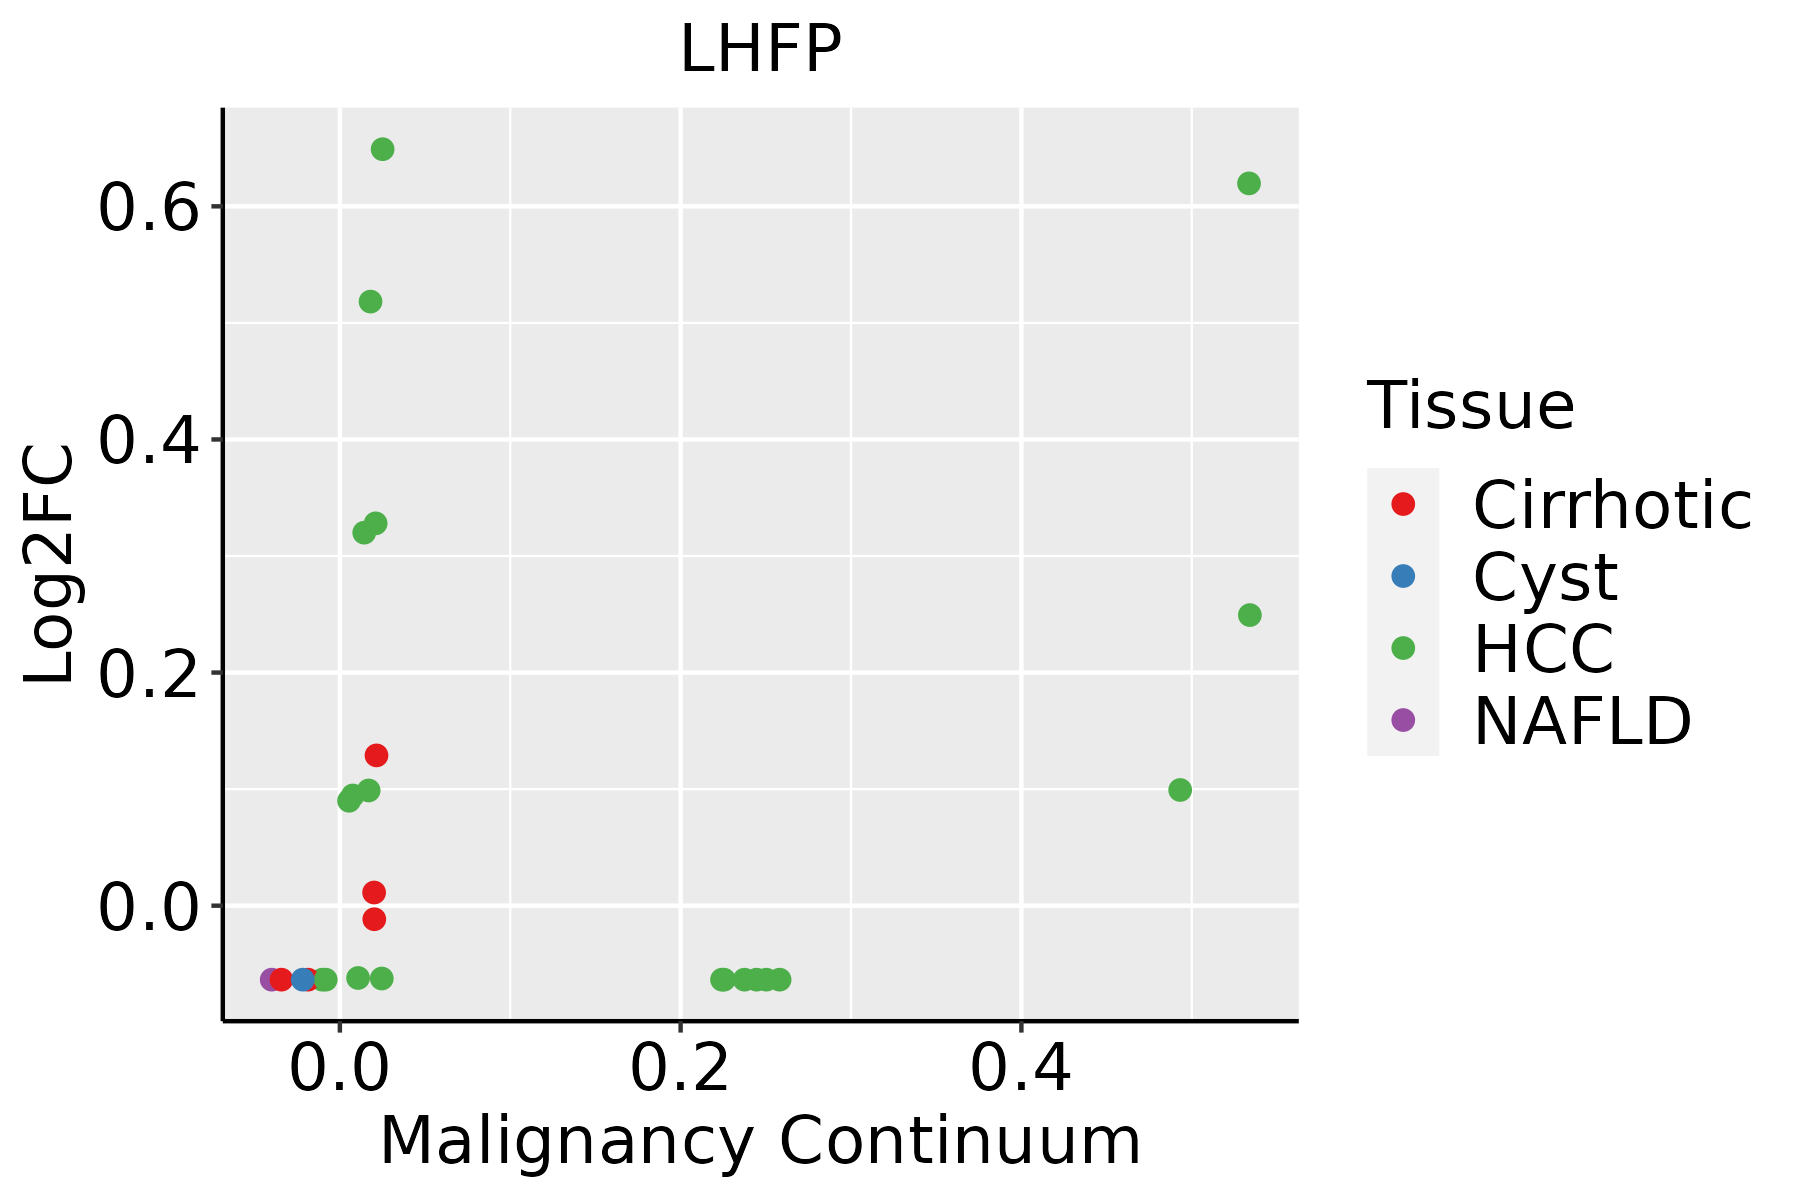 | HCC: Hepatocellular carcinoma |
| NAFLD: Non-alcoholic fatty liver disease | ||
| Oral Cavity |  | EOLP: Erosive Oral lichen planus |
| LP: leukoplakia | ||
| NEOLP: Non-erosive oral lichen planus | ||
| OSCC: Oral squamous cell carcinoma |
| ∗log2FC in expression of this searched gene in stem-like cells from each diseased tissue sample relative to stem-like cells in normal samples in each tissue plotted against the malignancy continuum. Samples are colored based on if they are from different disease stage. |
Top |
Malignant transformation related pathway analysis |
| Find out the enriched GO biological processes and KEGG pathways involved in transition from healthy to precancer to cancer |
| Tissue | Disease Stage | Enriched GO biological Processes |
| Colorectum | AD |  |
| Colorectum | SER |  |
| Colorectum | MSS |  |
| Colorectum | MSI-H |  |
| Colorectum | FAP |  |
| ∗Top 15 enriched GO BP terms are showed in the bar plot of each disease state in each tissue. Each row represents a significant GO biological process which is colored according to the -log10(p.adjust). |
| Page: 1 2 3 4 5 6 7 8 9 |
| GO ID | Tissue | Disease Stage | Description | Gene Ratio | Bg Ratio | pvalue | p.adjust | Count |
| GO:0002064 | Colorectum | AD | epithelial cell development | 89/3918 | 220/18723 | 2.98e-11 | 3.52e-09 | 89 |
| GO:0035315 | Colorectum | AD | hair cell differentiation | 21/3918 | 47/18723 | 2.14e-04 | 2.82e-03 | 21 |
| GO:0060117 | Colorectum | AD | auditory receptor cell development | 12/3918 | 21/18723 | 3.02e-04 | 3.62e-03 | 12 |
| GO:0042491 | Colorectum | AD | inner ear auditory receptor cell differentiation | 17/3918 | 38/18723 | 8.26e-04 | 8.13e-03 | 17 |
| GO:0060088 | Colorectum | AD | auditory receptor cell stereocilium organization | 8/3918 | 14/18723 | 3.23e-03 | 2.38e-02 | 8 |
| GO:0042490 | Colorectum | AD | mechanoreceptor differentiation | 24/3918 | 67/18723 | 3.48e-03 | 2.52e-02 | 24 |
| GO:0048568 | Colorectum | AD | embryonic organ development | 112/3918 | 427/18723 | 4.60e-03 | 3.14e-02 | 112 |
| GO:0009913 | Colorectum | AD | epidermal cell differentiation | 58/3918 | 202/18723 | 5.16e-03 | 3.42e-02 | 58 |
| GO:0008544 | Colorectum | AD | epidermis development | 87/3918 | 324/18723 | 5.99e-03 | 3.76e-02 | 87 |
| GO:0060119 | Colorectum | AD | inner ear receptor cell development | 17/3918 | 45/18723 | 7.10e-03 | 4.33e-02 | 17 |
| GO:00020641 | Colorectum | SER | epithelial cell development | 64/2897 | 220/18723 | 1.96e-07 | 1.10e-05 | 64 |
| GO:00601171 | Colorectum | SER | auditory receptor cell development | 9/2897 | 21/18723 | 2.50e-03 | 2.33e-02 | 9 |
| GO:00600881 | Colorectum | SER | auditory receptor cell stereocilium organization | 7/2897 | 14/18723 | 2.64e-03 | 2.41e-02 | 7 |
| GO:00353151 | Colorectum | SER | hair cell differentiation | 15/2897 | 47/18723 | 3.68e-03 | 3.07e-02 | 15 |
| GO:0002093 | Colorectum | SER | auditory receptor cell morphogenesis | 7/2897 | 16/18723 | 6.63e-03 | 4.69e-02 | 7 |
| GO:00020642 | Colorectum | MSS | epithelial cell development | 81/3467 | 220/18723 | 1.02e-10 | 1.06e-08 | 81 |
| GO:00601172 | Colorectum | MSS | auditory receptor cell development | 12/3467 | 21/18723 | 8.83e-05 | 1.41e-03 | 12 |
| GO:00353152 | Colorectum | MSS | hair cell differentiation | 19/3467 | 47/18723 | 3.88e-04 | 4.86e-03 | 19 |
| GO:00424911 | Colorectum | MSS | inner ear auditory receptor cell differentiation | 16/3467 | 38/18723 | 6.47e-04 | 7.06e-03 | 16 |
| GO:00600882 | Colorectum | MSS | auditory receptor cell stereocilium organization | 8/3467 | 14/18723 | 1.42e-03 | 1.32e-02 | 8 |
| Page: 1 2 |
| Pathway ID | Tissue | Disease Stage | Description | Gene Ratio | Bg Ratio | pvalue | p.adjust | qvalue | Count |
| Page: 1 |
Top |
Cell-cell communication analysis |
| Identification of potential cell-cell interactions between two cell types and their ligand-receptor pairs for different disease states |
| Ligand | Receptor | LRpair | Pathway | Tissue | Disease Stage |
| Page: 1 |
Top |
Single-cell gene regulatory network inference analysis |
| Find out the significant the regulons (TFs) and the target genes of each regulon across cell types for different disease states |
| TF | Cell Type | Tissue | Disease Stage | Target Gene | RSS | Regulon Activity |
| ∗The dot plots of a searched regulon are shown for all cell subpopulations in each disease state of each tissue based on the regulon specific score inferred using pySCENIC and by calculating the average expression. |
| Page: 1 |
Top |
Somatic mutation of malignant transformation related genes |
| Annotation of somatic variants for genes involved in malignant transformation |
| Hugo Symbol | Variant Class | Variant Classification | dbSNP RS | HGVSc | HGVSp | HGVSp Short | SWISSPROT | BIOTYPE | SIFT | PolyPhen | Tumor Sample Barcode | Tissue | Histology | Sex | Age | Stage | Therapy Types | Drugs | Outcome |
| LHFP | insertion | In_Frame_Ins | novel | c.76_77insTCTTTATTATTCCACTTAAGTGTGATTTTTATCCATTTCACA | p.Gly26delinsValPheIleIleProLeuLysCysAspPheTyrProPheHisArg | p.G26delinsVFIIPLKCDFYPFHR | Q9Y693 | protein_coding | TCGA-A7-A0CJ-01 | Breast | breast invasive carcinoma | Female | <65 | I/II | Chemotherapy | cytoxan | SD | ||
| LHFP | SNV | Missense_Mutation | rs549287054 | c.208N>T | p.Arg70Cys | p.R70C | Q9Y693 | protein_coding | deleterious(0) | probably_damaging(1) | TCGA-5M-AAT6-01 | Colorectum | colon adenocarcinoma | Female | <65 | III/IV | Unknown | Unknown | PD |
| LHFP | SNV | Missense_Mutation | novel | c.598T>C | p.Tyr200His | p.Y200H | Q9Y693 | protein_coding | deleterious_low_confidence(0) | benign(0.078) | TCGA-AA-3666-01 | Colorectum | colon adenocarcinoma | Male | >=65 | III/IV | Unknown | Unknown | PD |
| LHFP | SNV | Missense_Mutation | rs769854247 | c.554N>T | p.Thr185Met | p.T185M | Q9Y693 | protein_coding | tolerated(0.05) | probably_damaging(0.911) | TCGA-AA-3679-01 | Colorectum | colon adenocarcinoma | Male | <65 | III/IV | Chemotherapy | folinic | SD |
| LHFP | SNV | Missense_Mutation | c.397N>A | p.Gly133Ser | p.G133S | Q9Y693 | protein_coding | tolerated(0.73) | benign(0.021) | TCGA-AY-6197-01 | Colorectum | colon adenocarcinoma | Male | <65 | I/II | Unknown | Unknown | SD | |
| LHFP | SNV | Missense_Mutation | c.215C>T | p.Ala72Val | p.A72V | Q9Y693 | protein_coding | deleterious(0) | probably_damaging(0.914) | TCGA-DM-A1D7-01 | Colorectum | colon adenocarcinoma | Male | >=65 | I/II | Unknown | Unknown | PD | |
| LHFP | SNV | Missense_Mutation | rs755812608 | c.518C>T | p.Thr173Met | p.T173M | Q9Y693 | protein_coding | tolerated(0.11) | possibly_damaging(0.897) | TCGA-AG-3592-01 | Colorectum | rectum adenocarcinoma | Male | >=65 | I/II | Unknown | Unknown | SD |
| LHFP | SNV | Missense_Mutation | rs758624379 | c.268N>A | p.Gly90Ser | p.G90S | Q9Y693 | protein_coding | deleterious(0.03) | possibly_damaging(0.838) | TCGA-A5-A0GP-01 | Endometrium | uterine corpus endometrioid carcinoma | Female | <65 | I/II | Unknown | Unknown | SD |
| LHFP | SNV | Missense_Mutation | c.404G>A | p.Gly135Asp | p.G135D | Q9Y693 | protein_coding | deleterious(0.01) | probably_damaging(0.998) | TCGA-AP-A0LT-01 | Endometrium | uterine corpus endometrioid carcinoma | Female | <65 | I/II | Unknown | Unknown | SD | |
| LHFP | SNV | Missense_Mutation | novel | c.59N>T | p.Ala20Val | p.A20V | Q9Y693 | protein_coding | deleterious(0.01) | probably_damaging(0.965) | TCGA-AP-A1DV-01 | Endometrium | uterine corpus endometrioid carcinoma | Female | <65 | I/II | Unknown | Unknown | SD |
| Page: 1 2 3 4 |
Top |
Related drugs of malignant transformation related genes |
| Identification of chemicals and drugs interact with genes involved in malignant transfromation |
| (DGIdb 4.0) |
| Entrez ID | Symbol | Category | Interaction Types | Drug Claim Name | Drug Name | PMIDs |
| Page: 1 |

Copyright 2023-Present -The University of Texas Health Science Center at Houston |