
|
|||||
|
 | |
| |
| |
| |
| |
| |
|
Gene: LGR5 |
Gene summary for LGR5 |
| Gene information | Species | Human | Gene symbol | LGR5 | Gene ID | 8549 |
| Gene name | leucine rich repeat containing G protein-coupled receptor 5 | |
| Gene Alias | FEX | |
| Cytomap | 12q21.1 | |
| Gene Type | protein-coding | GO ID | GO:0000003 | UniProtAcc | O75473 |
Top |
Malignant transformation analysis |
| Identification of the aberrant gene expression in precancerous and cancerous lesions by comparing the gene expression of stem-like cells in diseased tissues with normal stem cells |
| Entrez ID | Symbol | Replicates | Species | Organ | Tissue | Adj P-value | Log2FC | Malignancy |
| 8549 | LGR5 | HTA11_3410_2000001011 | Human | Colorectum | AD | 1.63e-10 | 6.91e-01 | 0.0155 |
| 8549 | LGR5 | HTA11_2951_2000001011 | Human | Colorectum | AD | 2.75e-04 | 9.37e-01 | 0.0216 |
| 8549 | LGR5 | HTA11_347_2000001011 | Human | Colorectum | AD | 6.76e-04 | -2.88e-01 | -0.1954 |
| 8549 | LGR5 | HTA11_866_3004761011 | Human | Colorectum | AD | 1.27e-20 | 9.94e-01 | 0.096 |
| 8549 | LGR5 | HTA11_9408_2000001011 | Human | Colorectum | AD | 2.15e-02 | 8.35e-01 | 0.0451 |
| 8549 | LGR5 | HTA11_7663_2000001011 | Human | Colorectum | SER | 6.38e-03 | 1.11e+00 | 0.0131 |
| 8549 | LGR5 | HTA11_10711_2000001011 | Human | Colorectum | AD | 3.59e-05 | 7.21e-01 | 0.0338 |
| 8549 | LGR5 | HTA11_7696_3000711011 | Human | Colorectum | AD | 1.57e-30 | 1.31e+00 | 0.0674 |
| 8549 | LGR5 | HTA11_6818_2000001011 | Human | Colorectum | AD | 1.46e-06 | 1.13e+00 | 0.0112 |
| 8549 | LGR5 | HTA11_6818_2000001021 | Human | Colorectum | AD | 2.12e-31 | 1.72e+00 | 0.0588 |
| 8549 | LGR5 | HTA11_99999970781_79442 | Human | Colorectum | MSS | 1.20e-26 | 9.92e-01 | 0.294 |
| 8549 | LGR5 | HTA11_99999965062_69753 | Human | Colorectum | MSI-H | 2.86e-08 | 2.39e+00 | 0.3487 |
| 8549 | LGR5 | HTA11_99999965104_69814 | Human | Colorectum | MSS | 2.69e-25 | 1.76e+00 | 0.281 |
| 8549 | LGR5 | HTA11_99999974143_84620 | Human | Colorectum | MSS | 1.84e-02 | 7.11e-02 | 0.3005 |
| 8549 | LGR5 | F007 | Human | Colorectum | FAP | 1.69e-03 | 6.84e-01 | 0.1176 |
| 8549 | LGR5 | A002-C-010 | Human | Colorectum | FAP | 2.25e-24 | 9.24e-01 | 0.242 |
| 8549 | LGR5 | A001-C-207 | Human | Colorectum | FAP | 2.16e-15 | 9.55e-01 | 0.1278 |
| 8549 | LGR5 | A015-C-203 | Human | Colorectum | FAP | 4.13e-09 | 7.02e-01 | -0.1294 |
| 8549 | LGR5 | A002-C-201 | Human | Colorectum | FAP | 8.74e-05 | 6.15e-01 | 0.0324 |
| 8549 | LGR5 | A002-C-203 | Human | Colorectum | FAP | 1.95e-16 | 8.49e-01 | 0.2786 |
| Page: 1 2 3 4 |
| Tissue | Expression Dynamics | Abbreviation |
| Colorectum (GSE201348) |  | FAP: Familial adenomatous polyposis |
| CRC: Colorectal cancer | ||
| Colorectum (HTA11) |  | AD: Adenomas |
| SER: Sessile serrated lesions | ||
| MSI-H: Microsatellite-high colorectal cancer | ||
| MSS: Microsatellite stable colorectal cancer | ||
| Endometrium | 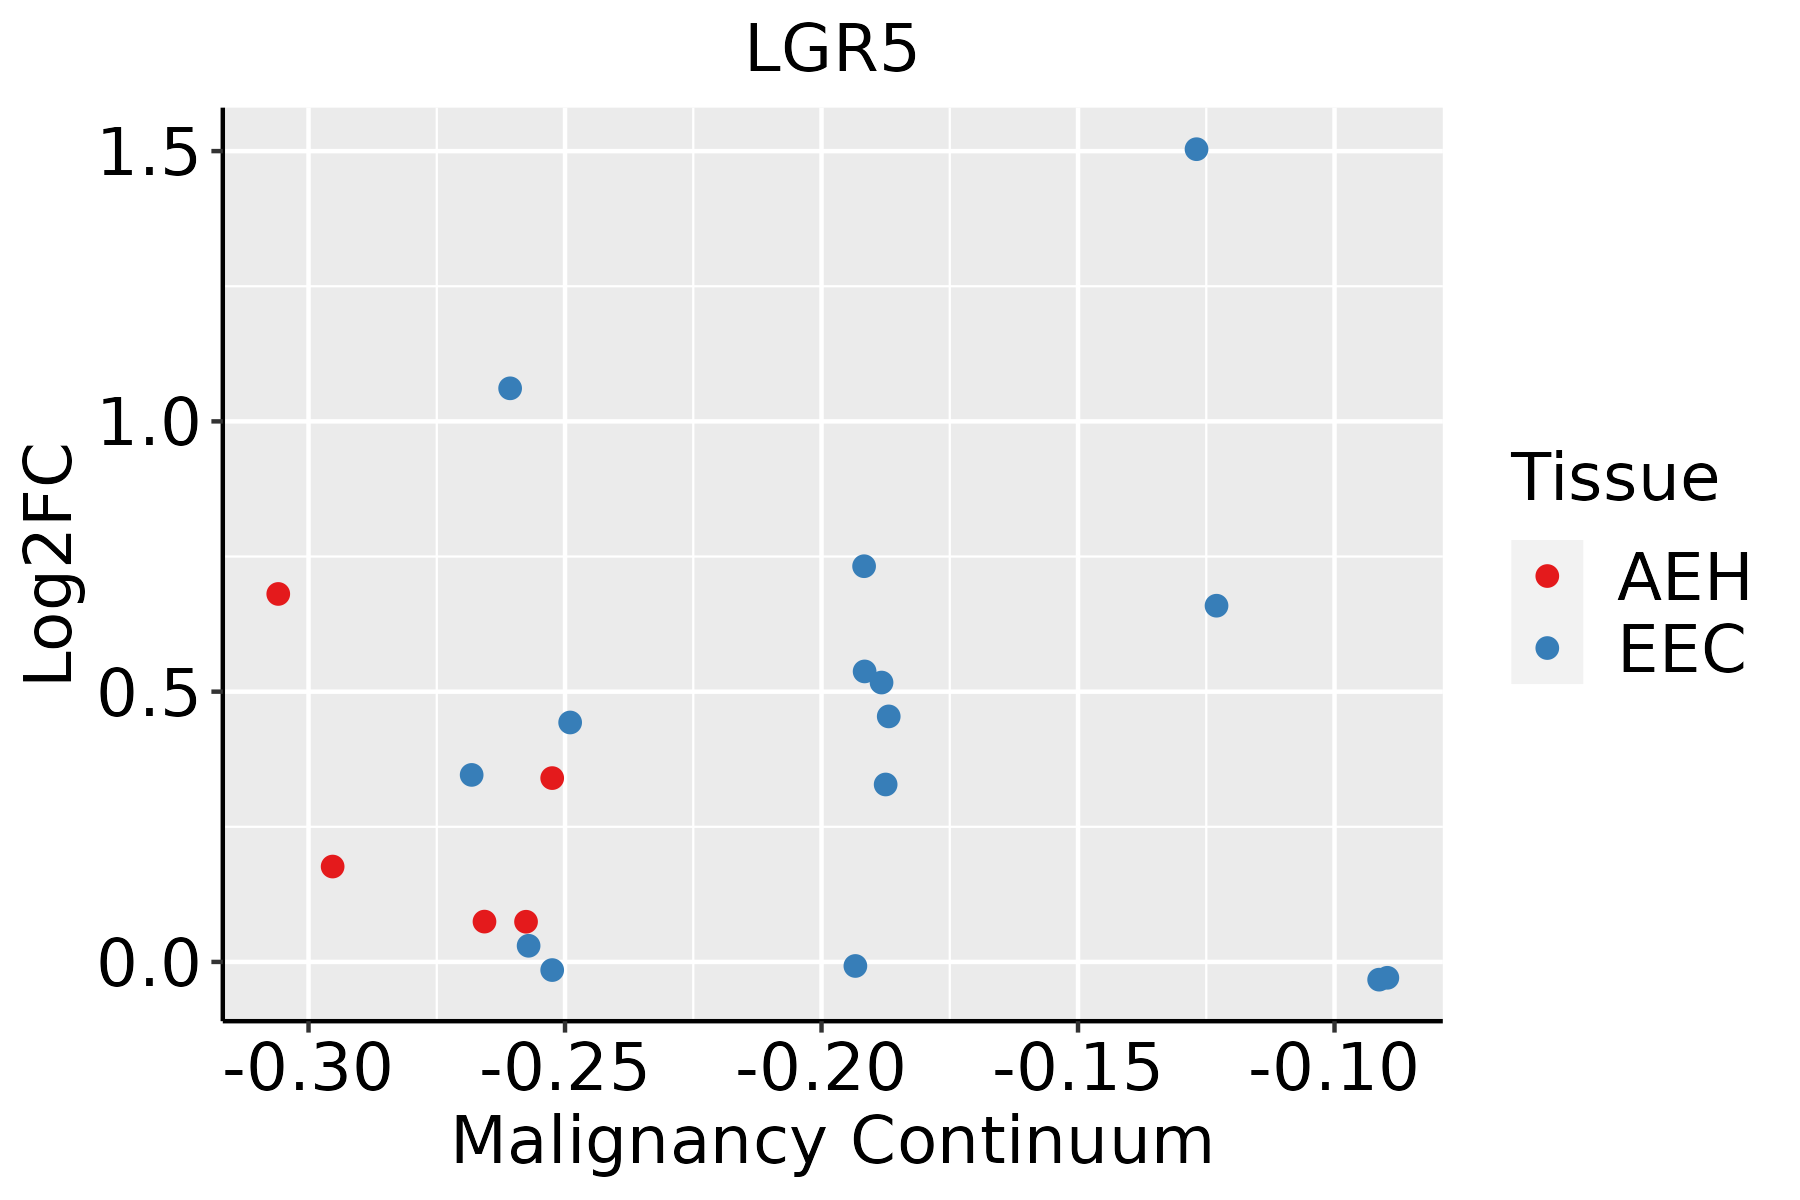 | AEH: Atypical endometrial hyperplasia |
| EEC: Endometrioid Cancer | ||
| Esophagus |  | ESCC: Esophageal squamous cell carcinoma |
| HGIN: High-grade intraepithelial neoplasias | ||
| LGIN: Low-grade intraepithelial neoplasias | ||
| Liver | 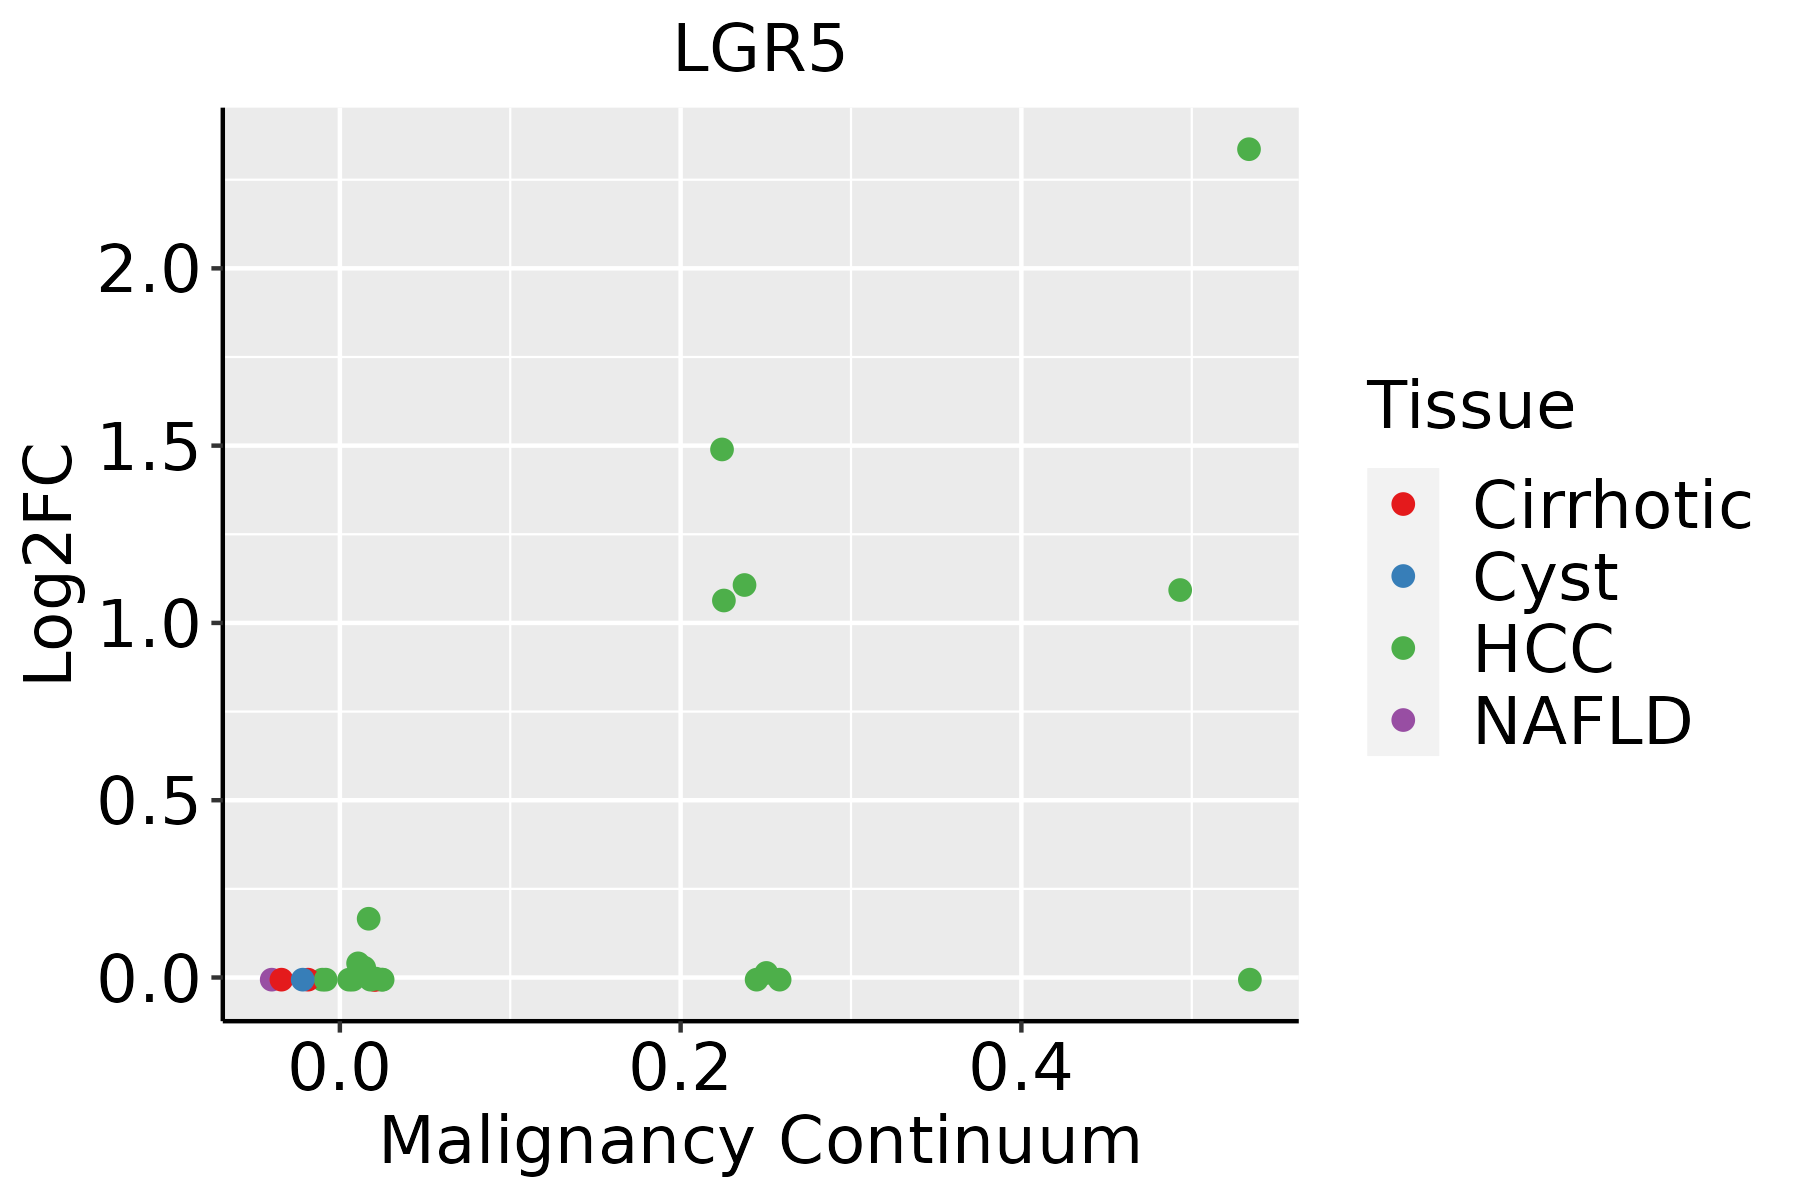 | HCC: Hepatocellular carcinoma |
| NAFLD: Non-alcoholic fatty liver disease | ||
| Thyroid |  | ATC: Anaplastic thyroid cancer |
| HT: Hashimoto's thyroiditis | ||
| PTC: Papillary thyroid cancer |
| ∗log2FC in expression of this searched gene in stem-like cells from each diseased tissue sample relative to stem-like cells in normal samples in each tissue plotted against the malignancy continuum. Samples are colored based on if they are from different disease stage. |
Top |
Malignant transformation related pathway analysis |
| Find out the enriched GO biological processes and KEGG pathways involved in transition from healthy to precancer to cancer |
| Tissue | Disease Stage | Enriched GO biological Processes |
| Colorectum | AD |  |
| Colorectum | SER |  |
| Colorectum | MSS |  |
| Colorectum | MSI-H |  |
| Colorectum | FAP |  |
| ∗Top 15 enriched GO BP terms are showed in the bar plot of each disease state in each tissue. Each row represents a significant GO biological process which is colored according to the -log10(p.adjust). |
| Page: 1 2 3 4 5 6 7 8 9 |
| GO ID | Tissue | Disease Stage | Description | Gene Ratio | Bg Ratio | pvalue | p.adjust | Count |
| GO:0030111 | Colorectum | AD | regulation of Wnt signaling pathway | 102/3918 | 328/18723 | 8.51e-06 | 2.03e-04 | 102 |
| GO:0016055 | Colorectum | AD | Wnt signaling pathway | 130/3918 | 444/18723 | 1.60e-05 | 3.37e-04 | 130 |
| GO:0198738 | Colorectum | AD | cell-cell signaling by wnt | 130/3918 | 446/18723 | 2.02e-05 | 4.10e-04 | 130 |
| GO:0009755 | Colorectum | AD | hormone-mediated signaling pathway | 64/3918 | 190/18723 | 2.78e-05 | 5.24e-04 | 64 |
| GO:0060070 | Colorectum | AD | canonical Wnt signaling pathway | 90/3918 | 303/18723 | 1.76e-04 | 2.38e-03 | 90 |
| GO:0060828 | Colorectum | AD | regulation of canonical Wnt signaling pathway | 77/3918 | 253/18723 | 2.19e-04 | 2.87e-03 | 77 |
| GO:0060562 | Colorectum | AD | epithelial tube morphogenesis | 93/3918 | 325/18723 | 5.65e-04 | 6.00e-03 | 93 |
| GO:0050673 | Colorectum | AD | epithelial cell proliferation | 119/3918 | 437/18723 | 8.75e-04 | 8.51e-03 | 119 |
| GO:0030177 | Colorectum | AD | positive regulation of Wnt signaling pathway | 45/3918 | 140/18723 | 1.23e-03 | 1.09e-02 | 45 |
| GO:0008544 | Colorectum | AD | epidermis development | 87/3918 | 324/18723 | 5.99e-03 | 3.76e-02 | 87 |
| GO:00097551 | Colorectum | SER | hormone-mediated signaling pathway | 49/2897 | 190/18723 | 1.54e-04 | 3.00e-03 | 49 |
| GO:00160551 | Colorectum | SER | Wnt signaling pathway | 97/2897 | 444/18723 | 2.02e-04 | 3.68e-03 | 97 |
| GO:01987381 | Colorectum | SER | cell-cell signaling by wnt | 97/2897 | 446/18723 | 2.39e-04 | 4.11e-03 | 97 |
| GO:00301111 | Colorectum | SER | regulation of Wnt signaling pathway | 75/2897 | 328/18723 | 2.47e-04 | 4.20e-03 | 75 |
| GO:00600701 | Colorectum | SER | canonical Wnt signaling pathway | 66/2897 | 303/18723 | 2.10e-03 | 2.06e-02 | 66 |
| GO:00608281 | Colorectum | SER | regulation of canonical Wnt signaling pathway | 56/2897 | 253/18723 | 3.03e-03 | 2.67e-02 | 56 |
| GO:0090263 | Colorectum | SER | positive regulation of canonical Wnt signaling pathway | 27/2897 | 106/18723 | 5.12e-03 | 3.92e-02 | 27 |
| GO:00301112 | Colorectum | MSS | regulation of Wnt signaling pathway | 98/3467 | 328/18723 | 3.37e-07 | 1.36e-05 | 98 |
| GO:00160552 | Colorectum | MSS | Wnt signaling pathway | 124/3467 | 444/18723 | 6.06e-07 | 2.26e-05 | 124 |
| GO:01987382 | Colorectum | MSS | cell-cell signaling by wnt | 124/3467 | 446/18723 | 7.83e-07 | 2.77e-05 | 124 |
| Page: 1 2 3 4 5 6 7 8 |
| Pathway ID | Tissue | Disease Stage | Description | Gene Ratio | Bg Ratio | pvalue | p.adjust | qvalue | Count |
| hsa04310 | Colorectum | AD | Wnt signaling pathway | 56/2092 | 171/8465 | 1.03e-02 | 3.93e-02 | 2.51e-02 | 56 |
| hsa043101 | Colorectum | AD | Wnt signaling pathway | 56/2092 | 171/8465 | 1.03e-02 | 3.93e-02 | 2.51e-02 | 56 |
| hsa043102 | Colorectum | MSS | Wnt signaling pathway | 53/1875 | 171/8465 | 4.24e-03 | 1.86e-02 | 1.14e-02 | 53 |
| hsa043103 | Colorectum | MSS | Wnt signaling pathway | 53/1875 | 171/8465 | 4.24e-03 | 1.86e-02 | 1.14e-02 | 53 |
| hsa043104 | Colorectum | FAP | Wnt signaling pathway | 46/1404 | 171/8465 | 3.94e-04 | 3.06e-03 | 1.86e-03 | 46 |
| hsa043105 | Colorectum | FAP | Wnt signaling pathway | 46/1404 | 171/8465 | 3.94e-04 | 3.06e-03 | 1.86e-03 | 46 |
| hsa043106 | Colorectum | CRC | Wnt signaling pathway | 40/1091 | 171/8465 | 1.01e-04 | 1.57e-03 | 1.07e-03 | 40 |
| hsa043107 | Colorectum | CRC | Wnt signaling pathway | 40/1091 | 171/8465 | 1.01e-04 | 1.57e-03 | 1.07e-03 | 40 |
| hsa0431010 | Endometrium | AEH | Wnt signaling pathway | 37/1197 | 171/8465 | 4.68e-03 | 2.53e-02 | 1.86e-02 | 37 |
| hsa0431013 | Endometrium | AEH | Wnt signaling pathway | 37/1197 | 171/8465 | 4.68e-03 | 2.53e-02 | 1.86e-02 | 37 |
| hsa0431022 | Endometrium | EEC | Wnt signaling pathway | 40/1237 | 171/8465 | 1.37e-03 | 8.99e-03 | 6.70e-03 | 40 |
| hsa0431032 | Endometrium | EEC | Wnt signaling pathway | 40/1237 | 171/8465 | 1.37e-03 | 8.99e-03 | 6.70e-03 | 40 |
| Page: 1 |
Top |
Cell-cell communication analysis |
| Identification of potential cell-cell interactions between two cell types and their ligand-receptor pairs for different disease states |
| Ligand | Receptor | LRpair | Pathway | Tissue | Disease Stage |
| Page: 1 |
Top |
Single-cell gene regulatory network inference analysis |
| Find out the significant the regulons (TFs) and the target genes of each regulon across cell types for different disease states |
| TF | Cell Type | Tissue | Disease Stage | Target Gene | RSS | Regulon Activity |
| ∗The dot plots of a searched regulon are shown for all cell subpopulations in each disease state of each tissue based on the regulon specific score inferred using pySCENIC and by calculating the average expression. |
| Page: 1 |
Top |
Somatic mutation of malignant transformation related genes |
| Annotation of somatic variants for genes involved in malignant transformation |
| Hugo Symbol | Variant Class | Variant Classification | dbSNP RS | HGVSc | HGVSp | HGVSp Short | SWISSPROT | BIOTYPE | SIFT | PolyPhen | Tumor Sample Barcode | Tissue | Histology | Sex | Age | Stage | Therapy Types | Drugs | Outcome |
| LGR5 | SNV | Missense_Mutation | c.2579N>G | p.Gln860Arg | p.Q860R | O75473 | protein_coding | tolerated(0.1) | benign(0.001) | TCGA-A2-A4RW-01 | Breast | breast invasive carcinoma | Female | <65 | III/IV | Unknown | Unknown | SD | |
| LGR5 | SNV | Missense_Mutation | c.2523N>T | p.Trp841Cys | p.W841C | O75473 | protein_coding | tolerated(0.07) | benign(0.005) | TCGA-A8-A09A-01 | Breast | breast invasive carcinoma | Female | <65 | I/II | Hormone Therapy | tamoxiphen | SD | |
| LGR5 | SNV | Missense_Mutation | novel | c.2662N>A | p.Pro888Thr | p.P888T | O75473 | protein_coding | deleterious(0.01) | benign(0.024) | TCGA-B6-A400-01 | Breast | breast invasive carcinoma | Female | <65 | III/IV | Unknown | Unknown | SD |
| LGR5 | SNV | Missense_Mutation | c.1567N>C | p.Glu523Gln | p.E523Q | O75473 | protein_coding | deleterious(0.04) | possibly_damaging(0.616) | TCGA-BH-A0W7-01 | Breast | breast invasive carcinoma | Female | <65 | I/II | Chemotherapy | taxotere | CR | |
| LGR5 | SNV | Missense_Mutation | rs779176913 | c.185N>G | p.Ser62Cys | p.S62C | O75473 | protein_coding | deleterious(0.02) | possibly_damaging(0.781) | TCGA-BH-A8FZ-01 | Breast | breast invasive carcinoma | Female | <65 | I/II | Unknown | Unknown | SD |
| LGR5 | SNV | Missense_Mutation | novel | c.1115N>C | p.Val372Ala | p.V372A | O75473 | protein_coding | tolerated(0.44) | benign(0.001) | TCGA-GI-A2C9-01 | Breast | breast invasive carcinoma | Female | <65 | I/II | Unspecific | SD | |
| LGR5 | insertion | Frame_Shift_Ins | novel | c.1196_1197insAAAGTTGAGAAACATAGATAATATTATTTTTT | p.Ser399ArgfsTer16 | p.S399Rfs*16 | O75473 | protein_coding | TCGA-A8-A08H-01 | Breast | breast invasive carcinoma | Female | >=65 | I/II | Unknown | Unknown | SD | ||
| LGR5 | insertion | In_Frame_Ins | novel | c.279_280insTTCTGCTTAAAGTGGCTTGTTGTTTCCTGTGCCAGGAACTACTGT | p.Glu93_Glu94insPheCysLeuLysTrpLeuValValSerCysAlaArgAsnTyrCys | p.E93_E94insFCLKWLVVSCARNYC | O75473 | protein_coding | TCGA-B6-A0IA-01 | Breast | breast invasive carcinoma | Female | <65 | I/II | Unknown | Unknown | SD | ||
| LGR5 | deletion | Frame_Shift_Del | novel | c.82delN | p.Gly28ValfsTer4 | p.G28Vfs*4 | O75473 | protein_coding | TCGA-D8-A27V-01 | Breast | breast invasive carcinoma | Female | <65 | I/II | Hormone Therapy | tamoxiphen | SD | ||
| LGR5 | SNV | Missense_Mutation | c.1360C>G | p.His454Asp | p.H454D | O75473 | protein_coding | tolerated(0.23) | benign(0.028) | TCGA-DG-A2KK-01 | Cervix | cervical & endocervical cancer | Female | <65 | III/IV | Chemotherapy | cisplatin | SD |
| Page: 1 2 3 4 5 6 7 8 9 10 11 |
Top |
Related drugs of malignant transformation related genes |
| Identification of chemicals and drugs interact with genes involved in malignant transfromation |
| (DGIdb 4.0) |
| Entrez ID | Symbol | Category | Interaction Types | Drug Claim Name | Drug Name | PMIDs |
| 8549 | LGR5 | G PROTEIN COUPLED RECEPTOR, CLINICALLY ACTIONABLE, DRUGGABLE GENOME | fluorouracil | FLUOROURACIL | 25665511 | |
| 8549 | LGR5 | G PROTEIN COUPLED RECEPTOR, CLINICALLY ACTIONABLE, DRUGGABLE GENOME | agonist | 178100588 | ||
| 8549 | LGR5 | G PROTEIN COUPLED RECEPTOR, CLINICALLY ACTIONABLE, DRUGGABLE GENOME | agonist | 178100587 | ||
| 8549 | LGR5 | G PROTEIN COUPLED RECEPTOR, CLINICALLY ACTIONABLE, DRUGGABLE GENOME | agonist | 178100586 | ||
| 8549 | LGR5 | G PROTEIN COUPLED RECEPTOR, CLINICALLY ACTIONABLE, DRUGGABLE GENOME | agonist | 178100589 |
| Page: 1 |

Copyright 2023-Present -The University of Texas Health Science Center at Houston |