
|
|||||
|
 | |
| |
| |
| |
| |
| |
|
Gene: LGI4 |
Gene summary for LGI4 |
| Gene information | Species | Human | Gene symbol | LGI4 | Gene ID | 163175 |
| Gene name | leucine rich repeat LGI family member 4 | |
| Gene Alias | AMC1 | |
| Cytomap | 19q13.12 | |
| Gene Type | protein-coding | GO ID | GO:0007272 | UniProtAcc | A5D6Y5 |
Top |
Malignant transformation analysis |
| Identification of the aberrant gene expression in precancerous and cancerous lesions by comparing the gene expression of stem-like cells in diseased tissues with normal stem cells |
| Entrez ID | Symbol | Replicates | Species | Organ | Tissue | Adj P-value | Log2FC | Malignancy |
| 163175 | LGI4 | P11T-E | Human | Esophagus | ESCC | 5.36e-11 | 7.03e-01 | 0.1426 |
| 163175 | LGI4 | P19T-E | Human | Esophagus | ESCC | 3.53e-06 | 1.04e+00 | 0.1662 |
| 163175 | LGI4 | P130T-E | Human | Esophagus | ESCC | 1.23e-20 | 4.17e-01 | 0.1676 |
| Page: 1 |
| Tissue | Expression Dynamics | Abbreviation |
| Esophagus | 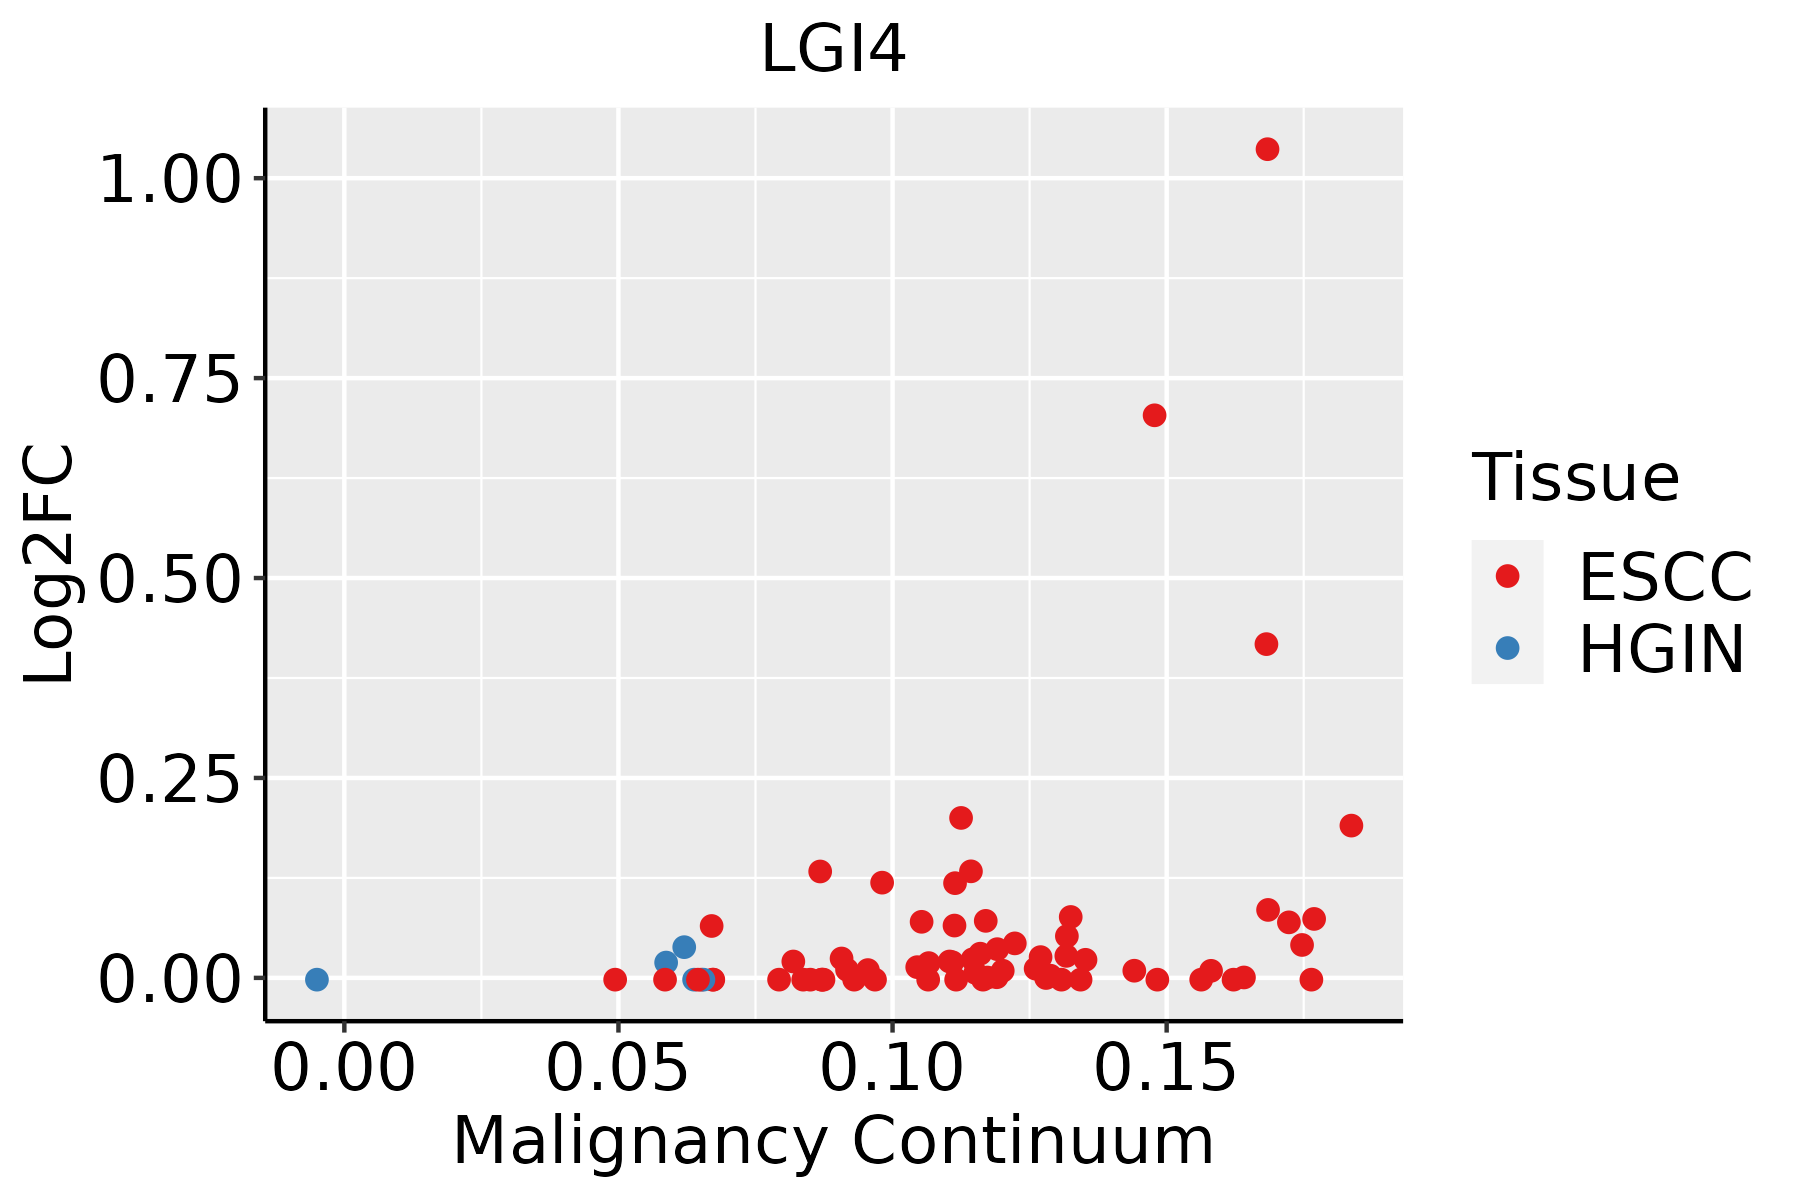 | ESCC: Esophageal squamous cell carcinoma |
| HGIN: High-grade intraepithelial neoplasias | ||
| LGIN: Low-grade intraepithelial neoplasias |
| ∗log2FC in expression of this searched gene in stem-like cells from each diseased tissue sample relative to stem-like cells in normal samples in each tissue plotted against the malignancy continuum. Samples are colored based on if they are from different disease stage. |
Top |
Malignant transformation related pathway analysis |
| Find out the enriched GO biological processes and KEGG pathways involved in transition from healthy to precancer to cancer |
| Tissue | Disease Stage | Enriched GO biological Processes |
| Colorectum | AD |  |
| Colorectum | SER |  |
| Colorectum | MSS |  |
| Colorectum | MSI-H |  |
| Colorectum | FAP |  |
| ∗Top 15 enriched GO BP terms are showed in the bar plot of each disease state in each tissue. Each row represents a significant GO biological process which is colored according to the -log10(p.adjust). |
| Page: 1 2 3 4 5 6 7 8 9 |
| GO ID | Tissue | Disease Stage | Description | Gene Ratio | Bg Ratio | pvalue | p.adjust | Count |
| GO:00425524 | Esophagus | ESCC | myelination | 85/8552 | 134/18723 | 2.51e-05 | 2.13e-04 | 85 |
| GO:00072724 | Esophagus | ESCC | ensheathment of neurons | 86/8552 | 136/18723 | 2.68e-05 | 2.24e-04 | 86 |
| GO:00083664 | Esophagus | ESCC | axon ensheathment | 86/8552 | 136/18723 | 2.68e-05 | 2.24e-04 | 86 |
| GO:00420636 | Esophagus | ESCC | gliogenesis | 172/8552 | 301/18723 | 3.75e-05 | 3.04e-04 | 172 |
| GO:00140091 | Esophagus | ESCC | glial cell proliferation | 37/8552 | 51/18723 | 9.01e-05 | 6.50e-04 | 37 |
| GO:00100016 | Esophagus | ESCC | glial cell differentiation | 129/8552 | 225/18723 | 2.73e-04 | 1.65e-03 | 129 |
| GO:00519606 | Esophagus | ESCC | regulation of nervous system development | 237/8552 | 443/18723 | 5.02e-04 | 2.78e-03 | 237 |
| GO:00140373 | Esophagus | ESCC | Schwann cell differentiation | 28/8552 | 40/18723 | 1.61e-03 | 7.50e-03 | 28 |
| GO:0031641 | Esophagus | ESCC | regulation of myelination | 31/8552 | 47/18723 | 4.01e-03 | 1.62e-02 | 31 |
| Page: 1 |
| Pathway ID | Tissue | Disease Stage | Description | Gene Ratio | Bg Ratio | pvalue | p.adjust | qvalue | Count |
| Page: 1 |
Top |
Cell-cell communication analysis |
| Identification of potential cell-cell interactions between two cell types and their ligand-receptor pairs for different disease states |
| Ligand | Receptor | LRpair | Pathway | Tissue | Disease Stage |
| Page: 1 |
Top |
Single-cell gene regulatory network inference analysis |
| Find out the significant the regulons (TFs) and the target genes of each regulon across cell types for different disease states |
| TF | Cell Type | Tissue | Disease Stage | Target Gene | RSS | Regulon Activity |
| ∗The dot plots of a searched regulon are shown for all cell subpopulations in each disease state of each tissue based on the regulon specific score inferred using pySCENIC and by calculating the average expression. |
| Page: 1 |
Top |
Somatic mutation of malignant transformation related genes |
| Annotation of somatic variants for genes involved in malignant transformation |
| Hugo Symbol | Variant Class | Variant Classification | dbSNP RS | HGVSc | HGVSp | HGVSp Short | SWISSPROT | BIOTYPE | SIFT | PolyPhen | Tumor Sample Barcode | Tissue | Histology | Sex | Age | Stage | Therapy Types | Drugs | Outcome |
| LGI4 | SNV | Missense_Mutation | novel | c.173N>T | p.Ser58Leu | p.S58L | Q8N135 | protein_coding | deleterious(0.02) | possibly_damaging(0.895) | TCGA-AN-A0XU-01 | Breast | breast invasive carcinoma | Female | <65 | I/II | Unknown | Unknown | SD |
| LGI4 | SNV | Missense_Mutation | novel | c.1463N>A | p.Leu488Gln | p.L488Q | Q8N135 | protein_coding | deleterious(0) | benign(0.206) | TCGA-DS-A1OC-01 | Cervix | cervical & endocervical cancer | Female | <65 | I/II | Chemotherapy | gemcitabine | SD |
| LGI4 | SNV | Missense_Mutation | rs762678784 | c.112G>A | p.Ala38Thr | p.A38T | Q8N135 | protein_coding | deleterious(0.04) | benign(0.013) | TCGA-EA-A3HU-01 | Cervix | cervical & endocervical cancer | Female | <65 | I/II | Unknown | Unknown | SD |
| LGI4 | SNV | Missense_Mutation | c.606N>C | p.Lys202Asn | p.K202N | Q8N135 | protein_coding | tolerated(0.34) | benign(0.056) | TCGA-EK-A2RC-01 | Cervix | cervical & endocervical cancer | Female | <65 | I/II | Unknown | Unknown | SD | |
| LGI4 | deletion | Frame_Shift_Del | novel | c.1460_1461delNN | p.Leu487ProfsTer35 | p.L487Pfs*35 | Q8N135 | protein_coding | TCGA-DS-A1OC-01 | Cervix | cervical & endocervical cancer | Female | <65 | I/II | Chemotherapy | gemcitabine | SD | ||
| LGI4 | SNV | Missense_Mutation | c.328N>G | p.Asn110Asp | p.N110D | Q8N135 | protein_coding | deleterious(0) | possibly_damaging(0.802) | TCGA-AA-3710-01 | Colorectum | colon adenocarcinoma | Female | >=65 | I/II | Unknown | Unknown | SD | |
| LGI4 | SNV | Missense_Mutation | rs755198882 | c.1354N>A | p.Gly452Ser | p.G452S | Q8N135 | protein_coding | deleterious(0) | probably_damaging(1) | TCGA-AA-3845-01 | Colorectum | colon adenocarcinoma | Female | >=65 | I/II | Unknown | Unknown | PD |
| LGI4 | SNV | Missense_Mutation | c.371N>A | p.Arg124His | p.R124H | Q8N135 | protein_coding | tolerated(0.06) | possibly_damaging(0.886) | TCGA-AZ-4315-01 | Colorectum | colon adenocarcinoma | Male | <65 | I/II | Unknown | Unknown | SD | |
| LGI4 | SNV | Missense_Mutation | rs144343503 | c.370C>T | p.Arg124Cys | p.R124C | Q8N135 | protein_coding | deleterious(0) | probably_damaging(0.912) | TCGA-CA-6717-01 | Colorectum | colon adenocarcinoma | Male | <65 | I/II | Chemotherapy | oxaliplatin | CR |
| LGI4 | SNV | Missense_Mutation | novel | c.1501N>C | p.Ala501Pro | p.A501P | Q8N135 | protein_coding | deleterious(0) | probably_damaging(0.942) | TCGA-CK-6746-01 | Colorectum | colon adenocarcinoma | Female | >=65 | I/II | Unknown | Unknown | SD |
| Page: 1 2 3 4 5 |
Top |
Related drugs of malignant transformation related genes |
| Identification of chemicals and drugs interact with genes involved in malignant transfromation |
| (DGIdb 4.0) |
| Entrez ID | Symbol | Category | Interaction Types | Drug Claim Name | Drug Name | PMIDs |
| Page: 1 |

Copyright 2023-Present -The University of Texas Health Science Center at Houston |