
|
|||||
|
 | |
| |
| |
| |
| |
| |
|
Gene: LGALS9B |
Gene summary for LGALS9B |
| Gene information | Species | Human | Gene symbol | LGALS9B | Gene ID | 284194 |
| Gene name | galectin 9B | |
| Gene Alias | LGALS9B | |
| Cytomap | 17p11.2 | |
| Gene Type | protein-coding | GO ID | GO:0001775 | UniProtAcc | Q3B8N2 |
Top |
Malignant transformation analysis |
| Identification of the aberrant gene expression in precancerous and cancerous lesions by comparing the gene expression of stem-like cells in diseased tissues with normal stem cells |
| Entrez ID | Symbol | Replicates | Species | Organ | Tissue | Adj P-value | Log2FC | Malignancy |
| 284194 | LGALS9B | HTA11_2487_2000001011 | Human | Colorectum | SER | 6.33e-09 | 3.22e-01 | -0.1808 |
| 284194 | LGALS9B | HTA11_347_2000001011 | Human | Colorectum | AD | 2.62e-16 | 4.52e-01 | -0.1954 |
| 284194 | LGALS9B | HTA11_411_2000001011 | Human | Colorectum | SER | 3.90e-03 | 5.97e-01 | -0.2602 |
| 284194 | LGALS9B | HTA11_2112_2000001011 | Human | Colorectum | SER | 2.97e-02 | 4.18e-01 | -0.2196 |
| 284194 | LGALS9B | HTA11_3361_2000001011 | Human | Colorectum | AD | 4.03e-05 | 2.44e-01 | -0.1207 |
| 284194 | LGALS9B | HTA11_83_2000001011 | Human | Colorectum | SER | 1.52e-08 | 4.65e-01 | -0.1526 |
| 284194 | LGALS9B | HTA11_696_2000001011 | Human | Colorectum | AD | 1.32e-06 | 2.71e-01 | -0.1464 |
| 284194 | LGALS9B | HTA11_866_2000001011 | Human | Colorectum | AD | 2.24e-02 | 1.98e-01 | -0.1001 |
| 284194 | LGALS9B | HTA11_1391_2000001011 | Human | Colorectum | AD | 2.51e-04 | 1.73e-01 | -0.059 |
| 284194 | LGALS9B | HTA11_2992_2000001011 | Human | Colorectum | SER | 4.99e-02 | 2.99e-01 | -0.1706 |
| 284194 | LGALS9B | HTA11_5212_2000001011 | Human | Colorectum | AD | 7.54e-05 | 3.28e-01 | -0.2061 |
| 284194 | LGALS9B | HTA11_5216_2000001011 | Human | Colorectum | SER | 9.67e-03 | 3.81e-01 | -0.1462 |
| 284194 | LGALS9B | HTA11_546_2000001011 | Human | Colorectum | AD | 2.13e-03 | 2.84e-01 | -0.0842 |
| 284194 | LGALS9B | HTA11_10623_2000001011 | Human | Colorectum | AD | 1.98e-02 | 2.83e-01 | -0.0177 |
| 284194 | LGALS9B | C04 | Human | Oral cavity | OSCC | 2.62e-09 | 5.17e-01 | 0.2633 |
| 284194 | LGALS9B | C30 | Human | Oral cavity | OSCC | 1.34e-10 | 5.20e-01 | 0.3055 |
| 284194 | LGALS9B | C51 | Human | Oral cavity | OSCC | 3.85e-23 | 9.35e-01 | 0.2674 |
| 284194 | LGALS9B | SYSMH2 | Human | Oral cavity | OSCC | 4.78e-08 | 2.27e-01 | 0.2326 |
| 284194 | LGALS9B | SYSMH3 | Human | Oral cavity | OSCC | 6.77e-28 | 6.82e-01 | 0.2442 |
| Page: 1 |
| Tissue | Expression Dynamics | Abbreviation |
| Colorectum (GSE201348) |  | FAP: Familial adenomatous polyposis |
| CRC: Colorectal cancer | ||
| Colorectum (HTA11) |  | AD: Adenomas |
| SER: Sessile serrated lesions | ||
| MSI-H: Microsatellite-high colorectal cancer | ||
| MSS: Microsatellite stable colorectal cancer | ||
| Oral Cavity | 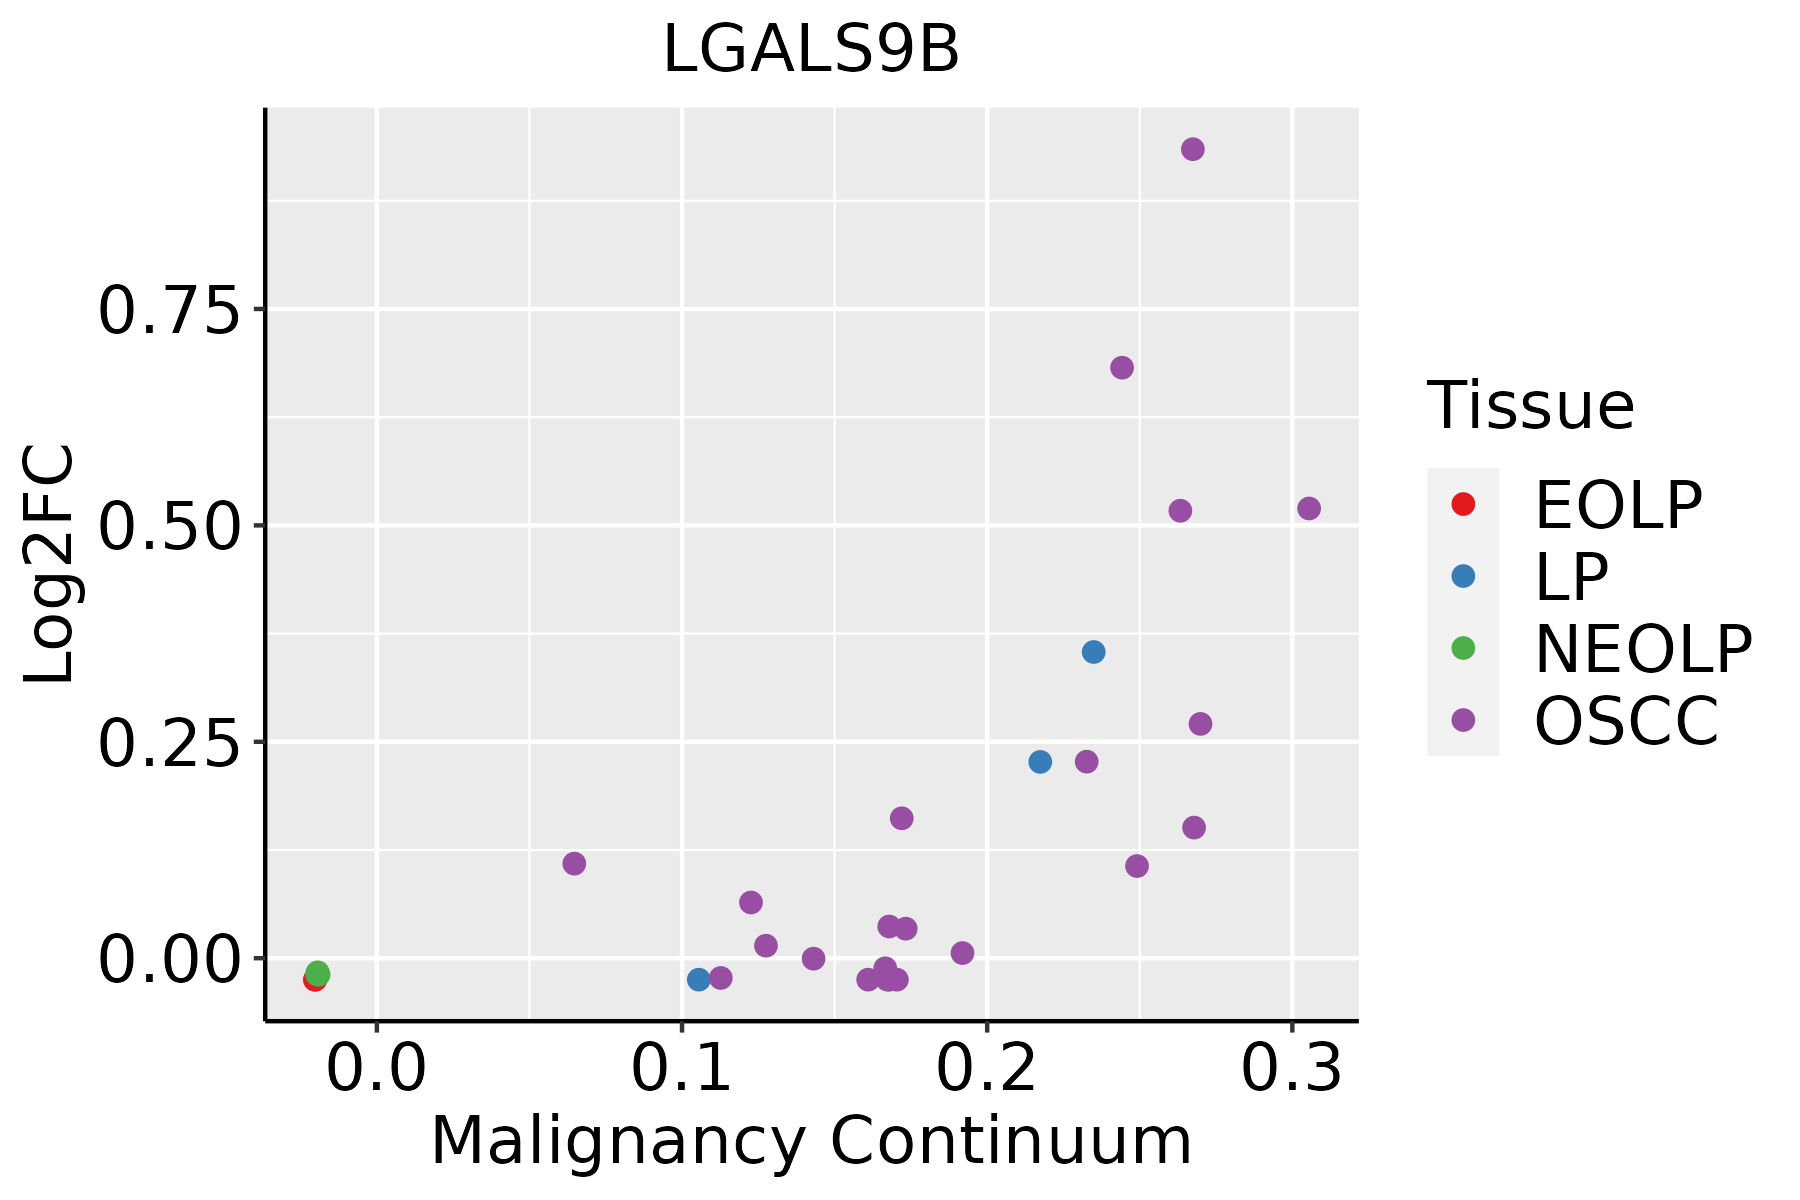 | EOLP: Erosive Oral lichen planus |
| LP: leukoplakia | ||
| NEOLP: Non-erosive oral lichen planus | ||
| OSCC: Oral squamous cell carcinoma |
| ∗log2FC in expression of this searched gene in stem-like cells from each diseased tissue sample relative to stem-like cells in normal samples in each tissue plotted against the malignancy continuum. Samples are colored based on if they are from different disease stage. |
Top |
Malignant transformation related pathway analysis |
| Find out the enriched GO biological processes and KEGG pathways involved in transition from healthy to precancer to cancer |
| Tissue | Disease Stage | Enriched GO biological Processes |
| Colorectum | AD |  |
| Colorectum | SER |  |
| Colorectum | MSS |  |
| Colorectum | MSI-H |  |
| Colorectum | FAP |  |
| ∗Top 15 enriched GO BP terms are showed in the bar plot of each disease state in each tissue. Each row represents a significant GO biological process which is colored according to the -log10(p.adjust). |
| Page: 1 2 3 4 5 6 7 8 9 |
| GO ID | Tissue | Disease Stage | Description | Gene Ratio | Bg Ratio | pvalue | p.adjust | Count |
| GO:0007162 | Colorectum | SER | negative regulation of cell adhesion | 68/2897 | 303/18723 | 8.02e-04 | 1.01e-02 | 68 |
| GO:0022408 | Colorectum | SER | negative regulation of cell-cell adhesion | 44/2897 | 196/18723 | 6.08e-03 | 4.42e-02 | 44 |
| GO:004211016 | Oral cavity | OSCC | T cell activation | 245/7305 | 487/18723 | 2.00e-07 | 3.22e-06 | 245 |
| GO:002240718 | Oral cavity | OSCC | regulation of cell-cell adhesion | 218/7305 | 448/18723 | 1.71e-05 | 1.68e-04 | 218 |
| GO:005086315 | Oral cavity | OSCC | regulation of T cell activation | 161/7305 | 329/18723 | 1.44e-04 | 1.02e-03 | 161 |
| GO:000715916 | Oral cavity | OSCC | leukocyte cell-cell adhesion | 178/7305 | 371/18723 | 2.44e-04 | 1.57e-03 | 178 |
| GO:190303715 | Oral cavity | OSCC | regulation of leukocyte cell-cell adhesion | 162/7305 | 336/18723 | 3.39e-04 | 2.08e-03 | 162 |
| GO:000268310 | Oral cavity | OSCC | negative regulation of immune system process | 204/7305 | 434/18723 | 3.72e-04 | 2.27e-03 | 204 |
| GO:004209816 | Oral cavity | OSCC | T cell proliferation | 100/7305 | 199/18723 | 7.93e-04 | 4.27e-03 | 100 |
| GO:00071629 | Oral cavity | OSCC | negative regulation of cell adhesion | 145/7305 | 303/18723 | 9.95e-04 | 5.18e-03 | 145 |
| GO:00466333 | Oral cavity | OSCC | alpha-beta T cell proliferation | 24/7305 | 38/18723 | 2.21e-03 | 1.00e-02 | 24 |
| GO:00466403 | Oral cavity | OSCC | regulation of alpha-beta T cell proliferation | 22/7305 | 35/18723 | 3.65e-03 | 1.51e-02 | 22 |
| GO:0046642 | Oral cavity | OSCC | negative regulation of alpha-beta T cell proliferation | 10/7305 | 13/18723 | 6.32e-03 | 2.35e-02 | 10 |
| GO:00706618 | Oral cavity | OSCC | leukocyte proliferation | 145/7305 | 318/18723 | 9.31e-03 | 3.33e-02 | 145 |
| GO:0035739 | Oral cavity | OSCC | CD4-positive, alpha-beta T cell proliferation | 9/7305 | 12/18723 | 1.27e-02 | 4.24e-02 | 9 |
| GO:2000561 | Oral cavity | OSCC | regulation of CD4-positive, alpha-beta T cell proliferation | 9/7305 | 12/18723 | 1.27e-02 | 4.24e-02 | 9 |
| GO:00224086 | Oral cavity | OSCC | negative regulation of cell-cell adhesion | 92/7305 | 196/18723 | 1.41e-02 | 4.64e-02 | 92 |
| GO:00466517 | Oral cavity | OSCC | lymphocyte proliferation | 131/7305 | 288/18723 | 1.41e-02 | 4.67e-02 | 131 |
| Page: 1 |
| Pathway ID | Tissue | Disease Stage | Description | Gene Ratio | Bg Ratio | pvalue | p.adjust | qvalue | Count |
| Page: 1 |
Top |
Cell-cell communication analysis |
| Identification of potential cell-cell interactions between two cell types and their ligand-receptor pairs for different disease states |
| Ligand | Receptor | LRpair | Pathway | Tissue | Disease Stage |
| Page: 1 |
Top |
Single-cell gene regulatory network inference analysis |
| Find out the significant the regulons (TFs) and the target genes of each regulon across cell types for different disease states |
| TF | Cell Type | Tissue | Disease Stage | Target Gene | RSS | Regulon Activity |
| ∗The dot plots of a searched regulon are shown for all cell subpopulations in each disease state of each tissue based on the regulon specific score inferred using pySCENIC and by calculating the average expression. |
| Page: 1 |
Top |
Somatic mutation of malignant transformation related genes |
| Annotation of somatic variants for genes involved in malignant transformation |
| Hugo Symbol | Variant Class | Variant Classification | dbSNP RS | HGVSc | HGVSp | HGVSp Short | SWISSPROT | BIOTYPE | SIFT | PolyPhen | Tumor Sample Barcode | Tissue | Histology | Sex | Age | Stage | Therapy Types | Drugs | Outcome |
| LGALS9B | SNV | Missense_Mutation | c.584N>T | p.Thr195Ile | p.T195I | Q3B8N2 | protein_coding | deleterious(0.01) | benign(0.187) | TCGA-A8-A079-01 | Breast | breast invasive carcinoma | Female | >=65 | III/IV | Chemotherapy | 5-fluorouracil | SD | |
| LGALS9B | SNV | Missense_Mutation | novel | c.554N>A | p.Arg185Gln | p.R185Q | Q3B8N2 | protein_coding | tolerated(0.42) | benign(0.001) | TCGA-B6-A1KF-01 | Breast | breast invasive carcinoma | Female | >=65 | I/II | Unknown | Unknown | SD |
| LGALS9B | insertion | Nonsense_Mutation | novel | c.148_149insCCAGCCCTATCAGGT | p.Gln50delinsProSerProIleArgTer | p.Q50delinsPSPIR* | Q3B8N2 | protein_coding | TCGA-A8-A08S-01 | Breast | breast invasive carcinoma | Female | >=65 | I/II | Hormone Therapy | anastrozole | SD | ||
| LGALS9B | SNV | Missense_Mutation | rs768504475 | c.530N>A | p.Arg177His | p.R177H | Q3B8N2 | protein_coding | tolerated(0.26) | benign(0.006) | TCGA-AA-3492-01 | Colorectum | colon adenocarcinoma | Female | >=65 | I/II | Unknown | Unknown | SD |
| LGALS9B | SNV | Missense_Mutation | c.234G>T | p.Gln78His | p.Q78H | Q3B8N2 | protein_coding | deleterious(0.03) | benign(0.062) | TCGA-AA-A010-01 | Colorectum | colon adenocarcinoma | Female | <65 | I/II | Chemotherapy | folinic | CR | |
| LGALS9B | SNV | Missense_Mutation | rs752504822 | c.607N>A | p.Ala203Thr | p.A203T | Q3B8N2 | protein_coding | tolerated(0.54) | benign(0) | TCGA-WS-AB45-01 | Colorectum | colon adenocarcinoma | Female | <65 | I/II | Unknown | Unknown | SD |
| LGALS9B | SNV | Missense_Mutation | rs200824290 | c.976N>A | p.Val326Met | p.V326M | Q3B8N2 | protein_coding | tolerated(0.18) | benign(0.017) | TCGA-A5-A0G1-01 | Endometrium | uterine corpus endometrioid carcinoma | Female | >=65 | I/II | Unknown | Unknown | SD |
| LGALS9B | SNV | Missense_Mutation | novel | c.676N>T | p.Pro226Ser | p.P226S | Q3B8N2 | protein_coding | deleterious(0) | probably_damaging(1) | TCGA-A5-A0G2-01 | Endometrium | uterine corpus endometrioid carcinoma | Female | <65 | III/IV | Unknown | Unknown | SD |
| LGALS9B | SNV | Missense_Mutation | novel | c.707A>G | p.Tyr236Cys | p.Y236C | Q3B8N2 | protein_coding | tolerated(0.09) | benign(0.226) | TCGA-B5-A3FA-01 | Endometrium | uterine corpus endometrioid carcinoma | Female | >=65 | I/II | Unknown | Unknown | SD |
| LGALS9B | SNV | Missense_Mutation | rs768202333 | c.994C>T | p.Arg332Cys | p.R332C | Q3B8N2 | protein_coding | deleterious(0.02) | probably_damaging(0.922) | TCGA-B5-A3FC-01 | Endometrium | uterine corpus endometrioid carcinoma | Female | <65 | I/II | Unknown | Unknown | SD |
| Page: 1 2 3 |
Top |
Related drugs of malignant transformation related genes |
| Identification of chemicals and drugs interact with genes involved in malignant transfromation |
| (DGIdb 4.0) |
| Entrez ID | Symbol | Category | Interaction Types | Drug Claim Name | Drug Name | PMIDs |
| Page: 1 |

Copyright 2023-Present -The University of Texas Health Science Center at Houston |