
|
|||||
|
 | |
| |
| |
| |
| |
| |
|
Gene: LGALS9 |
Gene summary for LGALS9 |
| Gene information | Species | Human | Gene symbol | LGALS9 | Gene ID | 3965 |
| Gene name | galectin 9 | |
| Gene Alias | HUAT | |
| Cytomap | 17q11.2 | |
| Gene Type | protein-coding | GO ID | GO:0000003 | UniProtAcc | O00182 |
Top |
Malignant transformation analysis |
| Identification of the aberrant gene expression in precancerous and cancerous lesions by comparing the gene expression of stem-like cells in diseased tissues with normal stem cells |
| Entrez ID | Symbol | Replicates | Species | Organ | Tissue | Adj P-value | Log2FC | Malignancy |
| 3965 | LGALS9 | HTA11_3410_2000001011 | Human | Colorectum | AD | 2.04e-10 | 4.39e-01 | 0.0155 |
| 3965 | LGALS9 | HTA11_2487_2000001011 | Human | Colorectum | SER | 5.36e-24 | 9.44e-01 | -0.1808 |
| 3965 | LGALS9 | HTA11_1938_2000001011 | Human | Colorectum | AD | 7.49e-12 | 7.31e-01 | -0.0811 |
| 3965 | LGALS9 | HTA11_78_2000001011 | Human | Colorectum | AD | 2.39e-08 | 5.97e-01 | -0.1088 |
| 3965 | LGALS9 | HTA11_347_2000001011 | Human | Colorectum | AD | 1.37e-42 | 1.17e+00 | -0.1954 |
| 3965 | LGALS9 | HTA11_411_2000001011 | Human | Colorectum | SER | 5.33e-05 | 1.05e+00 | -0.2602 |
| 3965 | LGALS9 | HTA11_2112_2000001011 | Human | Colorectum | SER | 1.91e-02 | 8.52e-01 | -0.2196 |
| 3965 | LGALS9 | HTA11_3361_2000001011 | Human | Colorectum | AD | 1.33e-19 | 9.69e-01 | -0.1207 |
| 3965 | LGALS9 | HTA11_83_2000001011 | Human | Colorectum | SER | 9.10e-13 | 8.24e-01 | -0.1526 |
| 3965 | LGALS9 | HTA11_696_2000001011 | Human | Colorectum | AD | 1.34e-33 | 8.88e-01 | -0.1464 |
| 3965 | LGALS9 | HTA11_866_2000001011 | Human | Colorectum | AD | 1.57e-17 | 7.41e-01 | -0.1001 |
| 3965 | LGALS9 | HTA11_1391_2000001011 | Human | Colorectum | AD | 7.71e-25 | 9.18e-01 | -0.059 |
| 3965 | LGALS9 | HTA11_2992_2000001011 | Human | Colorectum | SER | 3.90e-04 | 6.42e-01 | -0.1706 |
| 3965 | LGALS9 | HTA11_5216_2000001011 | Human | Colorectum | SER | 4.07e-07 | 8.28e-01 | -0.1462 |
| 3965 | LGALS9 | HTA11_546_2000001011 | Human | Colorectum | AD | 3.35e-17 | 1.10e+00 | -0.0842 |
| 3965 | LGALS9 | HTA11_9341_2000001011 | Human | Colorectum | SER | 2.24e-02 | 5.51e-01 | -0.00410000000000005 |
| 3965 | LGALS9 | HTA11_7862_2000001011 | Human | Colorectum | AD | 8.53e-03 | 3.63e-01 | -0.0179 |
| 3965 | LGALS9 | HTA11_866_3004761011 | Human | Colorectum | AD | 8.83e-11 | 3.63e-01 | 0.096 |
| 3965 | LGALS9 | HTA11_4255_2000001011 | Human | Colorectum | SER | 4.70e-03 | 4.08e-01 | 0.0446 |
| 3965 | LGALS9 | HTA11_9408_2000001011 | Human | Colorectum | AD | 7.23e-04 | 1.01e+00 | 0.0451 |
| Page: 1 2 3 4 5 6 |
| Tissue | Expression Dynamics | Abbreviation |
| Colorectum (GSE201348) |  | FAP: Familial adenomatous polyposis |
| CRC: Colorectal cancer | ||
| Colorectum (HTA11) |  | AD: Adenomas |
| SER: Sessile serrated lesions | ||
| MSI-H: Microsatellite-high colorectal cancer | ||
| MSS: Microsatellite stable colorectal cancer | ||
| Esophagus | 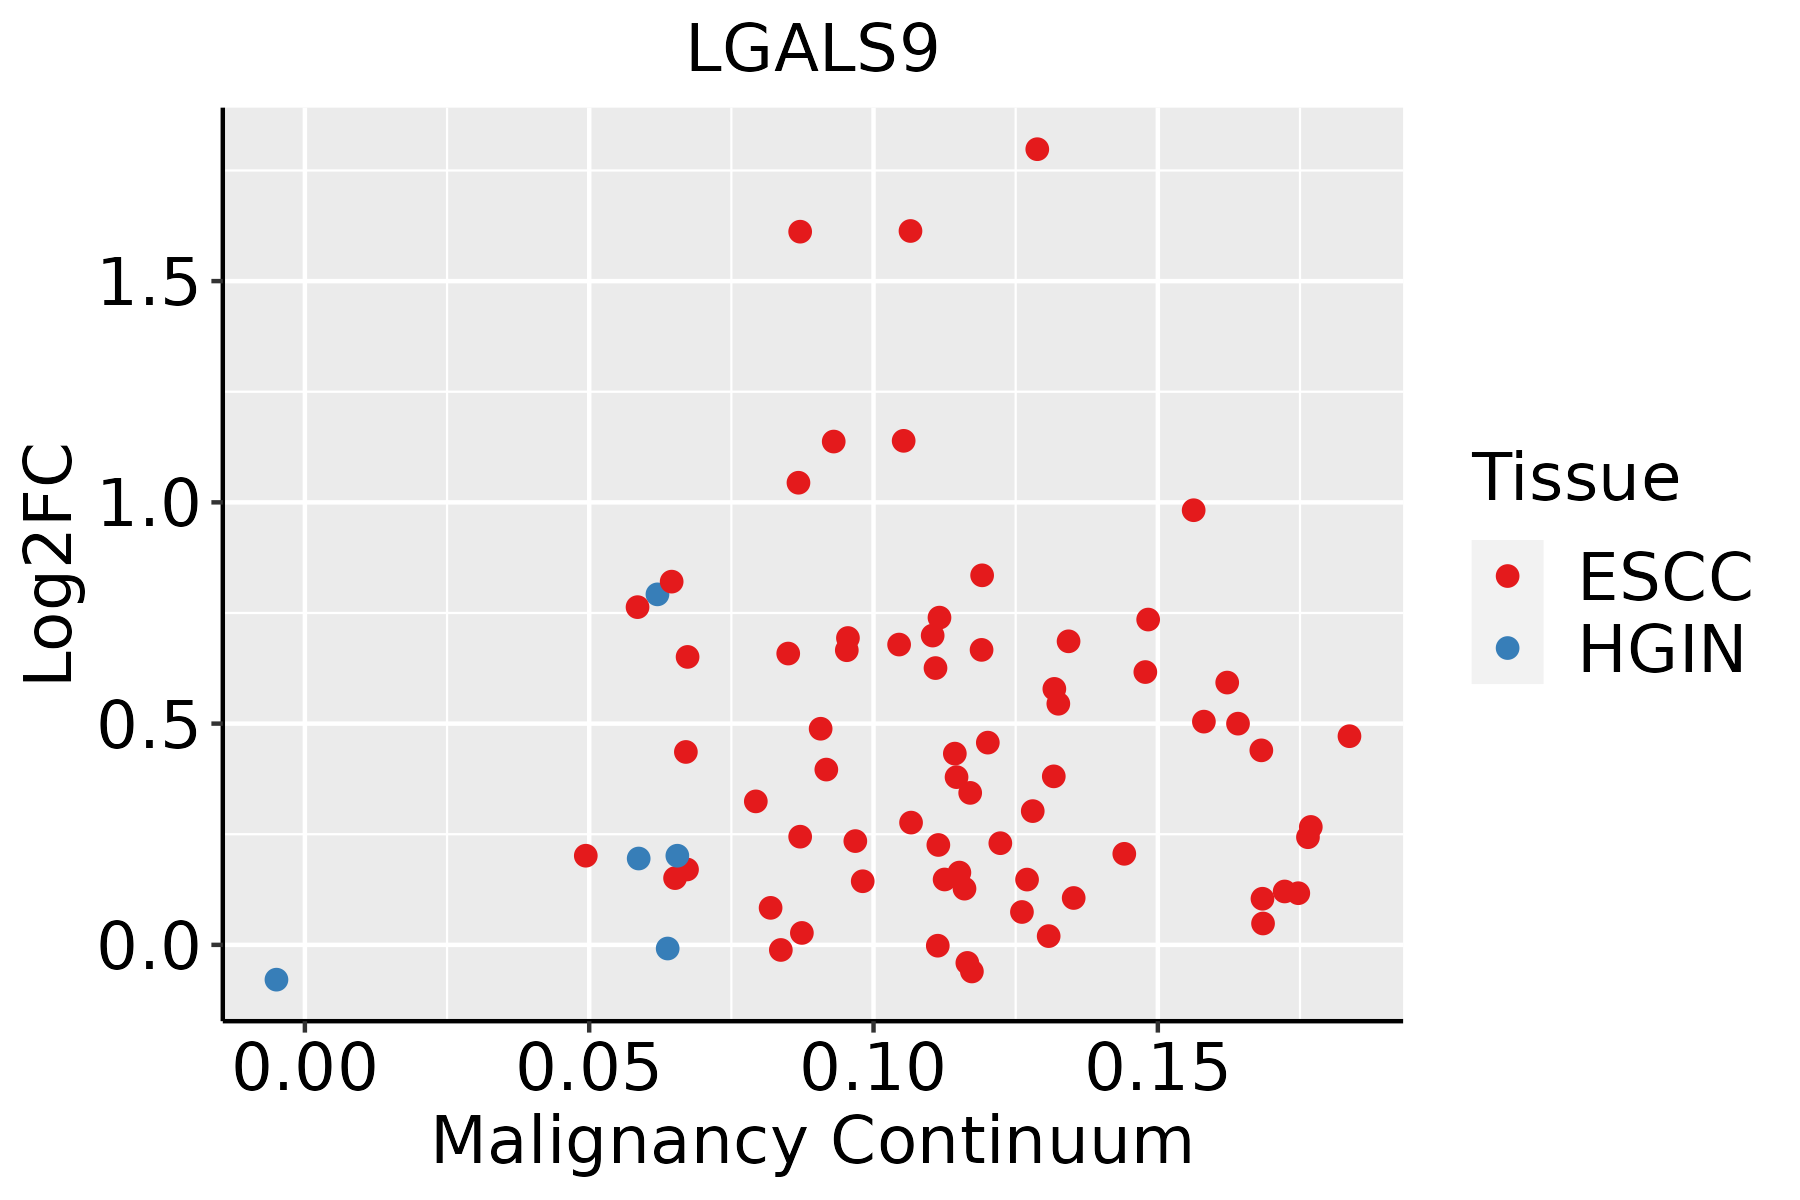 | ESCC: Esophageal squamous cell carcinoma |
| HGIN: High-grade intraepithelial neoplasias | ||
| LGIN: Low-grade intraepithelial neoplasias | ||
| Liver | 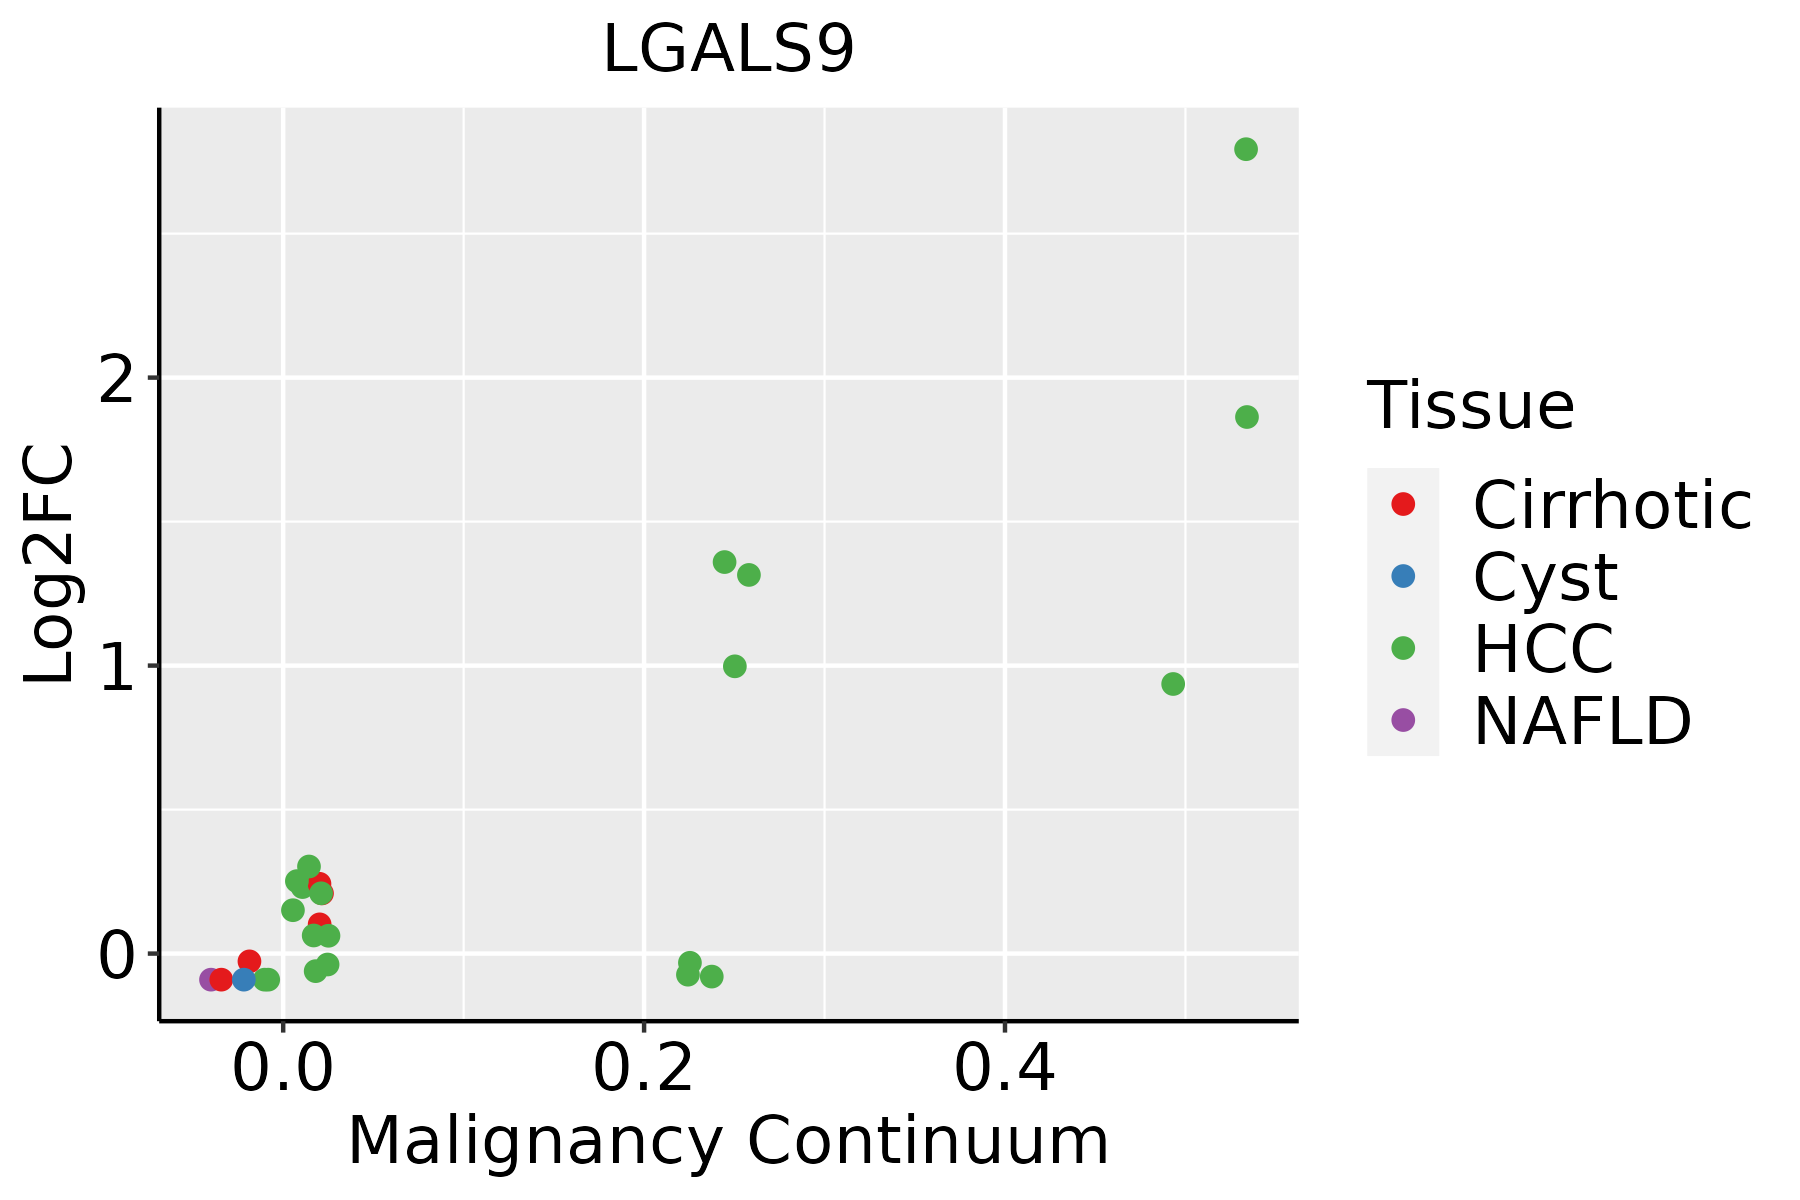 | HCC: Hepatocellular carcinoma |
| NAFLD: Non-alcoholic fatty liver disease | ||
| Oral Cavity | 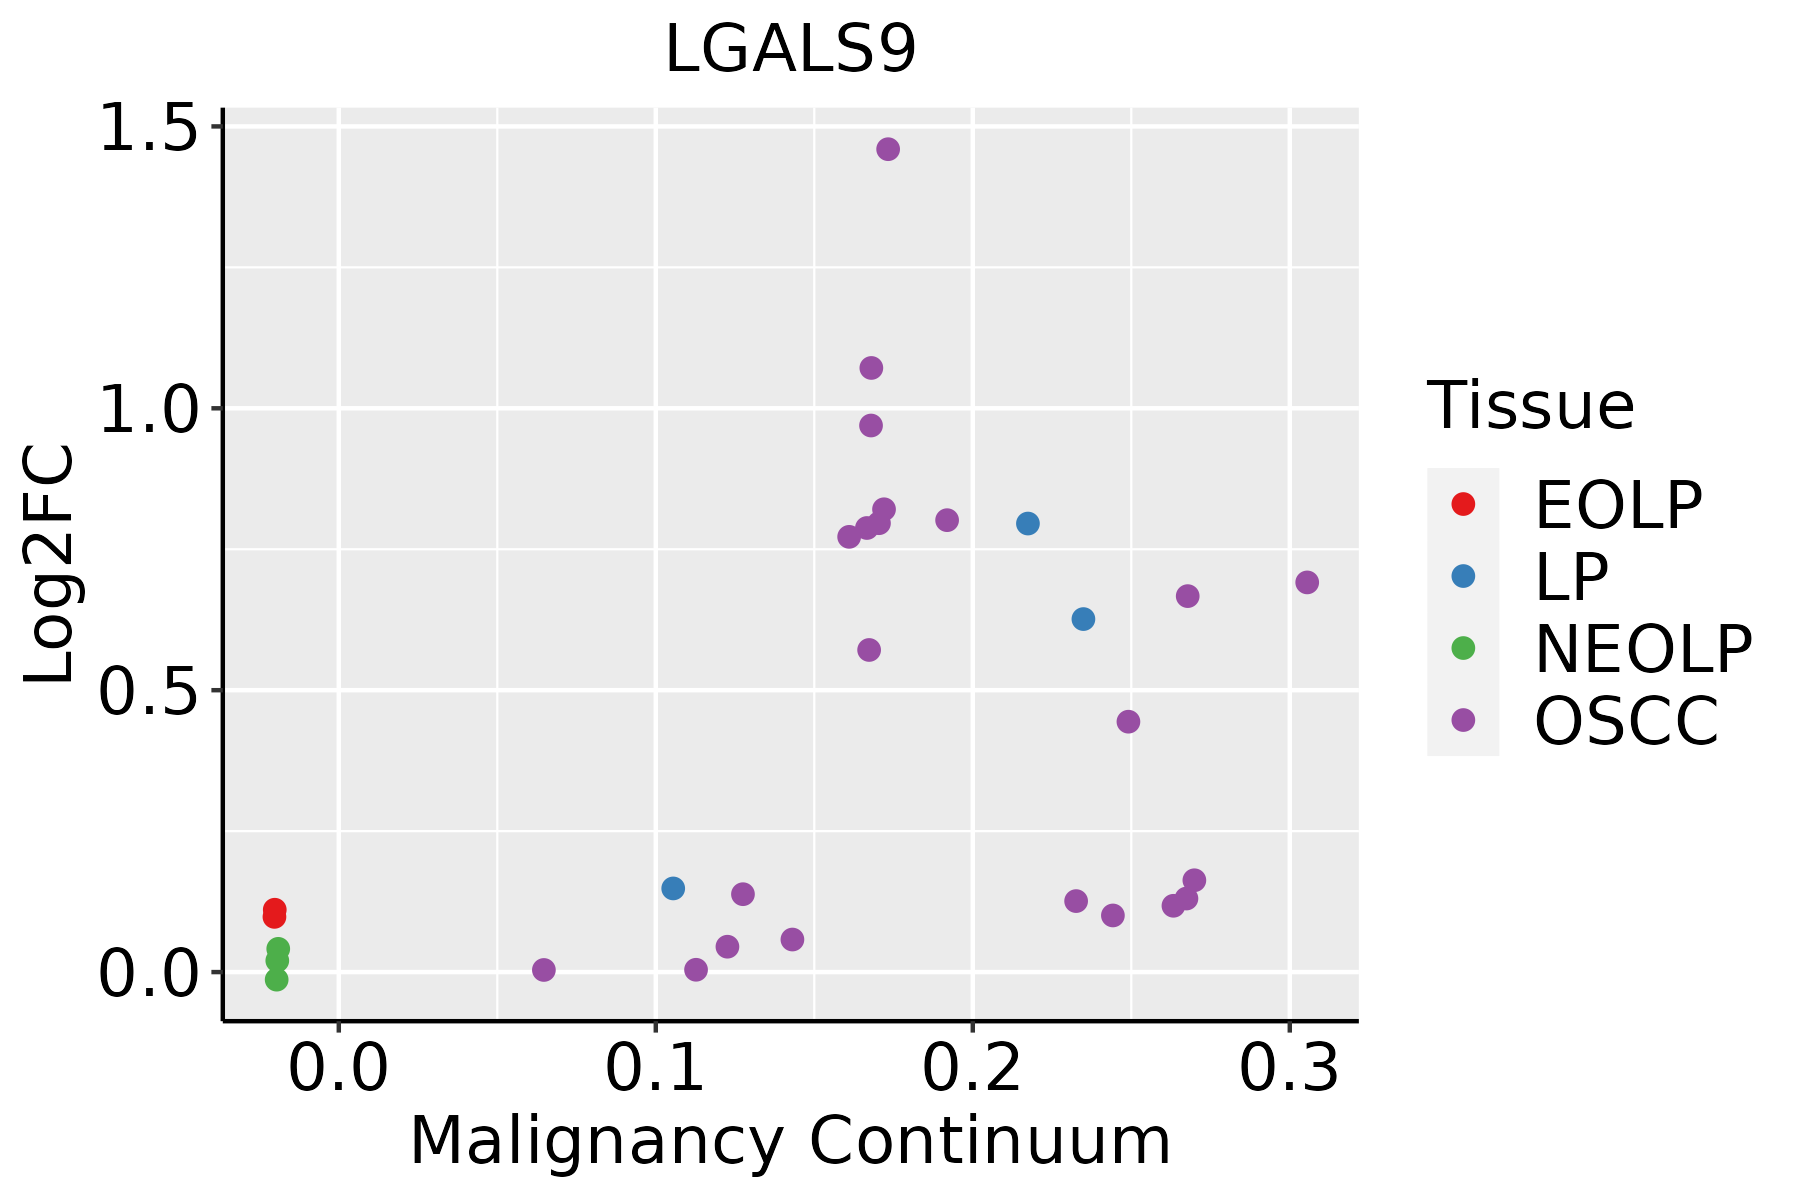 | EOLP: Erosive Oral lichen planus |
| LP: leukoplakia | ||
| NEOLP: Non-erosive oral lichen planus | ||
| OSCC: Oral squamous cell carcinoma | ||
| Thyroid | 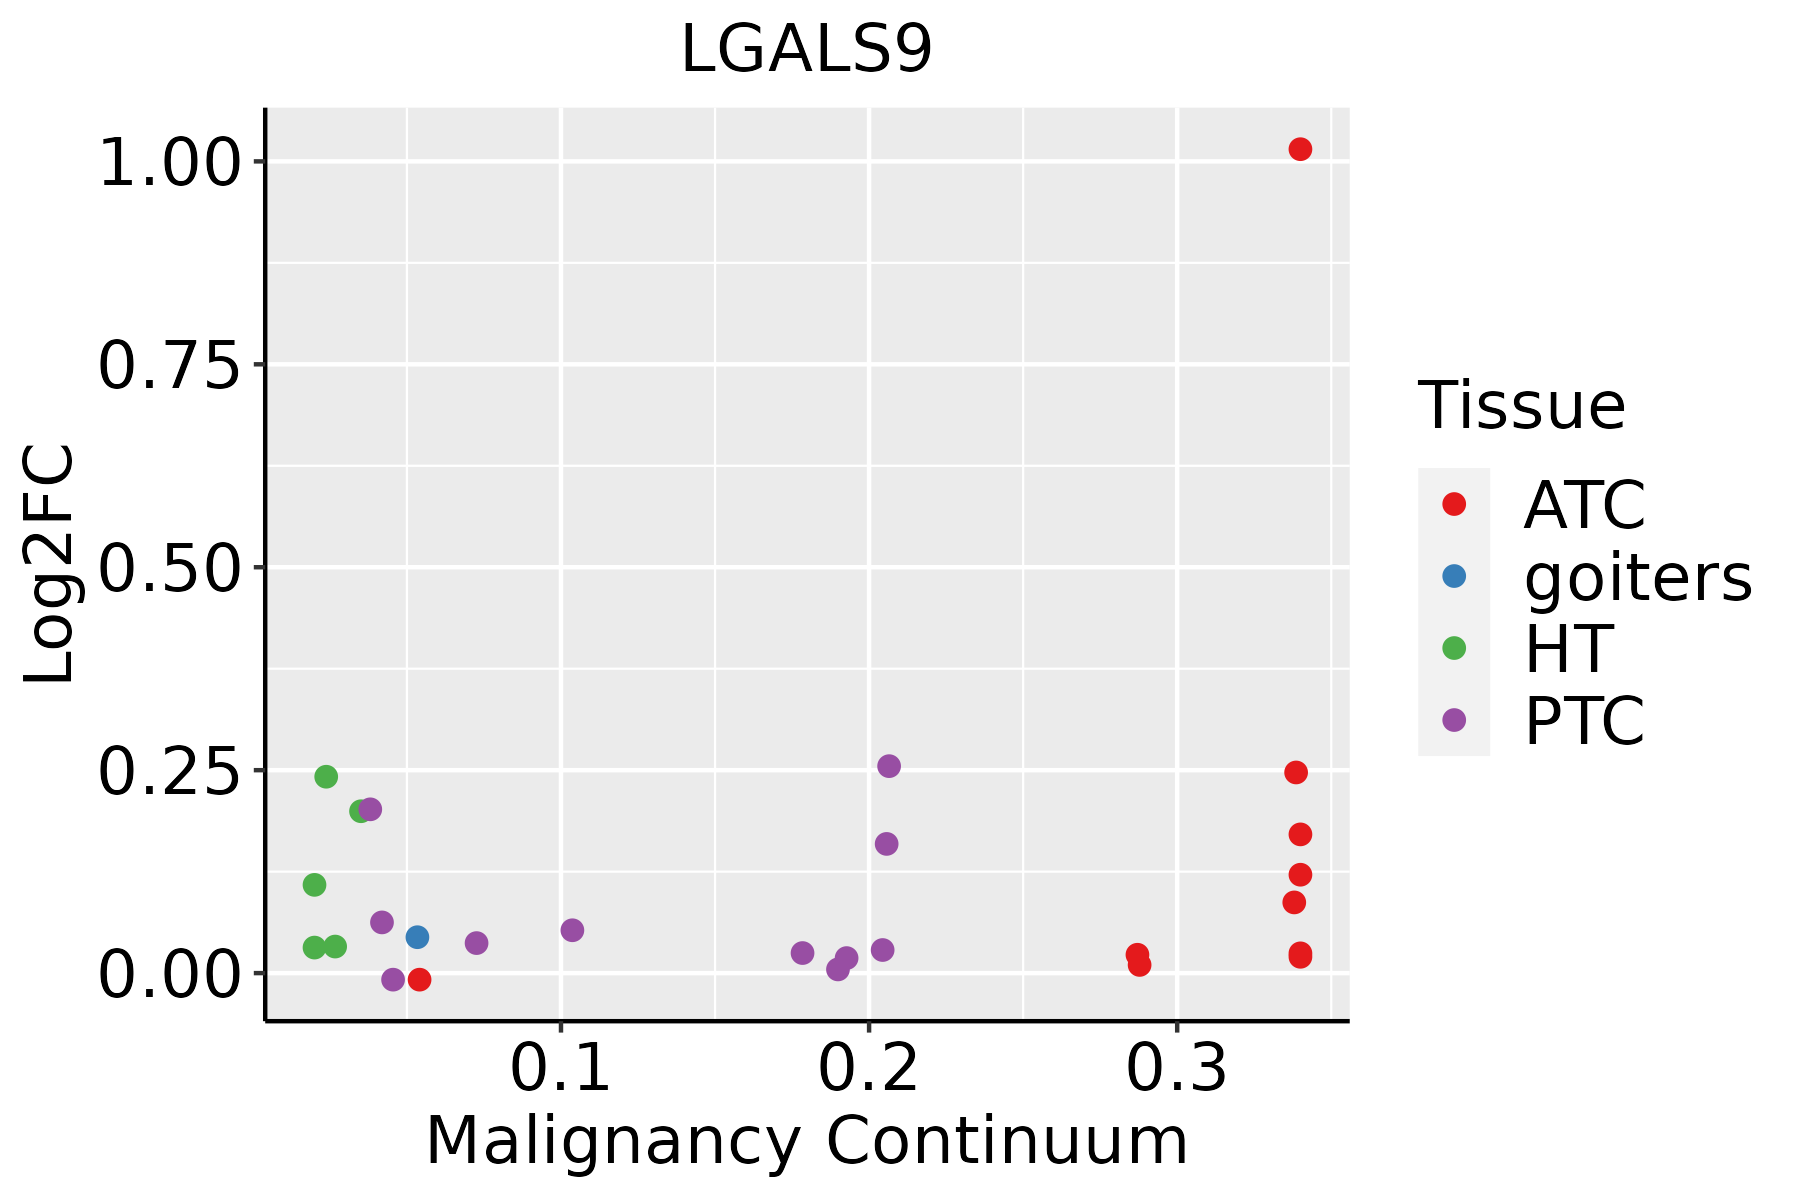 | ATC: Anaplastic thyroid cancer |
| HT: Hashimoto's thyroiditis | ||
| PTC: Papillary thyroid cancer |
| ∗log2FC in expression of this searched gene in stem-like cells from each diseased tissue sample relative to stem-like cells in normal samples in each tissue plotted against the malignancy continuum. Samples are colored based on if they are from different disease stage. |
Top |
Malignant transformation related pathway analysis |
| Find out the enriched GO biological processes and KEGG pathways involved in transition from healthy to precancer to cancer |
| Tissue | Disease Stage | Enriched GO biological Processes |
| Colorectum | AD |  |
| Colorectum | SER |  |
| Colorectum | MSS |  |
| Colorectum | MSI-H |  |
| Colorectum | FAP |  |
| ∗Top 15 enriched GO BP terms are showed in the bar plot of each disease state in each tissue. Each row represents a significant GO biological process which is colored according to the -log10(p.adjust). |
| Page: 1 2 3 4 5 6 7 8 9 |
| GO ID | Tissue | Disease Stage | Description | Gene Ratio | Bg Ratio | pvalue | p.adjust | Count |
| GO:0016032 | Colorectum | AD | viral process | 168/3918 | 415/18723 | 4.67e-20 | 3.66e-17 | 168 |
| GO:0019058 | Colorectum | AD | viral life cycle | 119/3918 | 317/18723 | 6.18e-12 | 8.23e-10 | 119 |
| GO:0045862 | Colorectum | AD | positive regulation of proteolysis | 129/3918 | 372/18723 | 4.04e-10 | 3.46e-08 | 129 |
| GO:0051656 | Colorectum | AD | establishment of organelle localization | 131/3918 | 390/18723 | 3.00e-09 | 2.06e-07 | 131 |
| GO:0044403 | Colorectum | AD | biological process involved in symbiotic interaction | 99/3918 | 290/18723 | 1.02e-07 | 4.93e-06 | 99 |
| GO:0051701 | Colorectum | AD | biological process involved in interaction with host | 73/3918 | 203/18723 | 5.08e-07 | 1.88e-05 | 73 |
| GO:0048524 | Colorectum | AD | positive regulation of viral process | 31/3918 | 65/18723 | 1.33e-06 | 4.23e-05 | 31 |
| GO:0052126 | Colorectum | AD | movement in host environment | 63/3918 | 175/18723 | 2.85e-06 | 8.11e-05 | 63 |
| GO:0043281 | Colorectum | AD | regulation of cysteine-type endopeptidase activity involved in apoptotic process | 72/3918 | 209/18723 | 3.70e-06 | 1.03e-04 | 72 |
| GO:2000116 | Colorectum | AD | regulation of cysteine-type endopeptidase activity | 79/3918 | 235/18723 | 3.74e-06 | 1.03e-04 | 79 |
| GO:0052547 | Colorectum | AD | regulation of peptidase activity | 137/3918 | 461/18723 | 4.12e-06 | 1.12e-04 | 137 |
| GO:0050792 | Colorectum | AD | regulation of viral process | 59/3918 | 164/18723 | 5.95e-06 | 1.52e-04 | 59 |
| GO:0010952 | Colorectum | AD | positive regulation of peptidase activity | 68/3918 | 197/18723 | 6.30e-06 | 1.59e-04 | 68 |
| GO:0048872 | Colorectum | AD | homeostasis of number of cells | 87/3918 | 272/18723 | 1.16e-05 | 2.61e-04 | 87 |
| GO:0046718 | Colorectum | AD | viral entry into host cell | 51/3918 | 144/18723 | 3.99e-05 | 7.16e-04 | 51 |
| GO:0052548 | Colorectum | AD | regulation of endopeptidase activity | 124/3918 | 432/18723 | 6.58e-05 | 1.07e-03 | 124 |
| GO:1903900 | Colorectum | AD | regulation of viral life cycle | 51/3918 | 148/18723 | 9.01e-05 | 1.38e-03 | 51 |
| GO:0010950 | Colorectum | AD | positive regulation of endopeptidase activity | 59/3918 | 179/18723 | 1.11e-04 | 1.65e-03 | 59 |
| GO:0044409 | Colorectum | AD | entry into host | 51/3918 | 151/18723 | 1.60e-04 | 2.21e-03 | 51 |
| GO:0043123 | Colorectum | AD | positive regulation of I-kappaB kinase/NF-kappaB signaling | 60/3918 | 186/18723 | 1.91e-04 | 2.56e-03 | 60 |
| Page: 1 2 3 4 5 6 7 8 9 10 11 12 13 14 15 16 17 18 19 20 21 22 23 24 25 26 27 28 29 30 |
| Pathway ID | Tissue | Disease Stage | Description | Gene Ratio | Bg Ratio | pvalue | p.adjust | qvalue | Count |
| Page: 1 |
Top |
Cell-cell communication analysis |
| Identification of potential cell-cell interactions between two cell types and their ligand-receptor pairs for different disease states |
| Ligand | Receptor | LRpair | Pathway | Tissue | Disease Stage |
| LGALS9 | PTPRC | LGALS9_CD45 | GALECTIN | Breast | ADJ |
| LGALS9 | CD44 | LGALS9_CD44 | GALECTIN | Breast | ADJ |
| LGALS9 | PTPRC | LGALS9_CD45 | GALECTIN | Breast | DCIS |
| LGALS9 | HAVCR2 | LGALS9_HAVCR2 | GALECTIN | Breast | DCIS |
| LGALS9 | CD44 | LGALS9_CD44 | GALECTIN | Breast | DCIS |
| LGALS9 | PTPRC | LGALS9_CD45 | GALECTIN | Breast | Healthy |
| LGALS9 | HAVCR2 | LGALS9_HAVCR2 | GALECTIN | Breast | Healthy |
| LGALS9 | CD44 | LGALS9_CD44 | GALECTIN | Breast | Healthy |
| LGALS9 | PTPRC | LGALS9_CD45 | GALECTIN | Breast | IDC |
| LGALS9 | HAVCR2 | LGALS9_HAVCR2 | GALECTIN | Breast | IDC |
| LGALS9 | CD44 | LGALS9_CD44 | GALECTIN | Breast | IDC |
| LGALS9 | PTPRC | LGALS9_CD45 | GALECTIN | Cervix | ADJ |
| LGALS9 | HAVCR2 | LGALS9_HAVCR2 | GALECTIN | Cervix | ADJ |
| LGALS9 | CD44 | LGALS9_CD44 | GALECTIN | Cervix | ADJ |
| LGALS9 | PTPRC | LGALS9_CD45 | GALECTIN | Cervix | CC |
| LGALS9 | HAVCR2 | LGALS9_HAVCR2 | GALECTIN | Cervix | CC |
| LGALS9 | CD44 | LGALS9_CD44 | GALECTIN | Cervix | CC |
| LGALS9 | PTPRC | LGALS9_CD45 | GALECTIN | Cervix | Precancer |
| LGALS9 | HAVCR2 | LGALS9_HAVCR2 | GALECTIN | Cervix | Precancer |
| LGALS9 | CD44 | LGALS9_CD44 | GALECTIN | Cervix | Precancer |
| Page: 1 2 3 4 5 6 |
Top |
Single-cell gene regulatory network inference analysis |
| Find out the significant the regulons (TFs) and the target genes of each regulon across cell types for different disease states |
| TF | Cell Type | Tissue | Disease Stage | Target Gene | RSS | Regulon Activity |
| ∗The dot plots of a searched regulon are shown for all cell subpopulations in each disease state of each tissue based on the regulon specific score inferred using pySCENIC and by calculating the average expression. |
| Page: 1 |
Top |
Somatic mutation of malignant transformation related genes |
| Annotation of somatic variants for genes involved in malignant transformation |
| Hugo Symbol | Variant Class | Variant Classification | dbSNP RS | HGVSc | HGVSp | HGVSp Short | SWISSPROT | BIOTYPE | SIFT | PolyPhen | Tumor Sample Barcode | Tissue | Histology | Sex | Age | Stage | Therapy Types | Drugs | Outcome |
| LGALS9 | SNV | Missense_Mutation | novel | c.520C>A | p.Pro174Thr | p.P174T | O00182 | protein_coding | deleterious(0.02) | benign(0.122) | TCGA-AN-A0G0-01 | Breast | breast invasive carcinoma | Female | <65 | I/II | Unknown | Unknown | SD |
| LGALS9 | SNV | Missense_Mutation | novel | c.70N>A | p.Gly24Ser | p.G24S | O00182 | protein_coding | tolerated(0.09) | possibly_damaging(0.763) | TCGA-C8-A27A-01 | Breast | breast invasive carcinoma | Female | <65 | I/II | Chemotherapy | 5-fluorouracil | CR |
| LGALS9 | SNV | Missense_Mutation | novel | c.671N>T | p.Pro224Leu | p.P224L | O00182 | protein_coding | tolerated(0.17) | benign(0.001) | TCGA-EA-A410-01 | Cervix | cervical & endocervical cancer | Female | <65 | I/II | Unknown | Unknown | SD |
| LGALS9 | SNV | Missense_Mutation | c.25N>T | p.Pro9Ser | p.P9S | O00182 | protein_coding | tolerated(0.08) | benign(0.035) | TCGA-IR-A3LA-01 | Cervix | cervical & endocervical cancer | Female | <65 | I/II | Chemotherapy | cisplatin | CR | |
| LGALS9 | SNV | Missense_Mutation | novel | c.595N>G | p.Thr199Ala | p.T199A | O00182 | protein_coding | tolerated(0.19) | benign(0.003) | TCGA-A6-2686-01 | Colorectum | colon adenocarcinoma | Female | >=65 | I/II | Unknown | Unknown | SD |
| LGALS9 | SNV | Missense_Mutation | rs147965169 | c.812N>A | p.Arg271His | p.R271H | O00182 | protein_coding | deleterious(0.02) | possibly_damaging(0.78) | TCGA-AA-3672-01 | Colorectum | colon adenocarcinoma | Female | >=65 | III/IV | Unknown | Unknown | SD |
| LGALS9 | SNV | Missense_Mutation | novel | c.217G>A | p.Val73Met | p.V73M | O00182 | protein_coding | deleterious(0) | probably_damaging(0.999) | TCGA-AA-3678-01 | Colorectum | colon adenocarcinoma | Female | <65 | III/IV | Chemotherapy | folinic | CR |
| LGALS9 | SNV | Missense_Mutation | c.827C>T | p.Ala276Val | p.A276V | O00182 | protein_coding | tolerated(0.26) | benign(0.161) | TCGA-AD-A5EJ-01 | Colorectum | colon adenocarcinoma | Female | >=65 | I/II | Unknown | Unknown | SD | |
| LGALS9 | SNV | Missense_Mutation | rs147965169 | c.812N>A | p.Arg271His | p.R271H | O00182 | protein_coding | deleterious(0.02) | possibly_damaging(0.78) | TCGA-D5-6530-01 | Colorectum | colon adenocarcinoma | Male | <65 | I/II | Unknown | Unknown | SD |
| LGALS9 | SNV | Missense_Mutation | rs753232858 | c.274C>A | p.Pro92Thr | p.P92T | O00182 | protein_coding | deleterious(0) | probably_damaging(0.998) | TCGA-AG-A02X-01 | Colorectum | rectum adenocarcinoma | Male | >=65 | I/II | Unknown | Unknown | SD |
| Page: 1 2 3 4 |
Top |
Related drugs of malignant transformation related genes |
| Identification of chemicals and drugs interact with genes involved in malignant transfromation |
| (DGIdb 4.0) |
| Entrez ID | Symbol | Category | Interaction Types | Drug Claim Name | Drug Name | PMIDs |
| 3965 | LGALS9 | DRUGGABLE GENOME, TRANSPORTER | LACTOSE, ANHYDROUS | LACTOSE, ANHYDROUS | 21524586 |
| Page: 1 |

Copyright 2023-Present -The University of Texas Health Science Center at Houston |