
|
|||||
|
 | |
| |
| |
| |
| |
| |
|
Gene: LGALS8 |
Gene summary for LGALS8 |
| Gene information | Species | Human | Gene symbol | LGALS8 | Gene ID | 3964 |
| Gene name | galectin 8 | |
| Gene Alias | Gal-8 | |
| Cytomap | 1q43 | |
| Gene Type | protein-coding | GO ID | GO:0001667 | UniProtAcc | O00214 |
Top |
Malignant transformation analysis |
| Identification of the aberrant gene expression in precancerous and cancerous lesions by comparing the gene expression of stem-like cells in diseased tissues with normal stem cells |
| Entrez ID | Symbol | Replicates | Species | Organ | Tissue | Adj P-value | Log2FC | Malignancy |
| 3964 | LGALS8 | LZE2T | Human | Esophagus | ESCC | 3.78e-05 | 6.25e-01 | 0.082 |
| 3964 | LGALS8 | LZE4T | Human | Esophagus | ESCC | 4.31e-16 | 1.58e-01 | 0.0811 |
| 3964 | LGALS8 | LZE5T | Human | Esophagus | ESCC | 5.99e-05 | 3.07e-01 | 0.0514 |
| 3964 | LGALS8 | LZE7T | Human | Esophagus | ESCC | 6.35e-04 | 3.61e-01 | 0.0667 |
| 3964 | LGALS8 | LZE8T | Human | Esophagus | ESCC | 3.01e-04 | 1.65e-01 | 0.067 |
| 3964 | LGALS8 | LZE20T | Human | Esophagus | ESCC | 5.62e-04 | 2.51e-01 | 0.0662 |
| 3964 | LGALS8 | LZE22T | Human | Esophagus | ESCC | 2.76e-04 | 5.27e-01 | 0.068 |
| 3964 | LGALS8 | LZE24T | Human | Esophagus | ESCC | 6.72e-08 | 2.87e-01 | 0.0596 |
| 3964 | LGALS8 | LZE6T | Human | Esophagus | ESCC | 2.28e-06 | 1.38e-01 | 0.0845 |
| 3964 | LGALS8 | P1T-E | Human | Esophagus | ESCC | 9.72e-08 | 7.47e-01 | 0.0875 |
| 3964 | LGALS8 | P2T-E | Human | Esophagus | ESCC | 3.41e-25 | 3.94e-01 | 0.1177 |
| 3964 | LGALS8 | P4T-E | Human | Esophagus | ESCC | 2.60e-03 | 1.27e-01 | 0.1323 |
| 3964 | LGALS8 | P5T-E | Human | Esophagus | ESCC | 1.30e-27 | 5.78e-01 | 0.1327 |
| 3964 | LGALS8 | P8T-E | Human | Esophagus | ESCC | 1.14e-33 | 6.56e-01 | 0.0889 |
| 3964 | LGALS8 | P9T-E | Human | Esophagus | ESCC | 2.50e-04 | 1.71e-01 | 0.1131 |
| 3964 | LGALS8 | P10T-E | Human | Esophagus | ESCC | 9.57e-32 | 7.50e-01 | 0.116 |
| 3964 | LGALS8 | P11T-E | Human | Esophagus | ESCC | 4.09e-08 | 5.67e-01 | 0.1426 |
| 3964 | LGALS8 | P12T-E | Human | Esophagus | ESCC | 1.53e-20 | 3.40e-01 | 0.1122 |
| 3964 | LGALS8 | P15T-E | Human | Esophagus | ESCC | 1.37e-27 | 7.07e-01 | 0.1149 |
| 3964 | LGALS8 | P16T-E | Human | Esophagus | ESCC | 5.40e-13 | 2.47e-01 | 0.1153 |
| Page: 1 2 3 4 5 6 |
| Tissue | Expression Dynamics | Abbreviation |
| Esophagus | 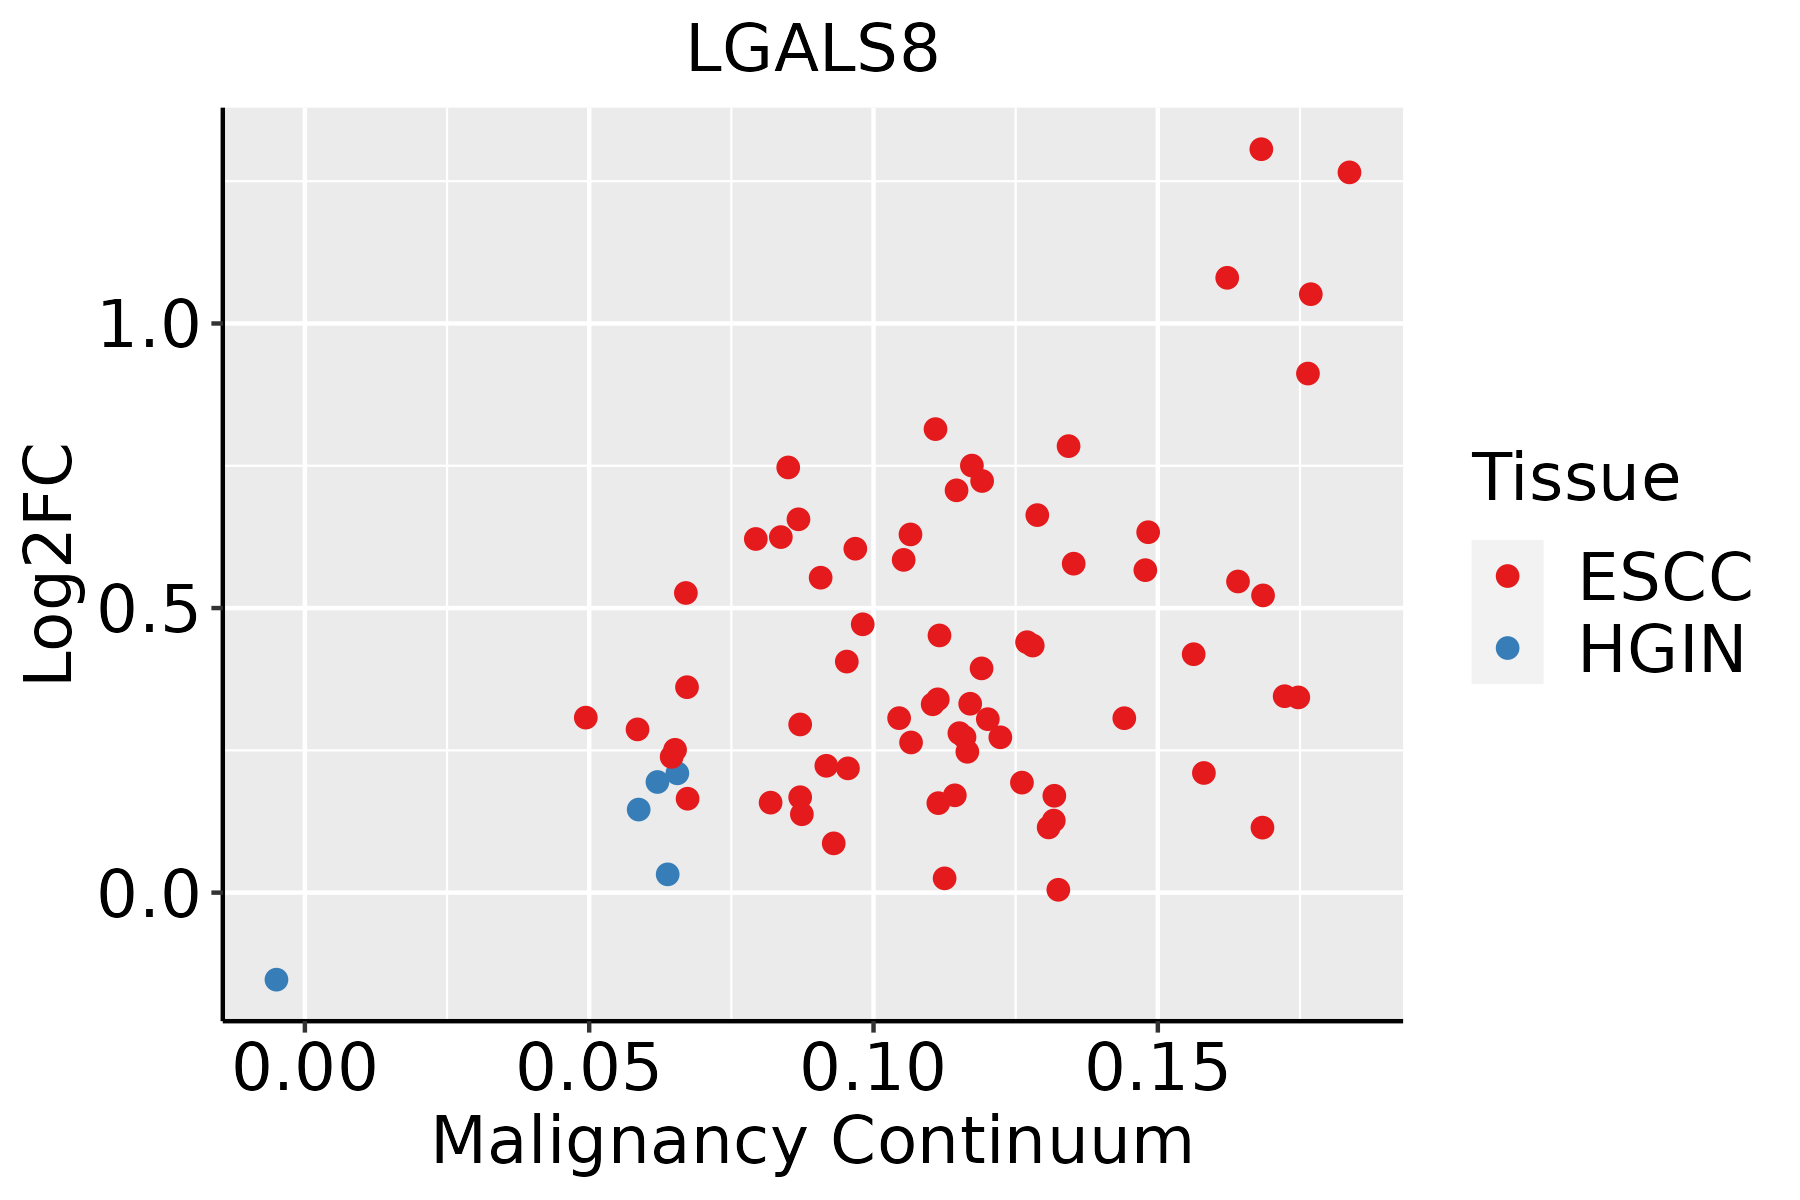 | ESCC: Esophageal squamous cell carcinoma |
| HGIN: High-grade intraepithelial neoplasias | ||
| LGIN: Low-grade intraepithelial neoplasias | ||
| Liver | 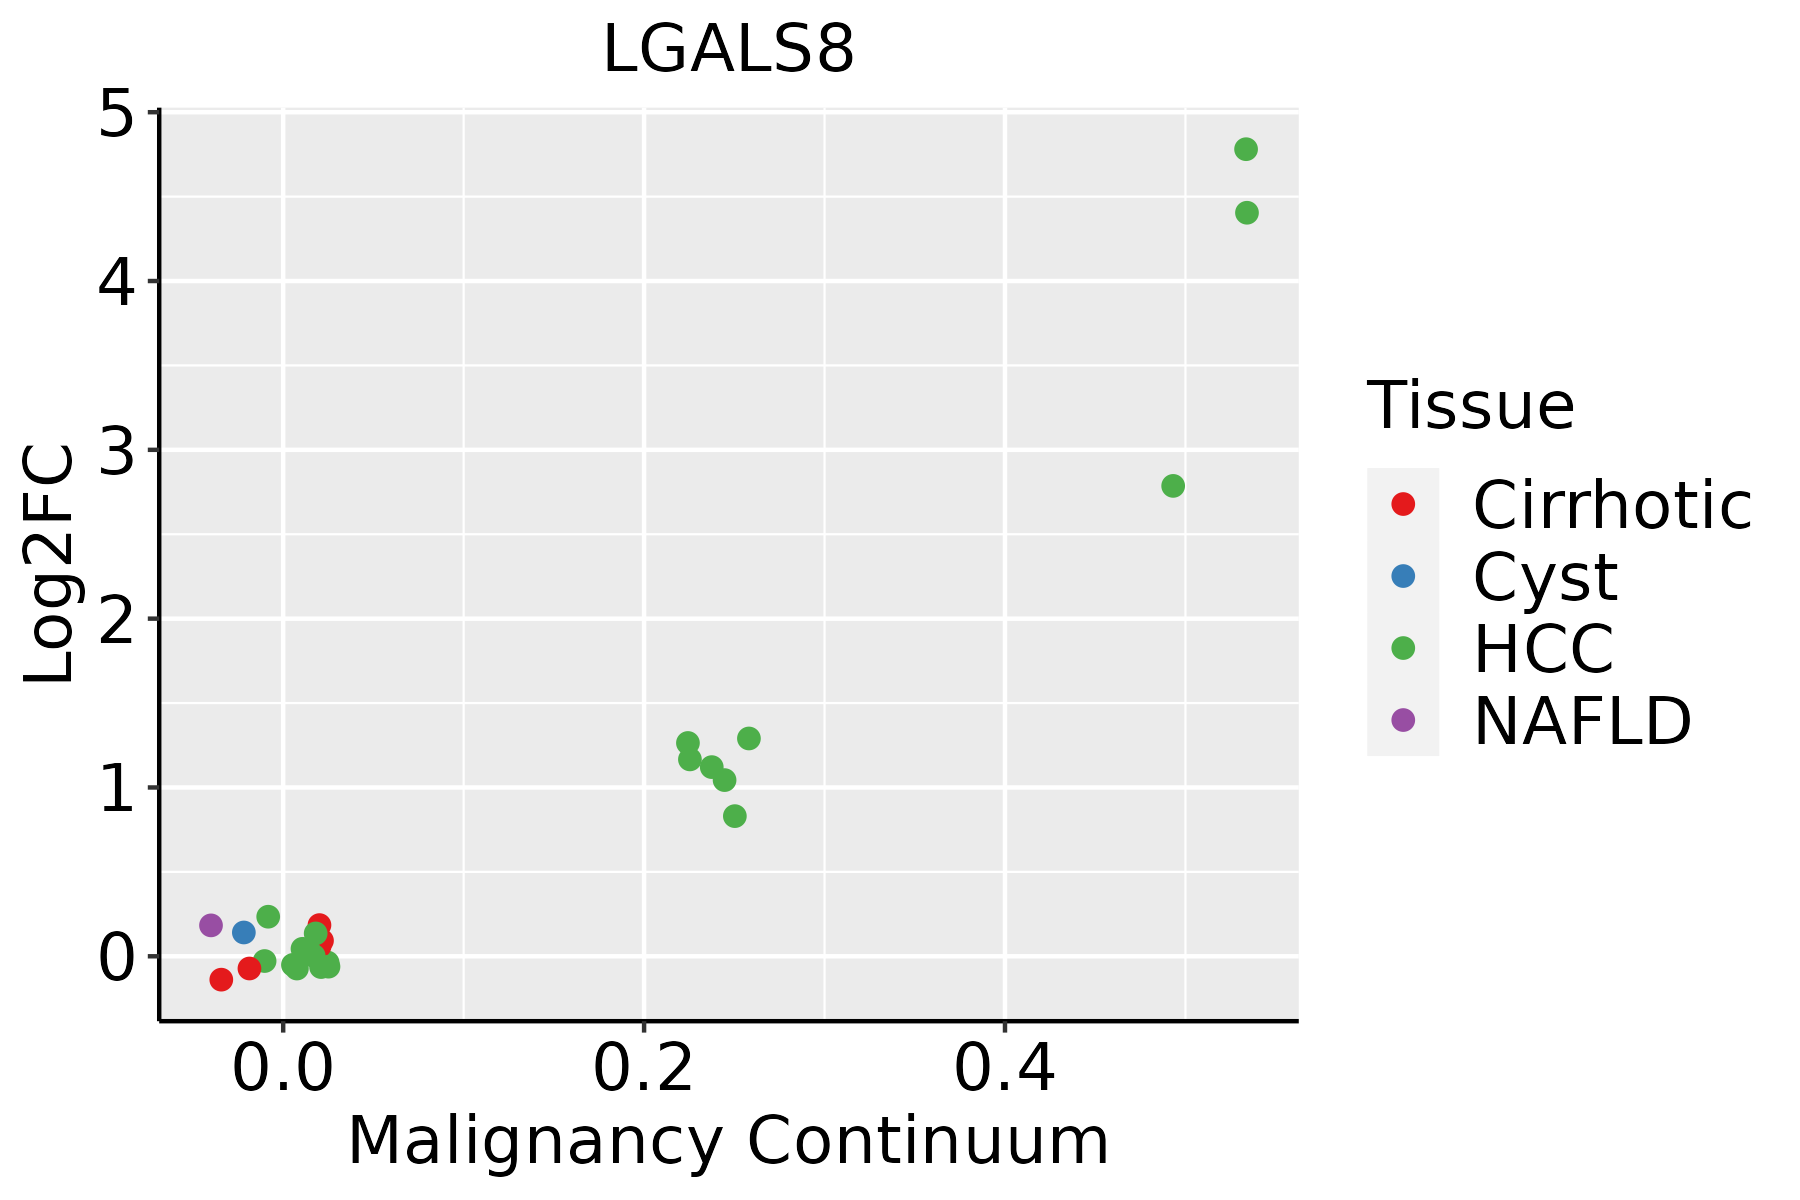 | HCC: Hepatocellular carcinoma |
| NAFLD: Non-alcoholic fatty liver disease | ||
| Oral Cavity | 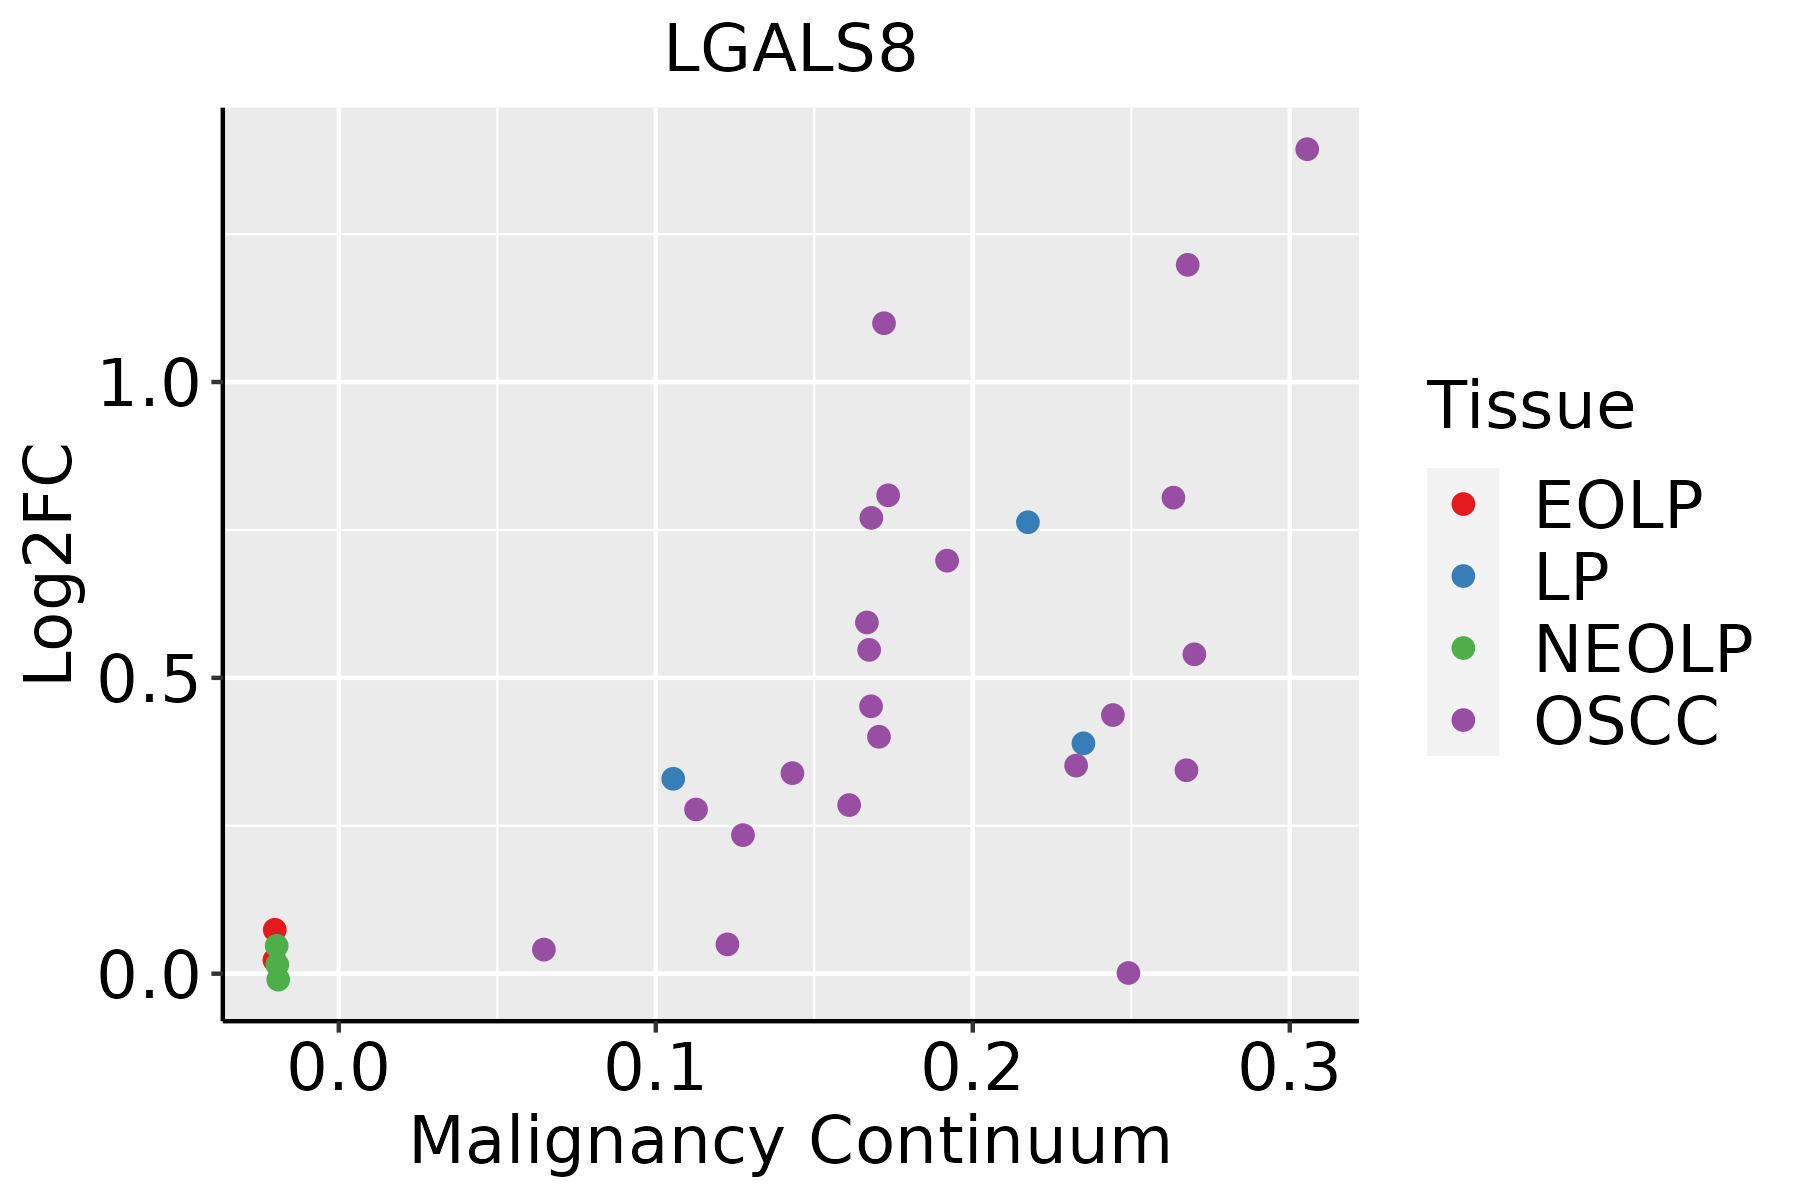 | EOLP: Erosive Oral lichen planus |
| LP: leukoplakia | ||
| NEOLP: Non-erosive oral lichen planus | ||
| OSCC: Oral squamous cell carcinoma | ||
| Prostate | 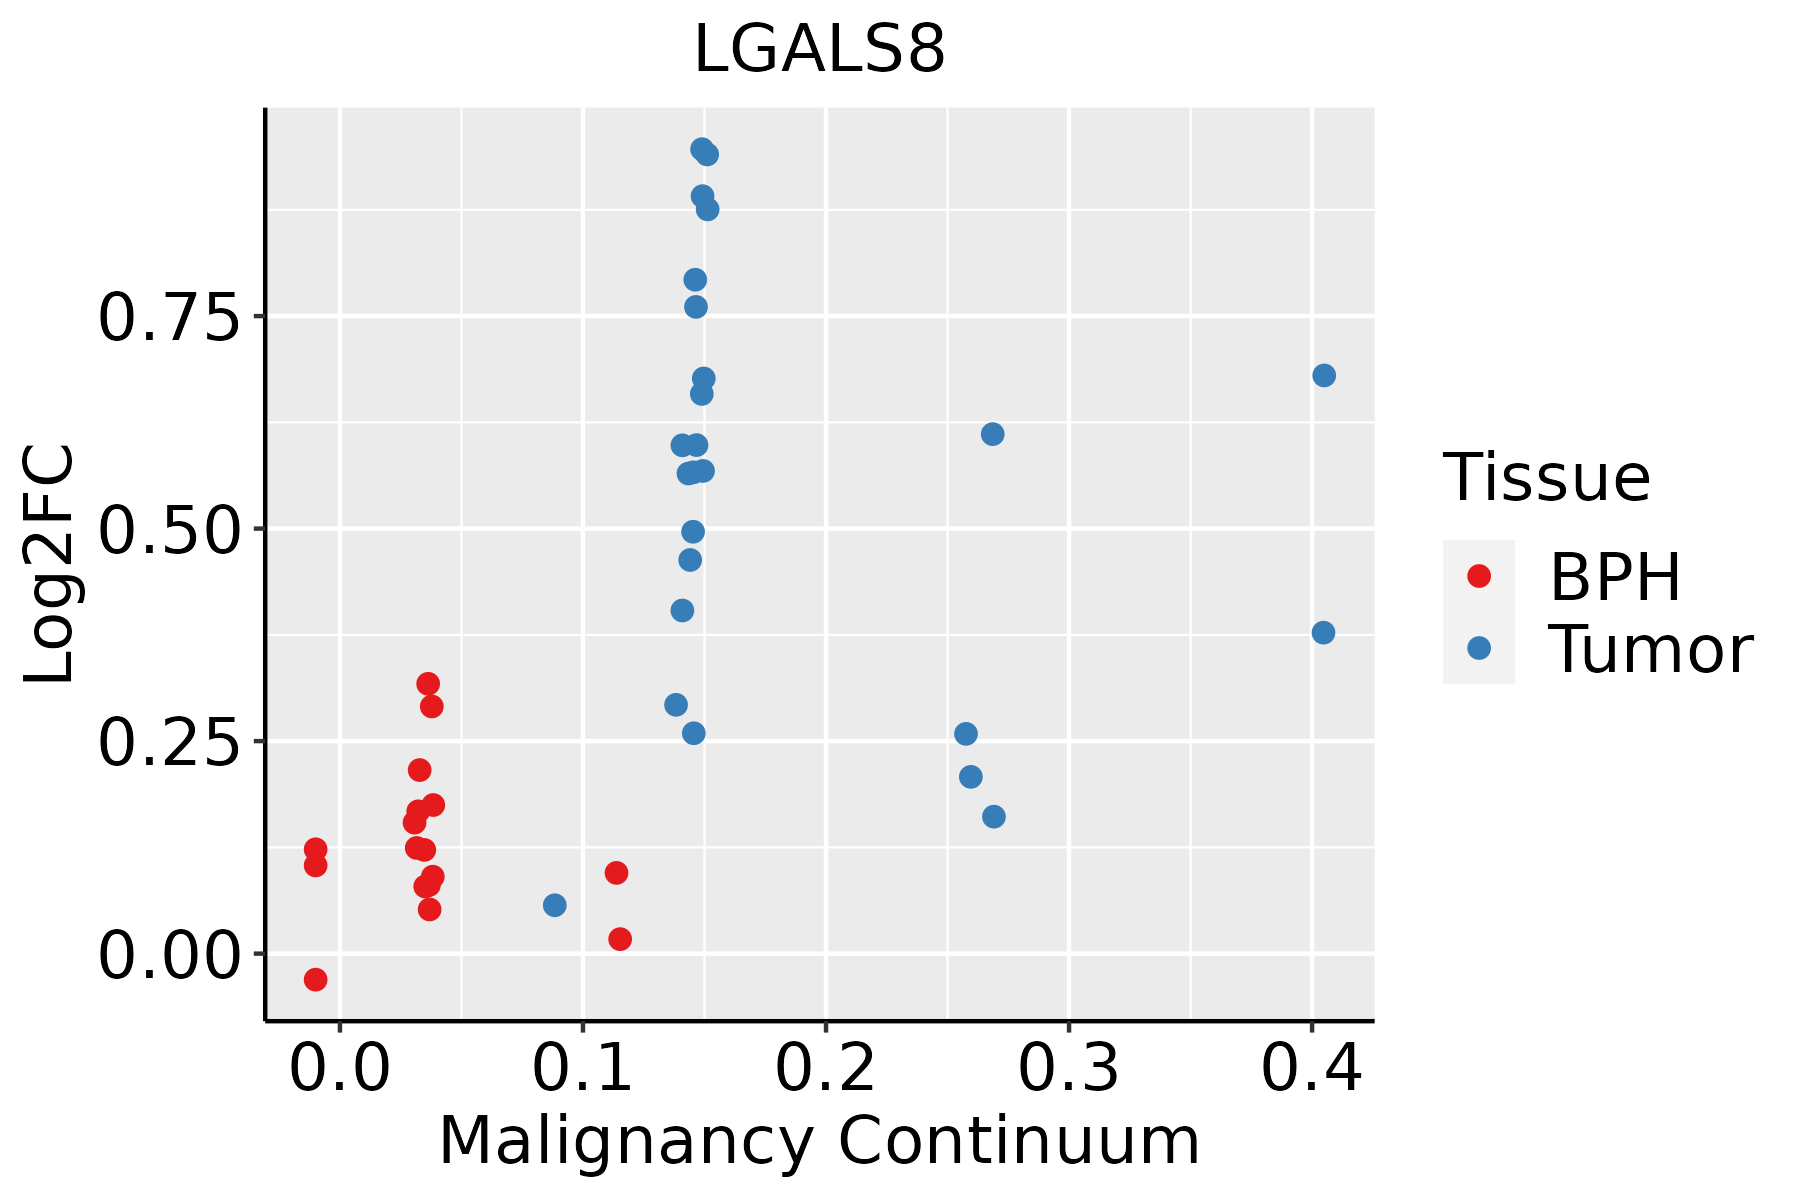 | BPH: Benign Prostatic Hyperplasia |
| ∗log2FC in expression of this searched gene in stem-like cells from each diseased tissue sample relative to stem-like cells in normal samples in each tissue plotted against the malignancy continuum. Samples are colored based on if they are from different disease stage. |
Top |
Malignant transformation related pathway analysis |
| Find out the enriched GO biological processes and KEGG pathways involved in transition from healthy to precancer to cancer |
| Tissue | Disease Stage | Enriched GO biological Processes |
| Colorectum | AD |  |
| Colorectum | SER |  |
| Colorectum | MSS |  |
| Colorectum | MSI-H |  |
| Colorectum | FAP |  |
| ∗Top 15 enriched GO BP terms are showed in the bar plot of each disease state in each tissue. Each row represents a significant GO biological process which is colored according to the -log10(p.adjust). |
| Page: 1 2 3 4 5 6 7 8 9 |
| GO ID | Tissue | Disease Stage | Description | Gene Ratio | Bg Ratio | pvalue | p.adjust | Count |
| GO:001623617 | Esophagus | ESCC | macroautophagy | 216/8552 | 291/18723 | 1.94e-23 | 4.57e-21 | 216 |
| GO:000961518 | Esophagus | ESCC | response to virus | 238/8552 | 367/18723 | 6.65e-14 | 3.32e-12 | 238 |
| GO:006191215 | Esophagus | ESCC | selective autophagy | 47/8552 | 68/18723 | 7.81e-05 | 5.80e-04 | 47 |
| GO:009858613 | Esophagus | ESCC | cellular response to virus | 56/8552 | 84/18723 | 8.20e-05 | 6.01e-04 | 56 |
| GO:000166720 | Esophagus | ESCC | ameboidal-type cell migration | 250/8552 | 475/18723 | 1.22e-03 | 5.97e-03 | 250 |
| GO:001063120 | Esophagus | ESCC | epithelial cell migration | 187/8552 | 357/18723 | 6.05e-03 | 2.23e-02 | 187 |
| GO:009013220 | Esophagus | ESCC | epithelium migration | 188/8552 | 360/18723 | 6.96e-03 | 2.54e-02 | 188 |
| GO:009013020 | Esophagus | ESCC | tissue migration | 190/8552 | 365/18723 | 7.91e-03 | 2.82e-02 | 190 |
| GO:001623611 | Liver | Cirrhotic | macroautophagy | 129/4634 | 291/18723 | 1.75e-13 | 1.41e-11 | 129 |
| GO:00096155 | Liver | Cirrhotic | response to virus | 126/4634 | 367/18723 | 2.10e-05 | 2.77e-04 | 126 |
| GO:00619124 | Liver | Cirrhotic | selective autophagy | 30/4634 | 68/18723 | 3.72e-04 | 3.12e-03 | 30 |
| GO:000166712 | Liver | Cirrhotic | ameboidal-type cell migration | 145/4634 | 475/18723 | 2.23e-03 | 1.36e-02 | 145 |
| GO:00106317 | Liver | Cirrhotic | epithelial cell migration | 110/4634 | 357/18723 | 5.14e-03 | 2.65e-02 | 110 |
| GO:00901327 | Liver | Cirrhotic | epithelium migration | 110/4634 | 360/18723 | 6.79e-03 | 3.35e-02 | 110 |
| GO:00901307 | Liver | Cirrhotic | tissue migration | 111/4634 | 365/18723 | 7.66e-03 | 3.61e-02 | 111 |
| GO:00985862 | Liver | Cirrhotic | cellular response to virus | 31/4634 | 84/18723 | 8.75e-03 | 4.04e-02 | 31 |
| GO:001623621 | Liver | HCC | macroautophagy | 204/7958 | 291/18723 | 8.66e-22 | 1.41e-19 | 204 |
| GO:000961511 | Liver | HCC | response to virus | 210/7958 | 367/18723 | 7.32e-09 | 1.86e-07 | 210 |
| GO:006191211 | Liver | HCC | selective autophagy | 49/7958 | 68/18723 | 7.43e-07 | 1.15e-05 | 49 |
| GO:00985861 | Liver | HCC | cellular response to virus | 57/7958 | 84/18723 | 2.30e-06 | 3.11e-05 | 57 |
| Page: 1 2 3 |
| Pathway ID | Tissue | Disease Stage | Description | Gene Ratio | Bg Ratio | pvalue | p.adjust | qvalue | Count |
| Page: 1 |
Top |
Cell-cell communication analysis |
| Identification of potential cell-cell interactions between two cell types and their ligand-receptor pairs for different disease states |
| Ligand | Receptor | LRpair | Pathway | Tissue | Disease Stage |
| Page: 1 |
Top |
Single-cell gene regulatory network inference analysis |
| Find out the significant the regulons (TFs) and the target genes of each regulon across cell types for different disease states |
| TF | Cell Type | Tissue | Disease Stage | Target Gene | RSS | Regulon Activity |
| ∗The dot plots of a searched regulon are shown for all cell subpopulations in each disease state of each tissue based on the regulon specific score inferred using pySCENIC and by calculating the average expression. |
| Page: 1 |
Top |
Somatic mutation of malignant transformation related genes |
| Annotation of somatic variants for genes involved in malignant transformation |
| Hugo Symbol | Variant Class | Variant Classification | dbSNP RS | HGVSc | HGVSp | HGVSp Short | SWISSPROT | BIOTYPE | SIFT | PolyPhen | Tumor Sample Barcode | Tissue | Histology | Sex | Age | Stage | Therapy Types | Drugs | Outcome |
| LGALS8 | SNV | Missense_Mutation | novel | c.496G>A | p.Glu166Lys | p.E166K | O00214 | protein_coding | tolerated(0.6) | benign(0.017) | TCGA-AN-A046-01 | Breast | breast invasive carcinoma | Female | >=65 | I/II | Unknown | Unknown | SD |
| LGALS8 | deletion | In_Frame_Del | rs774404492 | c.740_742delGAG | p.Gly247del | p.G247del | O00214 | protein_coding | TCGA-E2-A14T-01 | Breast | breast invasive carcinoma | Female | <65 | I/II | Chemotherapy | doxorubicin | SD | ||
| LGALS8 | SNV | Missense_Mutation | c.176G>A | p.Arg59Gln | p.R59Q | O00214 | protein_coding | deleterious(0) | probably_damaging(0.996) | TCGA-2W-A8YY-01 | Cervix | cervical & endocervical cancer | Female | <65 | I/II | Chemotherapy | cisplatin | CR | |
| LGALS8 | SNV | Missense_Mutation | c.370N>G | p.Leu124Val | p.L124V | O00214 | protein_coding | deleterious(0.01) | possibly_damaging(0.607) | TCGA-EK-A2RJ-01 | Cervix | cervical & endocervical cancer | Female | <65 | I/II | Unknown | Unknown | SD | |
| LGALS8 | SNV | Missense_Mutation | c.176N>A | p.Arg59Gln | p.R59Q | O00214 | protein_coding | deleterious(0) | probably_damaging(0.996) | TCGA-VS-A94Z-01 | Cervix | cervical & endocervical cancer | Female | <65 | I/II | Chemotherapy | cisplatin | CR | |
| LGALS8 | SNV | Missense_Mutation | novel | c.383A>G | p.His128Arg | p.H128R | O00214 | protein_coding | deleterious(0.01) | benign(0.222) | TCGA-A6-5665-01 | Colorectum | colon adenocarcinoma | Female | >=65 | I/II | Unknown | Unknown | PD |
| LGALS8 | SNV | Missense_Mutation | rs555456164 | c.733N>A | p.Val245Ile | p.V245I | O00214 | protein_coding | tolerated(1) | benign(0.007) | TCGA-AA-3672-01 | Colorectum | colon adenocarcinoma | Female | >=65 | III/IV | Unknown | Unknown | SD |
| LGALS8 | SNV | Missense_Mutation | c.653N>T | p.Pro218Leu | p.P218L | O00214 | protein_coding | tolerated(0.38) | benign(0) | TCGA-AA-3811-01 | Colorectum | colon adenocarcinoma | Female | >=65 | III/IV | Unknown | Unknown | PD | |
| LGALS8 | SNV | Missense_Mutation | c.176G>A | p.Arg59Gln | p.R59Q | O00214 | protein_coding | deleterious(0) | probably_damaging(0.996) | TCGA-AA-A00N-01 | Colorectum | colon adenocarcinoma | Male | >=65 | I/II | Unknown | Unknown | PD | |
| LGALS8 | SNV | Missense_Mutation | rs776873036 | c.931A>G | p.Met311Val | p.M311V | O00214 | protein_coding | tolerated(0.11) | benign(0.131) | TCGA-AG-A002-01 | Colorectum | rectum adenocarcinoma | Male | <65 | I/II | Unknown | Unknown | SD |
| Page: 1 2 3 4 5 |
Top |
Related drugs of malignant transformation related genes |
| Identification of chemicals and drugs interact with genes involved in malignant transfromation |
| (DGIdb 4.0) |
| Entrez ID | Symbol | Category | Interaction Types | Drug Claim Name | Drug Name | PMIDs |
| 3964 | LGALS8 | DRUGGABLE GENOME | LACTOSE, ANHYDROUS | LACTOSE, ANHYDROUS | 21524586 |
| Page: 1 |

Copyright 2023-Present -The University of Texas Health Science Center at Houston |