
|
|||||
|
 | |
| |
| |
| |
| |
| |
|
Gene: LGALS7 |
Gene summary for LGALS7 |
| Gene information | Species | Human | Gene symbol | LGALS7 | Gene ID | 3963 |
| Gene name | galectin 7 | |
| Gene Alias | GAL7 | |
| Cytomap | 19q13.2 | |
| Gene Type | protein-coding | GO ID | NA | UniProtAcc | P47929 |
Top |
Malignant transformation analysis |
| Identification of the aberrant gene expression in precancerous and cancerous lesions by comparing the gene expression of stem-like cells in diseased tissues with normal stem cells |
| Entrez ID | Symbol | Replicates | Species | Organ | Tissue | Adj P-value | Log2FC | Malignancy |
| 3963 | LGALS7 | CA_HPV_1 | Human | Cervix | CC | 1.91e-09 | -2.73e-01 | 0.0264 |
| 3963 | LGALS7 | CA_HPV_3 | Human | Cervix | CC | 4.16e-05 | -2.47e-01 | 0.0414 |
| 3963 | LGALS7 | HSIL_HPV_1 | Human | Cervix | HSIL_HPV | 7.11e-03 | -1.53e-01 | 0.0116 |
| 3963 | LGALS7 | CCII_1 | Human | Cervix | CC | 8.34e-03 | -2.73e-01 | 0.3249 |
| 3963 | LGALS7 | Tumor | Human | Cervix | CC | 5.89e-19 | 5.98e-01 | 0.1241 |
| 3963 | LGALS7 | sample3 | Human | Cervix | CC | 2.85e-11 | 3.77e-01 | 0.1387 |
| 3963 | LGALS7 | H2 | Human | Cervix | HSIL_HPV | 5.96e-05 | -2.32e-01 | 0.0632 |
| 3963 | LGALS7 | L1 | Human | Cervix | CC | 1.39e-23 | 9.87e-01 | 0.0802 |
| 3963 | LGALS7 | T3 | Human | Cervix | CC | 6.20e-12 | 3.96e-01 | 0.1389 |
| 3963 | LGALS7 | LZE4T | Human | Esophagus | ESCC | 7.27e-04 | -2.24e-01 | 0.0811 |
| 3963 | LGALS7 | LZE20T | Human | Esophagus | ESCC | 2.38e-09 | 1.52e+00 | 0.0662 |
| 3963 | LGALS7 | LZE22T | Human | Esophagus | ESCC | 1.49e-06 | 1.24e+00 | 0.068 |
| 3963 | LGALS7 | LZE24T | Human | Esophagus | ESCC | 5.89e-06 | 8.08e-01 | 0.0596 |
| 3963 | LGALS7 | LZE21T | Human | Esophagus | ESCC | 3.28e-09 | 3.29e+00 | 0.0655 |
| 3963 | LGALS7 | P1T-E | Human | Esophagus | ESCC | 1.78e-07 | 1.40e+00 | 0.0875 |
| 3963 | LGALS7 | P4T-E | Human | Esophagus | ESCC | 1.62e-19 | 1.19e+00 | 0.1323 |
| 3963 | LGALS7 | P5T-E | Human | Esophagus | ESCC | 2.95e-50 | 1.83e+00 | 0.1327 |
| 3963 | LGALS7 | P9T-E | Human | Esophagus | ESCC | 1.42e-42 | 2.34e+00 | 0.1131 |
| 3963 | LGALS7 | P10T-E | Human | Esophagus | ESCC | 4.57e-13 | 9.55e-01 | 0.116 |
| 3963 | LGALS7 | P11T-E | Human | Esophagus | ESCC | 1.56e-07 | 3.12e+00 | 0.1426 |
| Page: 1 2 3 4 5 |
| Tissue | Expression Dynamics | Abbreviation |
| Cervix | 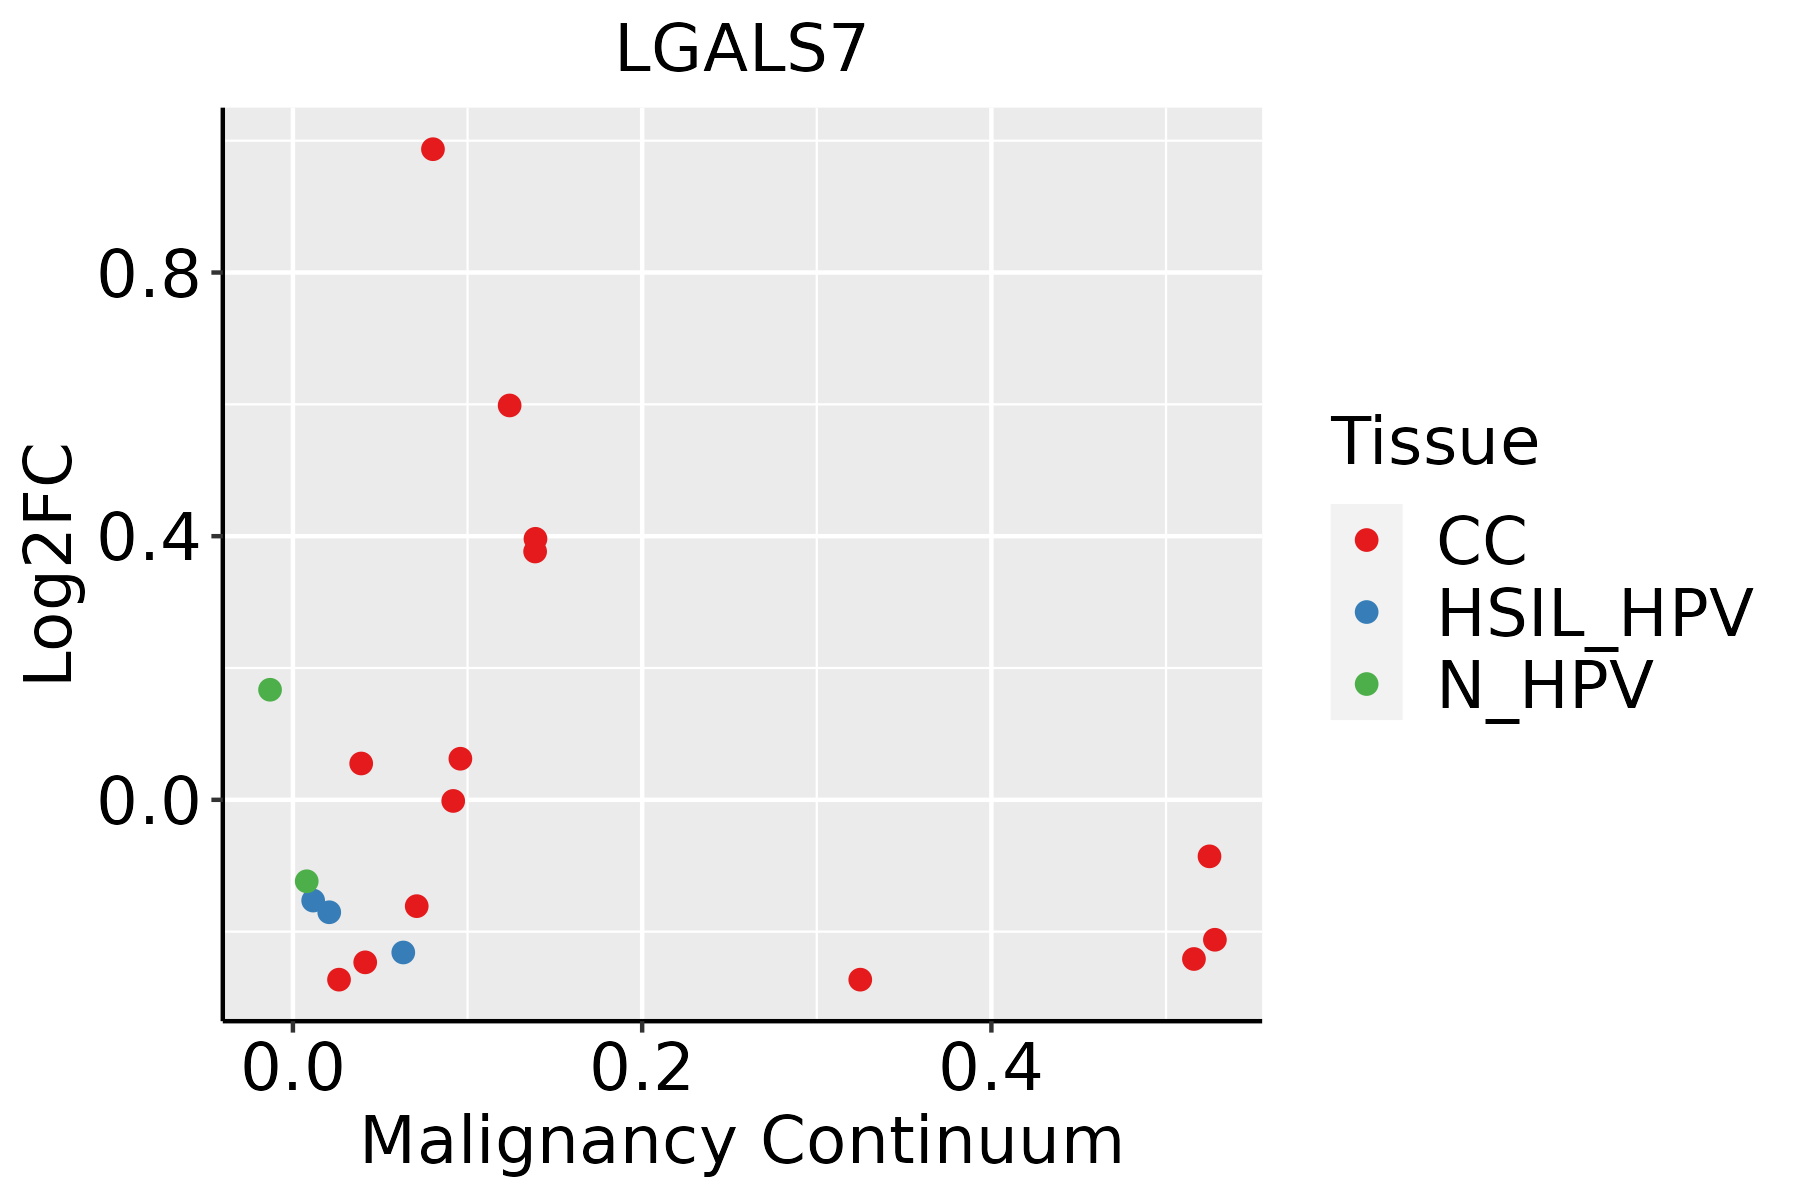 | CC: Cervix cancer |
| HSIL_HPV: HPV-infected high-grade squamous intraepithelial lesions | ||
| N_HPV: HPV-infected normal cervix | ||
| Esophagus |  | ESCC: Esophageal squamous cell carcinoma |
| HGIN: High-grade intraepithelial neoplasias | ||
| LGIN: Low-grade intraepithelial neoplasias | ||
| Oral Cavity | 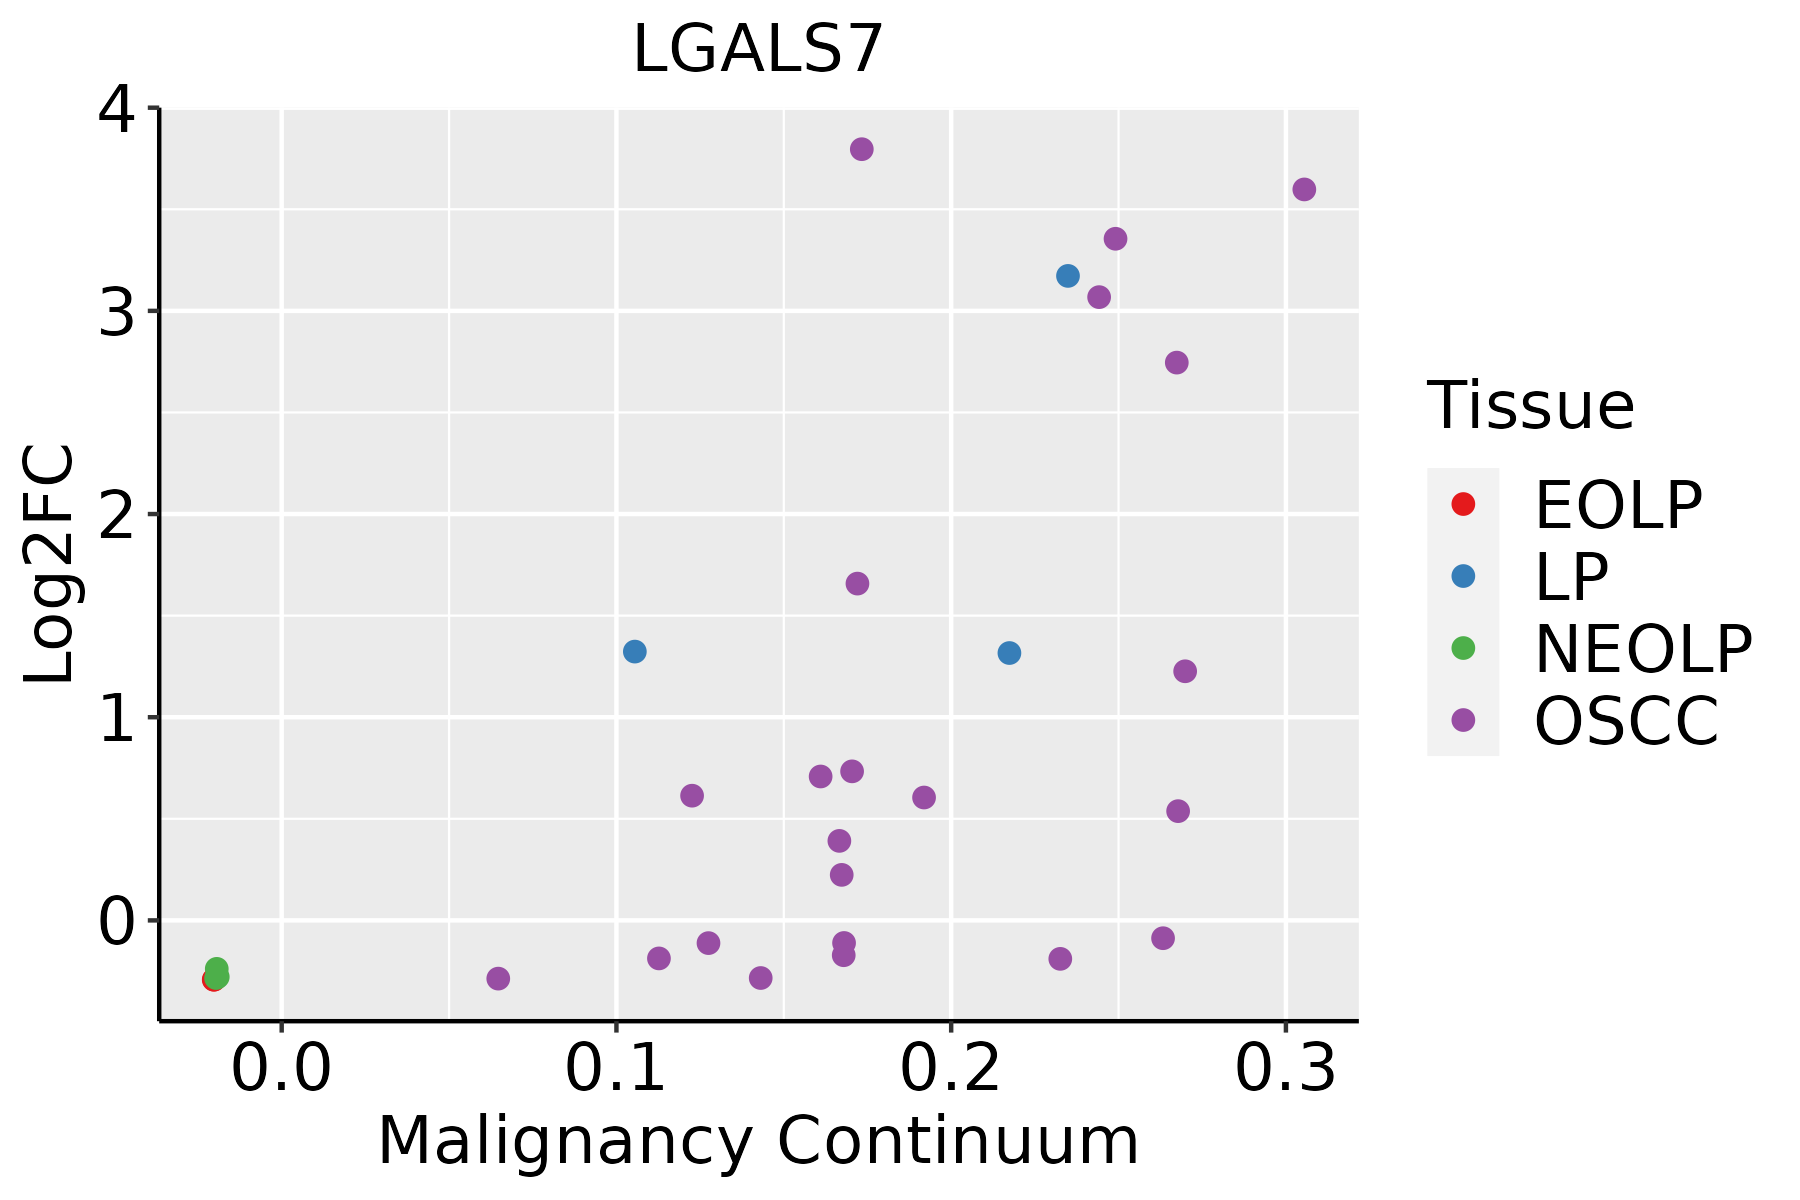 | EOLP: Erosive Oral lichen planus |
| LP: leukoplakia | ||
| NEOLP: Non-erosive oral lichen planus | ||
| OSCC: Oral squamous cell carcinoma | ||
| Skin | 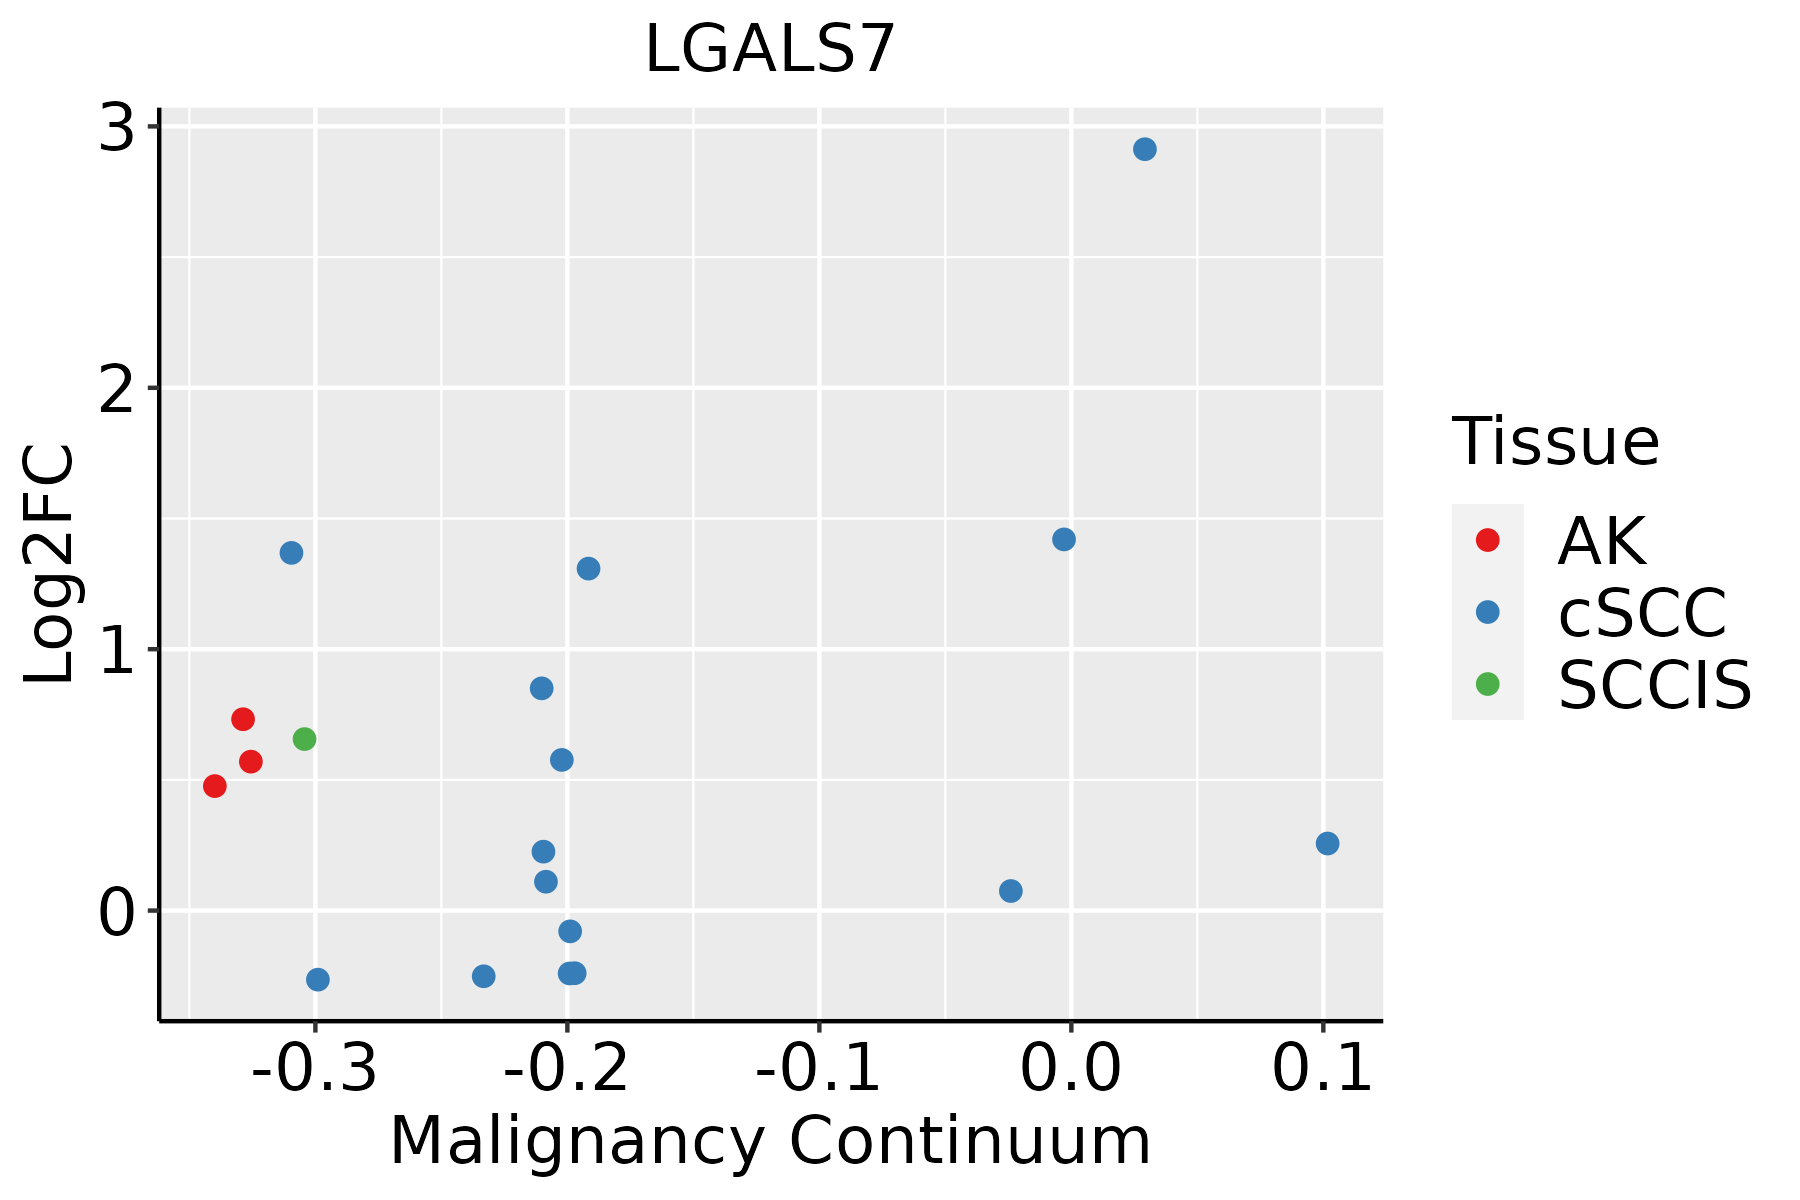 | AK: Actinic keratosis |
| cSCC: Cutaneous squamous cell carcinoma | ||
| SCCIS:squamous cell carcinoma in situ |
| ∗log2FC in expression of this searched gene in stem-like cells from each diseased tissue sample relative to stem-like cells in normal samples in each tissue plotted against the malignancy continuum. Samples are colored based on if they are from different disease stage. |
Top |
Malignant transformation related pathway analysis |
| Find out the enriched GO biological processes and KEGG pathways involved in transition from healthy to precancer to cancer |
| Tissue | Disease Stage | Enriched GO biological Processes |
| Colorectum | AD |  |
| Colorectum | SER |  |
| Colorectum | MSS |  |
| Colorectum | MSI-H |  |
| Colorectum | FAP |  |
| ∗Top 15 enriched GO BP terms are showed in the bar plot of each disease state in each tissue. Each row represents a significant GO biological process which is colored according to the -log10(p.adjust). |
| Page: 1 2 3 4 5 6 7 8 9 |
| GO ID | Tissue | Disease Stage | Description | Gene Ratio | Bg Ratio | pvalue | p.adjust | Count |
| GO:002240710 | Cervix | CC | regulation of cell-cell adhesion | 103/2311 | 448/18723 | 1.78e-10 | 2.87e-08 | 103 |
| GO:00421108 | Cervix | CC | T cell activation | 107/2311 | 487/18723 | 1.24e-09 | 1.46e-07 | 107 |
| GO:00508638 | Cervix | CC | regulation of T cell activation | 80/2311 | 329/18723 | 1.28e-09 | 1.47e-07 | 80 |
| GO:00071598 | Cervix | CC | leukocyte cell-cell adhesion | 85/2311 | 371/18723 | 8.27e-09 | 7.07e-07 | 85 |
| GO:00071626 | Cervix | CC | negative regulation of cell adhesion | 72/2311 | 303/18723 | 2.36e-08 | 1.70e-06 | 72 |
| GO:00026837 | Cervix | CC | negative regulation of immune system process | 94/2311 | 434/18723 | 2.63e-08 | 1.87e-06 | 94 |
| GO:19030378 | Cervix | CC | regulation of leukocyte cell-cell adhesion | 77/2311 | 336/18723 | 4.08e-08 | 2.54e-06 | 77 |
| GO:00420988 | Cervix | CC | T cell proliferation | 49/2311 | 199/18723 | 1.32e-06 | 4.49e-05 | 49 |
| GO:00224084 | Cervix | CC | negative regulation of cell-cell adhesion | 48/2311 | 196/18723 | 1.99e-06 | 6.18e-05 | 48 |
| GO:00421297 | Cervix | CC | regulation of T cell proliferation | 43/2311 | 171/18723 | 3.21e-06 | 8.77e-05 | 43 |
| GO:00706637 | Cervix | CC | regulation of leukocyte proliferation | 55/2311 | 245/18723 | 6.51e-06 | 1.56e-04 | 55 |
| GO:00506705 | Cervix | CC | regulation of lymphocyte proliferation | 51/2311 | 225/18723 | 1.05e-05 | 2.32e-04 | 51 |
| GO:0051250 | Cervix | CC | negative regulation of lymphocyte activation | 39/2311 | 157/18723 | 1.23e-05 | 2.57e-04 | 39 |
| GO:00329444 | Cervix | CC | regulation of mononuclear cell proliferation | 51/2311 | 227/18723 | 1.36e-05 | 2.73e-04 | 51 |
| GO:00706617 | Cervix | CC | leukocyte proliferation | 65/2311 | 318/18723 | 2.56e-05 | 4.32e-04 | 65 |
| GO:0002695 | Cervix | CC | negative regulation of leukocyte activation | 43/2311 | 187/18723 | 3.47e-05 | 5.60e-04 | 43 |
| GO:00466516 | Cervix | CC | lymphocyte proliferation | 59/2311 | 288/18723 | 5.53e-05 | 8.10e-04 | 59 |
| GO:0050868 | Cervix | CC | negative regulation of T cell activation | 31/2311 | 122/18723 | 5.81e-05 | 8.46e-04 | 31 |
| GO:00329435 | Cervix | CC | mononuclear cell proliferation | 59/2311 | 291/18723 | 7.51e-05 | 1.03e-03 | 59 |
| GO:1903038 | Cervix | CC | negative regulation of leukocyte cell-cell adhesion | 33/2311 | 141/18723 | 1.90e-04 | 2.21e-03 | 33 |
| Page: 1 2 3 4 5 6 7 8 9 |
| Pathway ID | Tissue | Disease Stage | Description | Gene Ratio | Bg Ratio | pvalue | p.adjust | qvalue | Count |
| Page: 1 |
Top |
Cell-cell communication analysis |
| Identification of potential cell-cell interactions between two cell types and their ligand-receptor pairs for different disease states |
| Ligand | Receptor | LRpair | Pathway | Tissue | Disease Stage |
| Page: 1 |
Top |
Single-cell gene regulatory network inference analysis |
| Find out the significant the regulons (TFs) and the target genes of each regulon across cell types for different disease states |
| TF | Cell Type | Tissue | Disease Stage | Target Gene | RSS | Regulon Activity |
| ∗The dot plots of a searched regulon are shown for all cell subpopulations in each disease state of each tissue based on the regulon specific score inferred using pySCENIC and by calculating the average expression. |
| Page: 1 |
Top |
Somatic mutation of malignant transformation related genes |
| Annotation of somatic variants for genes involved in malignant transformation |
| Hugo Symbol | Variant Class | Variant Classification | dbSNP RS | HGVSc | HGVSp | HGVSp Short | SWISSPROT | BIOTYPE | SIFT | PolyPhen | Tumor Sample Barcode | Tissue | Histology | Sex | Age | Stage | Therapy Types | Drugs | Outcome |
| LGALS7 | SNV | Missense_Mutation | novel | c.215N>A | p.Arg72His | p.R72H | P47929 | protein_coding | tolerated(0.16) | benign(0.009) | TCGA-CM-6162-01 | Colorectum | colon adenocarcinoma | Female | <65 | III/IV | Chemotherapy | oxaliplatin | SD |
| LGALS7 | SNV | Missense_Mutation | novel | c.96N>C | p.Arg32Ser | p.R32S | P47929 | protein_coding | tolerated(0.05) | possibly_damaging(0.476) | TCGA-DD-A1EL-01 | Liver | liver hepatocellular carcinoma | Male | <65 | I/II | Unknown | Unknown | PD |
| LGALS7 | SNV | Missense_Mutation | novel | c.235N>T | p.Val79Phe | p.V79F | P47929 | protein_coding | tolerated(0.17) | benign(0.158) | TCGA-K7-A6G5-01 | Liver | liver hepatocellular carcinoma | Male | >=65 | I/II | Unknown | Unknown | SD |
| Page: 1 |
Top |
Related drugs of malignant transformation related genes |
| Identification of chemicals and drugs interact with genes involved in malignant transfromation |
| (DGIdb 4.0) |
| Entrez ID | Symbol | Category | Interaction Types | Drug Claim Name | Drug Name | PMIDs |
| Page: 1 |

Copyright 2023-Present -The University of Texas Health Science Center at Houston |