
|
|||||
|
 | |
| |
| |
| |
| |
| |
|
Gene: LGALS3BP |
Gene summary for LGALS3BP |
| Gene information | Species | Human | Gene symbol | LGALS3BP | Gene ID | 3959 |
| Gene name | galectin 3 binding protein | |
| Gene Alias | 90K | |
| Cytomap | 17q25.3 | |
| Gene Type | protein-coding | GO ID | GO:0006810 | UniProtAcc | A0A0S2Z3Y1 |
Top |
Malignant transformation analysis |
| Identification of the aberrant gene expression in precancerous and cancerous lesions by comparing the gene expression of stem-like cells in diseased tissues with normal stem cells |
| Entrez ID | Symbol | Replicates | Species | Organ | Tissue | Adj P-value | Log2FC | Malignancy |
| 3959 | LGALS3BP | GSM4909281 | Human | Breast | IDC | 1.44e-23 | 5.98e-01 | 0.21 |
| 3959 | LGALS3BP | GSM4909285 | Human | Breast | IDC | 1.23e-02 | -2.09e-01 | 0.21 |
| 3959 | LGALS3BP | GSM4909287 | Human | Breast | IDC | 6.60e-15 | 5.03e-01 | 0.2057 |
| 3959 | LGALS3BP | GSM4909290 | Human | Breast | IDC | 6.01e-09 | 4.00e-01 | 0.2096 |
| 3959 | LGALS3BP | GSM4909291 | Human | Breast | IDC | 1.42e-07 | 3.77e-01 | 0.1753 |
| 3959 | LGALS3BP | GSM4909296 | Human | Breast | IDC | 2.51e-06 | -2.39e-01 | 0.1524 |
| 3959 | LGALS3BP | GSM4909297 | Human | Breast | IDC | 4.55e-06 | 1.81e-01 | 0.1517 |
| 3959 | LGALS3BP | GSM4909304 | Human | Breast | IDC | 6.13e-06 | -2.44e-01 | 0.1636 |
| 3959 | LGALS3BP | GSM4909305 | Human | Breast | IDC | 2.98e-02 | 2.33e-01 | 0.0436 |
| 3959 | LGALS3BP | GSM4909308 | Human | Breast | IDC | 9.33e-15 | 4.40e-01 | 0.158 |
| 3959 | LGALS3BP | GSM4909309 | Human | Breast | IDC | 2.66e-02 | 1.75e-01 | 0.0483 |
| 3959 | LGALS3BP | GSM4909311 | Human | Breast | IDC | 1.63e-07 | -1.66e-01 | 0.1534 |
| 3959 | LGALS3BP | GSM4909312 | Human | Breast | IDC | 1.75e-09 | -2.56e-01 | 0.1552 |
| 3959 | LGALS3BP | GSM4909315 | Human | Breast | IDC | 5.30e-03 | -2.39e-01 | 0.21 |
| 3959 | LGALS3BP | GSM4909317 | Human | Breast | IDC | 6.66e-27 | 6.40e-01 | 0.1355 |
| 3959 | LGALS3BP | GSM4909318 | Human | Breast | IDC | 3.67e-02 | 3.96e-01 | 0.2031 |
| 3959 | LGALS3BP | GSM4909319 | Human | Breast | IDC | 1.77e-16 | 1.68e-01 | 0.1563 |
| 3959 | LGALS3BP | GSM4909321 | Human | Breast | IDC | 6.23e-27 | 7.07e-01 | 0.1559 |
| 3959 | LGALS3BP | brca2 | Human | Breast | Precancer | 1.69e-04 | 2.25e-01 | -0.024 |
| 3959 | LGALS3BP | M1 | Human | Breast | IDC | 5.33e-06 | 3.56e-01 | 0.1577 |
| Page: 1 2 3 4 5 6 7 8 9 10 11 12 13 14 15 |
| Tissue | Expression Dynamics | Abbreviation |
| Breast | 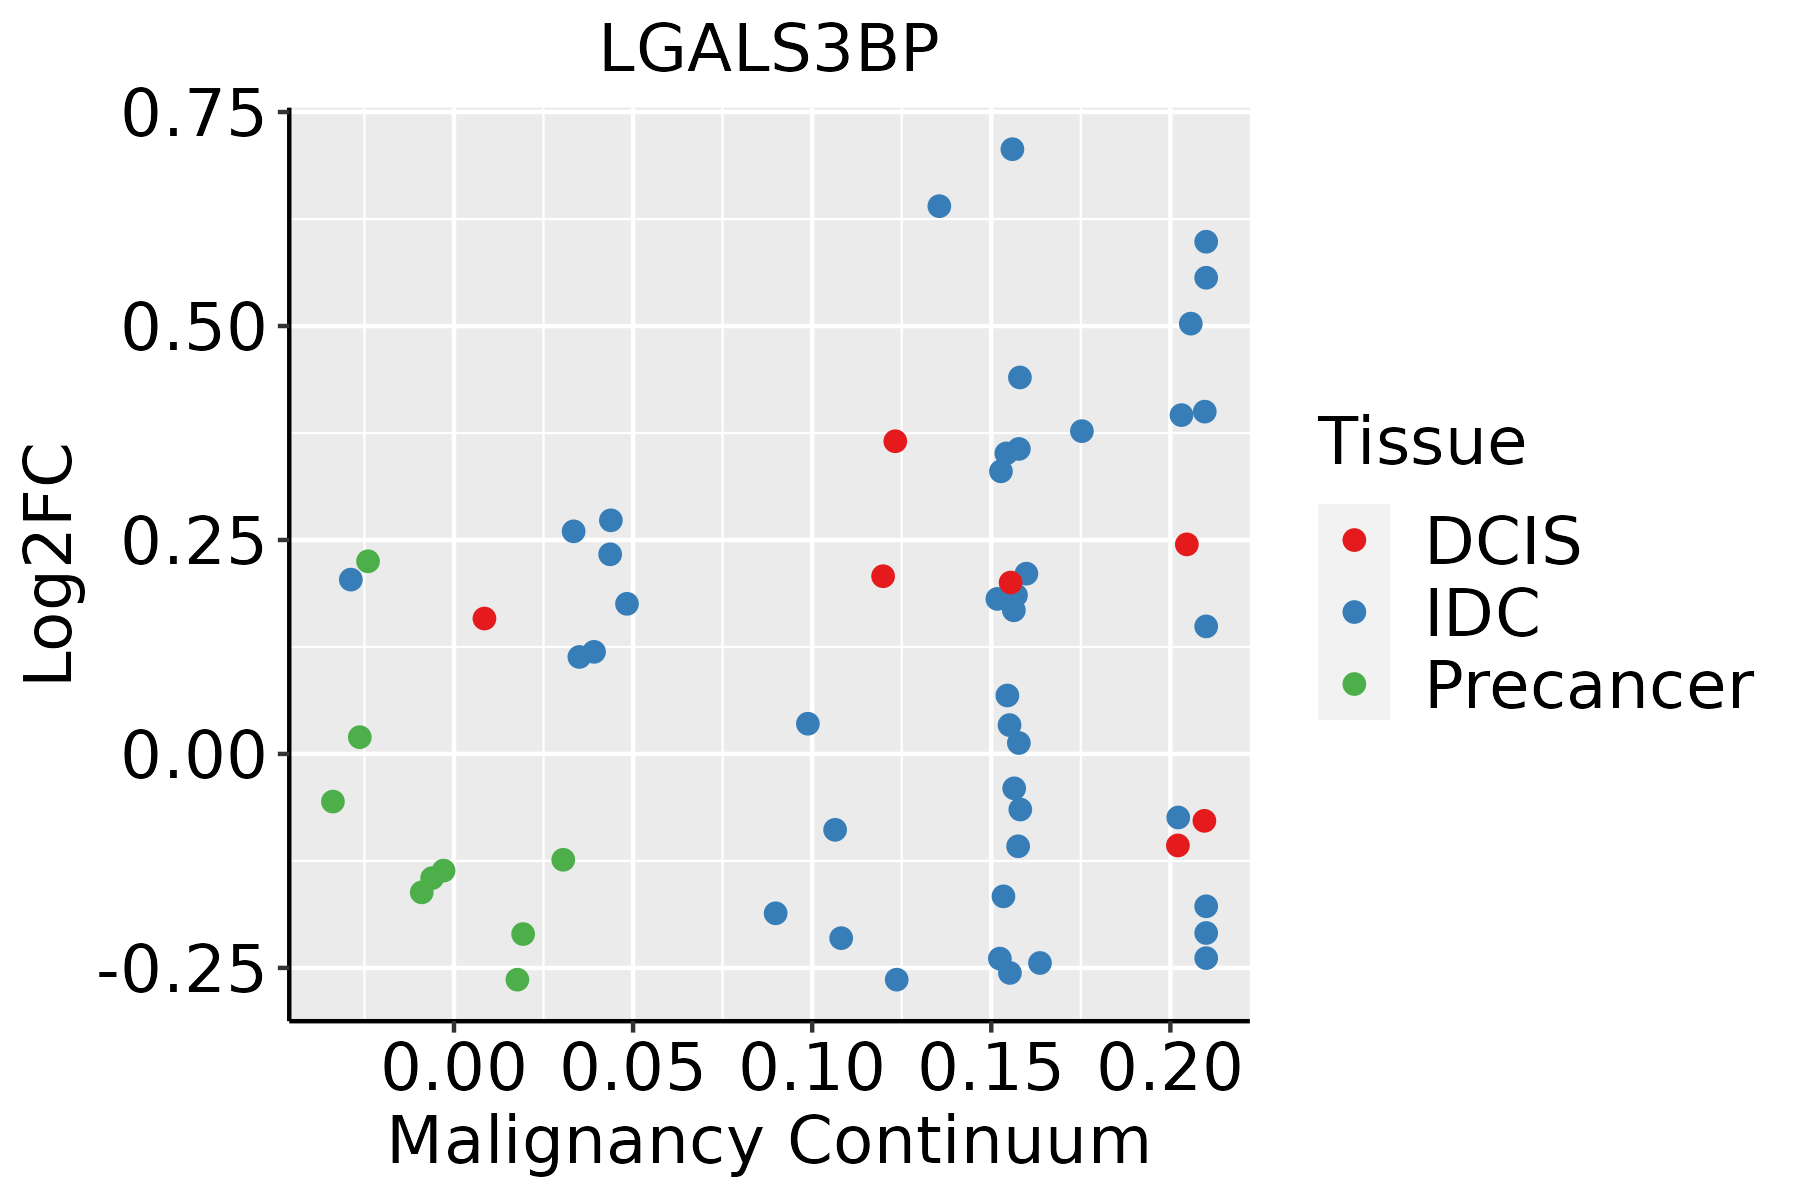 | IDC: Invasive ductal carcinoma |
| DCIS: Ductal carcinoma in situ | ||
| Precancer(BRCA1-mut): Precancerous lesion from BRCA1 mutation carriers | ||
| Cervix | 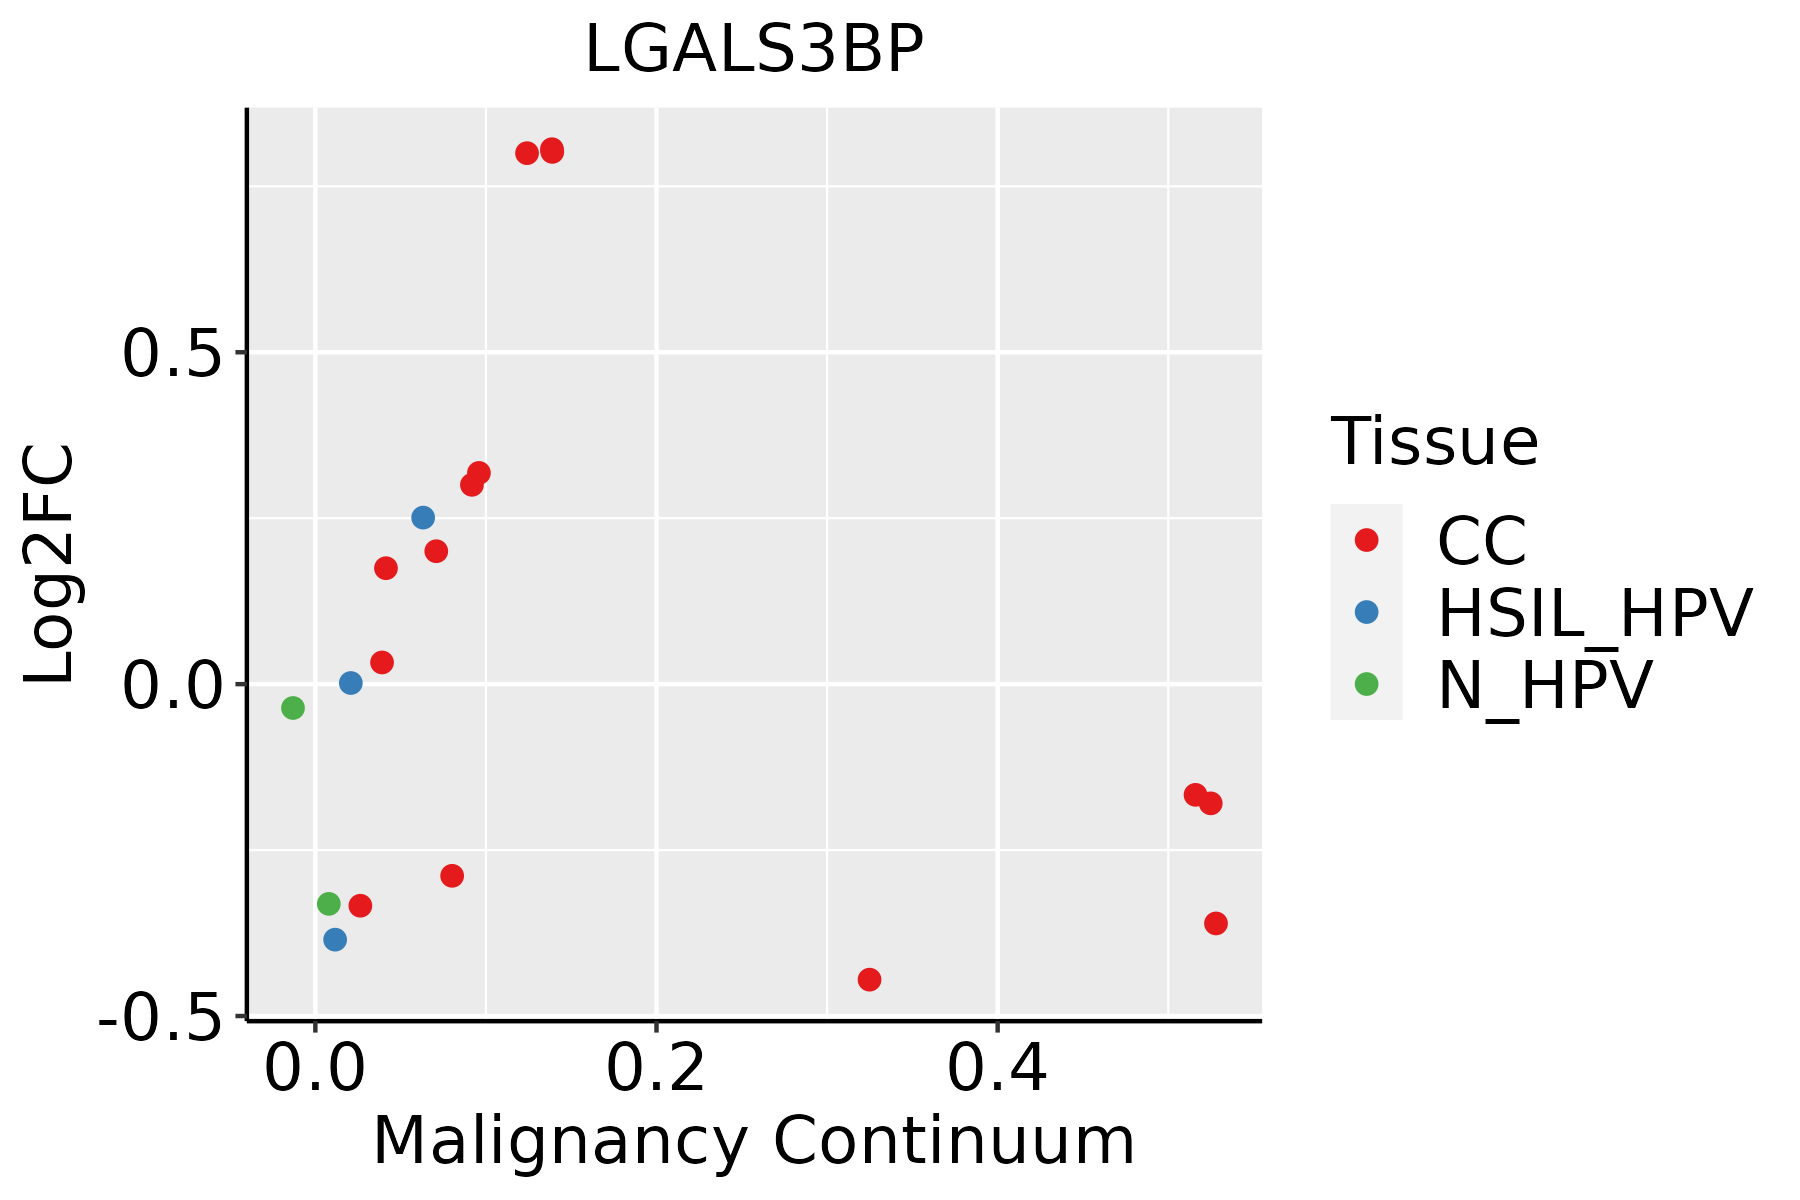 | CC: Cervix cancer |
| HSIL_HPV: HPV-infected high-grade squamous intraepithelial lesions | ||
| N_HPV: HPV-infected normal cervix | ||
| Colorectum (GSE201348) |  | FAP: Familial adenomatous polyposis |
| CRC: Colorectal cancer | ||
| Colorectum (HTA11) |  | AD: Adenomas |
| SER: Sessile serrated lesions | ||
| MSI-H: Microsatellite-high colorectal cancer | ||
| MSS: Microsatellite stable colorectal cancer | ||
| Endometrium |  | AEH: Atypical endometrial hyperplasia |
| EEC: Endometrioid Cancer | ||
| Esophagus | 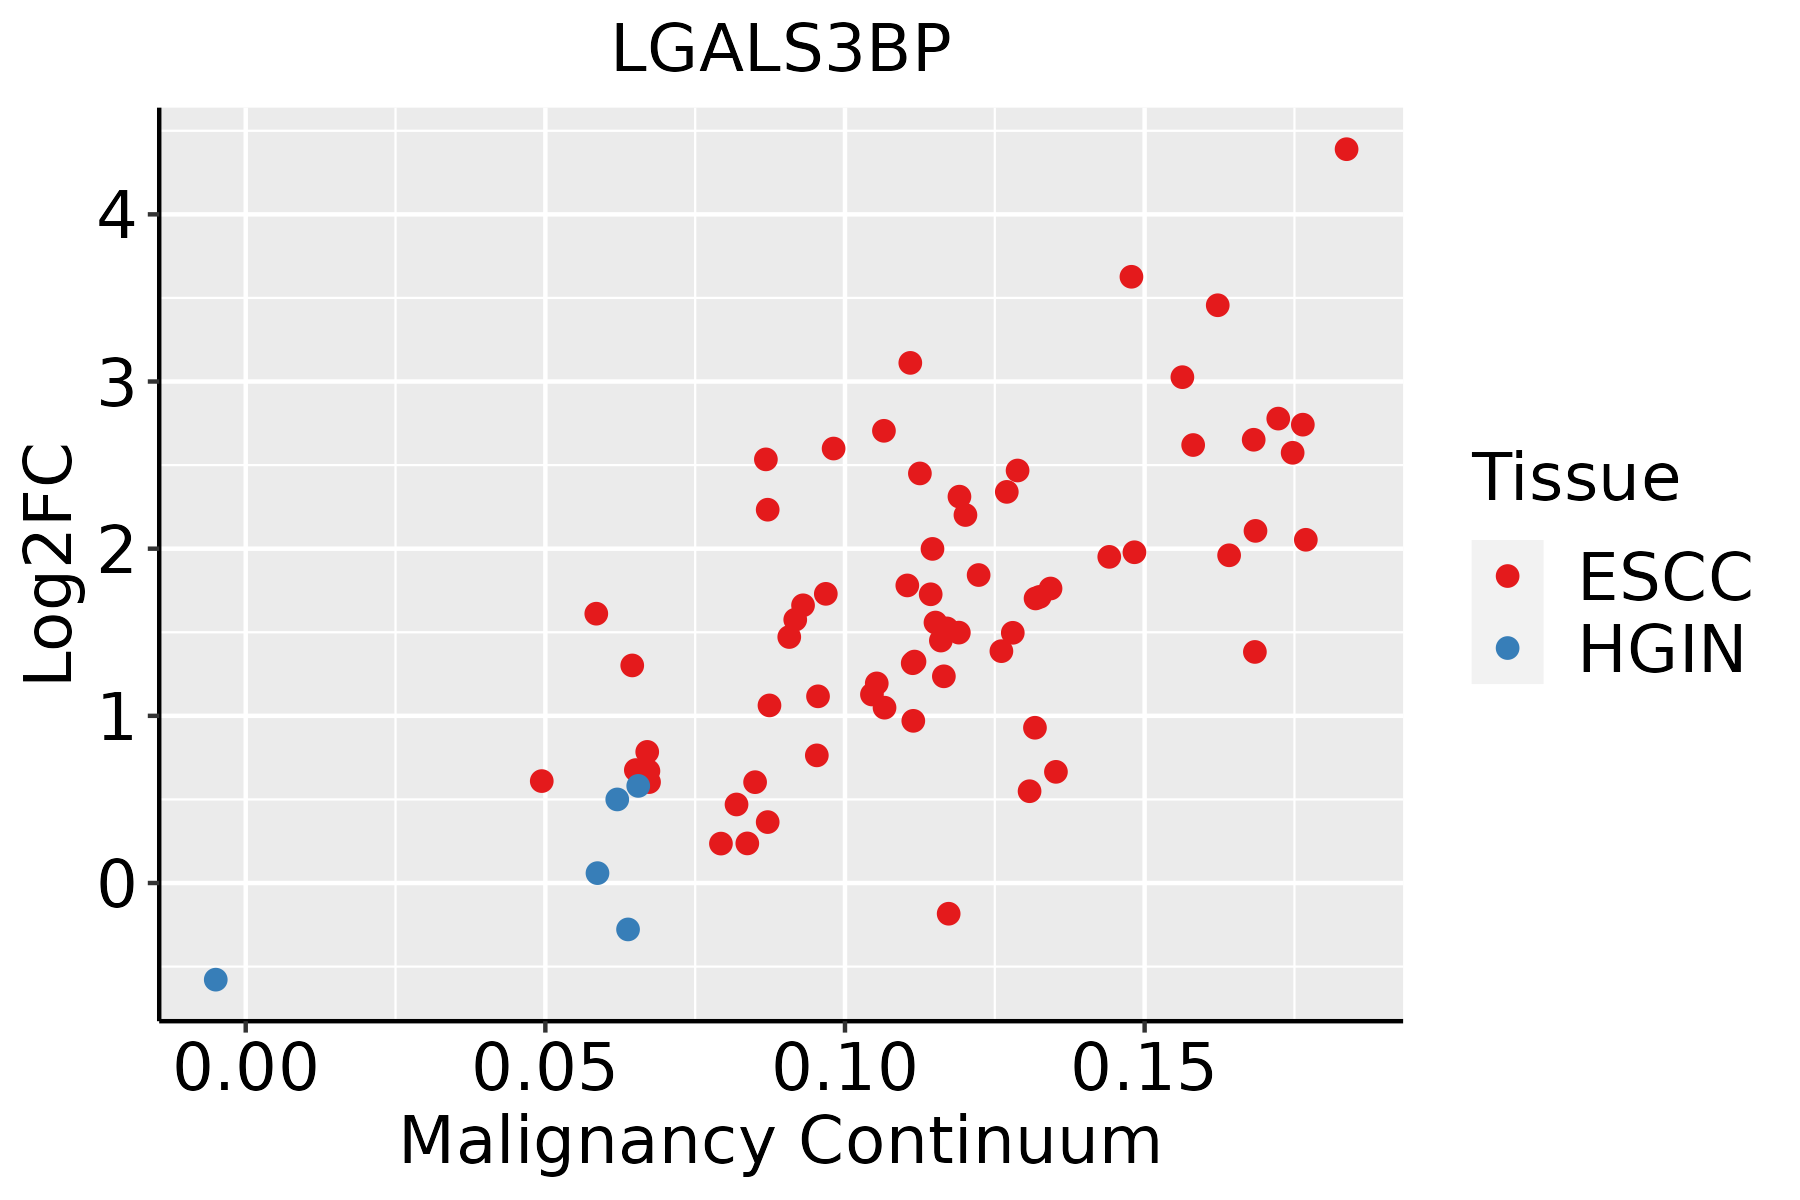 | ESCC: Esophageal squamous cell carcinoma |
| HGIN: High-grade intraepithelial neoplasias | ||
| LGIN: Low-grade intraepithelial neoplasias | ||
| GC |  | CAG: Chronic atrophic gastritis |
| CAG with IM: Chronic atrophic gastritis with intestinal metaplasia | ||
| CSG: Chronic superficial gastritis | ||
| GC: Gastric cancer | ||
| SIM: Severe intestinal metaplasia | ||
| WIM: Wild intestinal metaplasia | ||
| Liver | 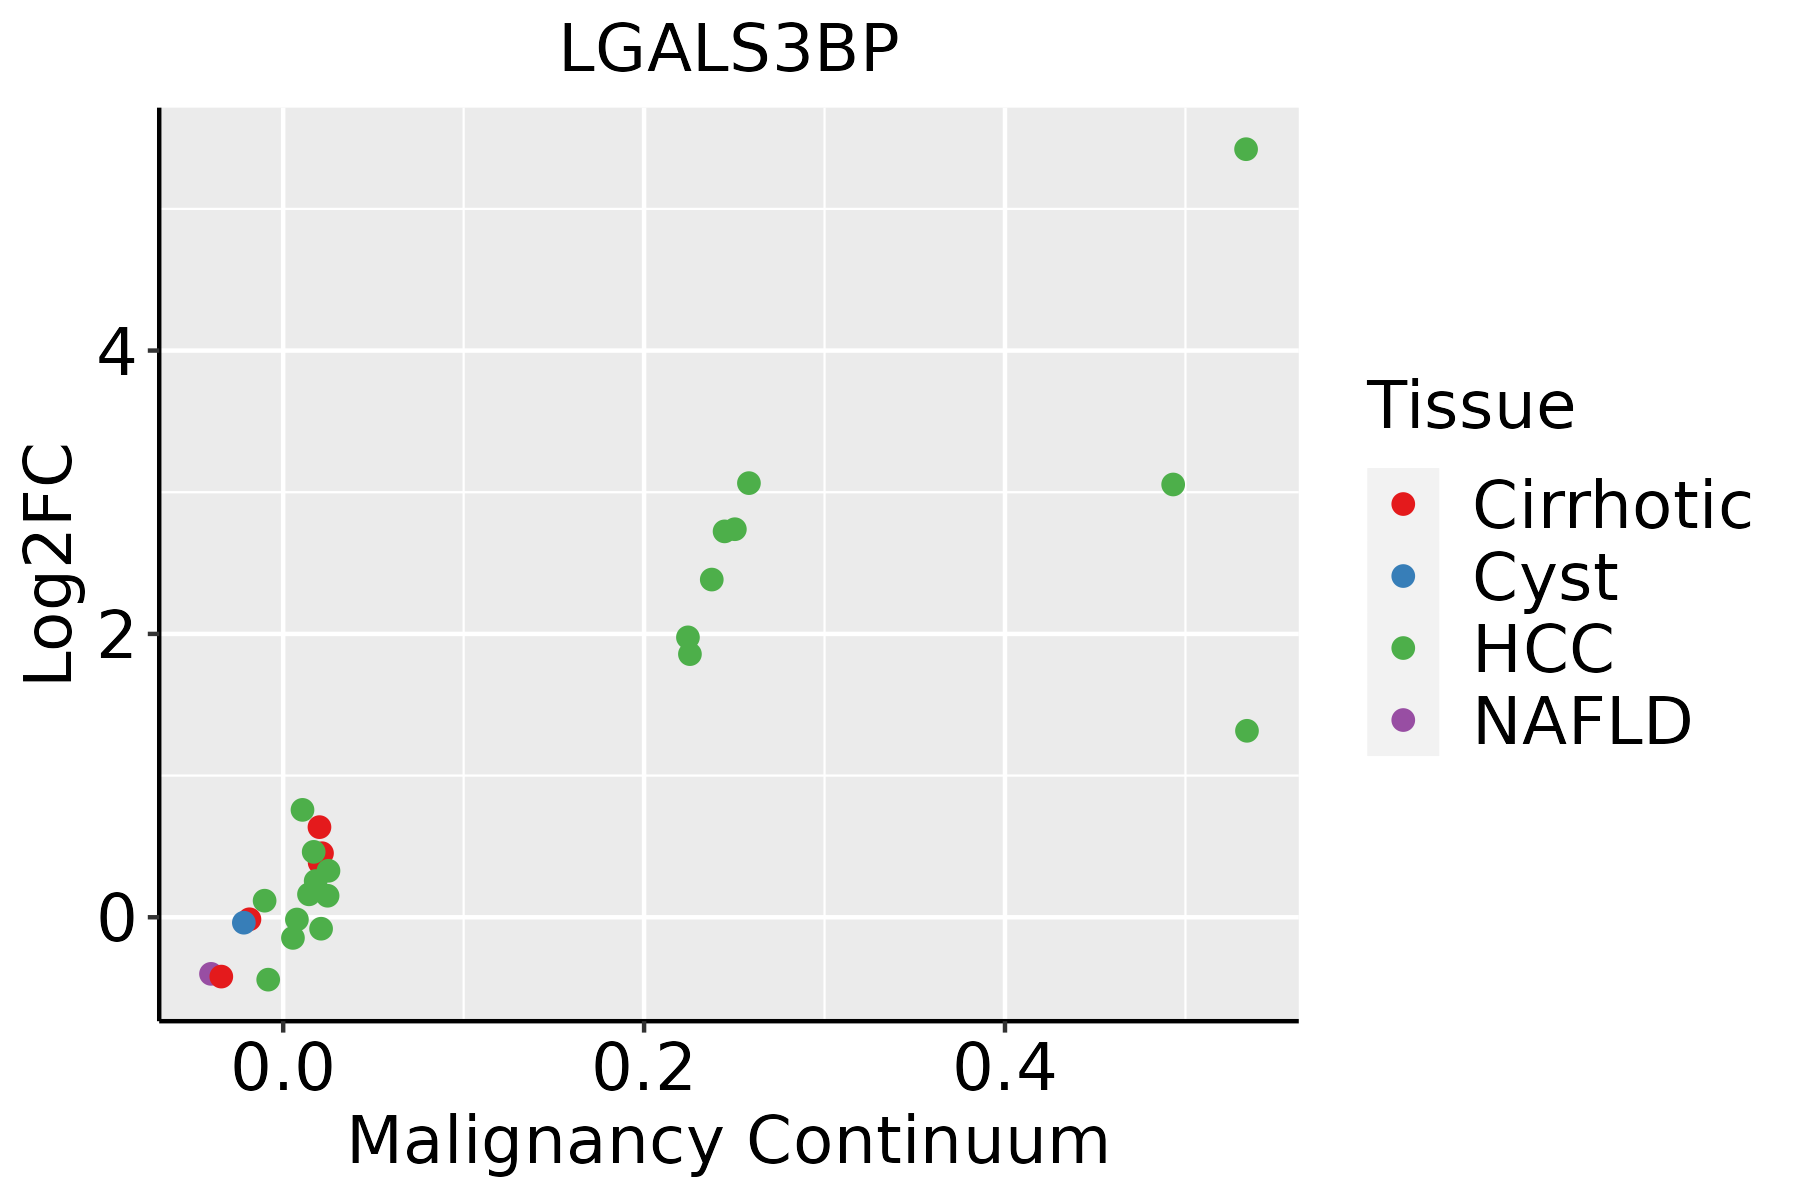 | HCC: Hepatocellular carcinoma |
| NAFLD: Non-alcoholic fatty liver disease | ||
| Oral Cavity |  | EOLP: Erosive Oral lichen planus |
| LP: leukoplakia | ||
| NEOLP: Non-erosive oral lichen planus | ||
| OSCC: Oral squamous cell carcinoma | ||
| Prostate | 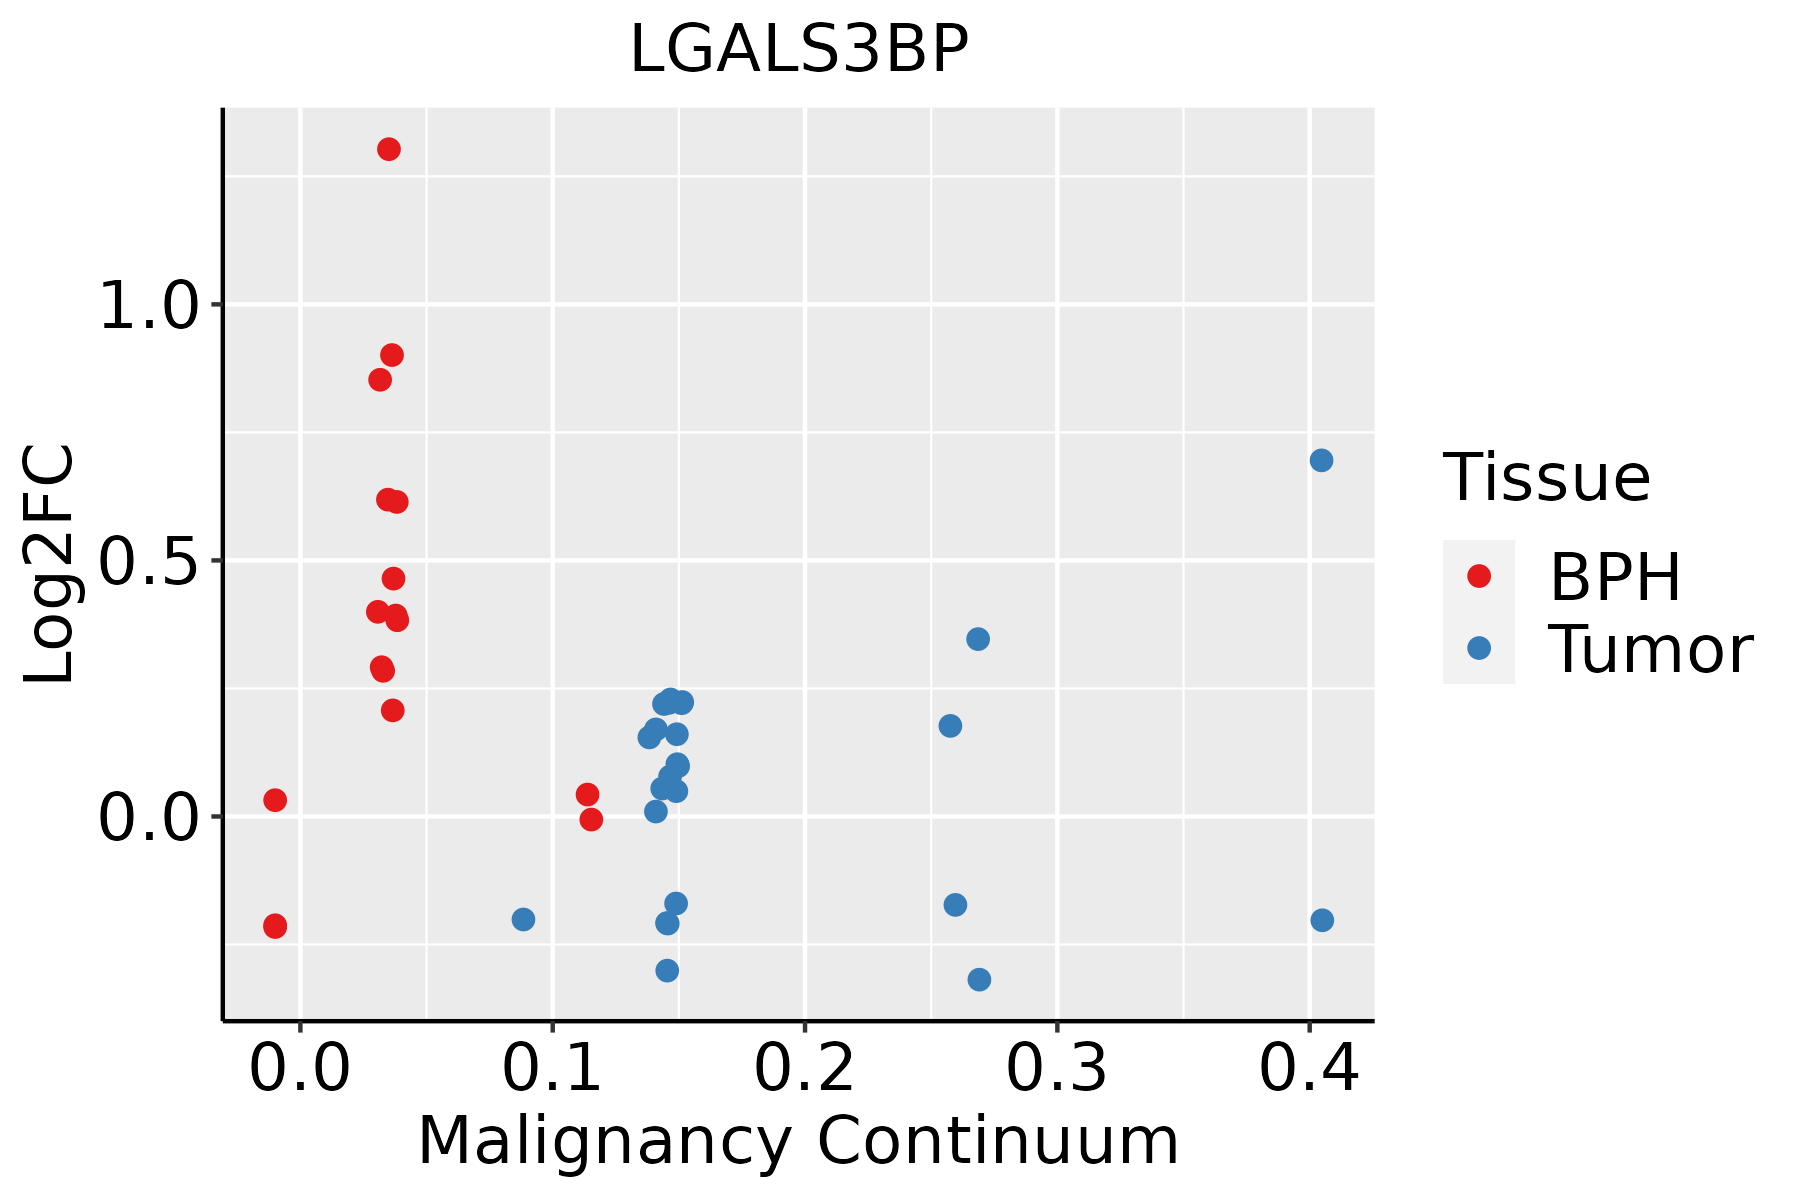 | BPH: Benign Prostatic Hyperplasia |
| Skin | 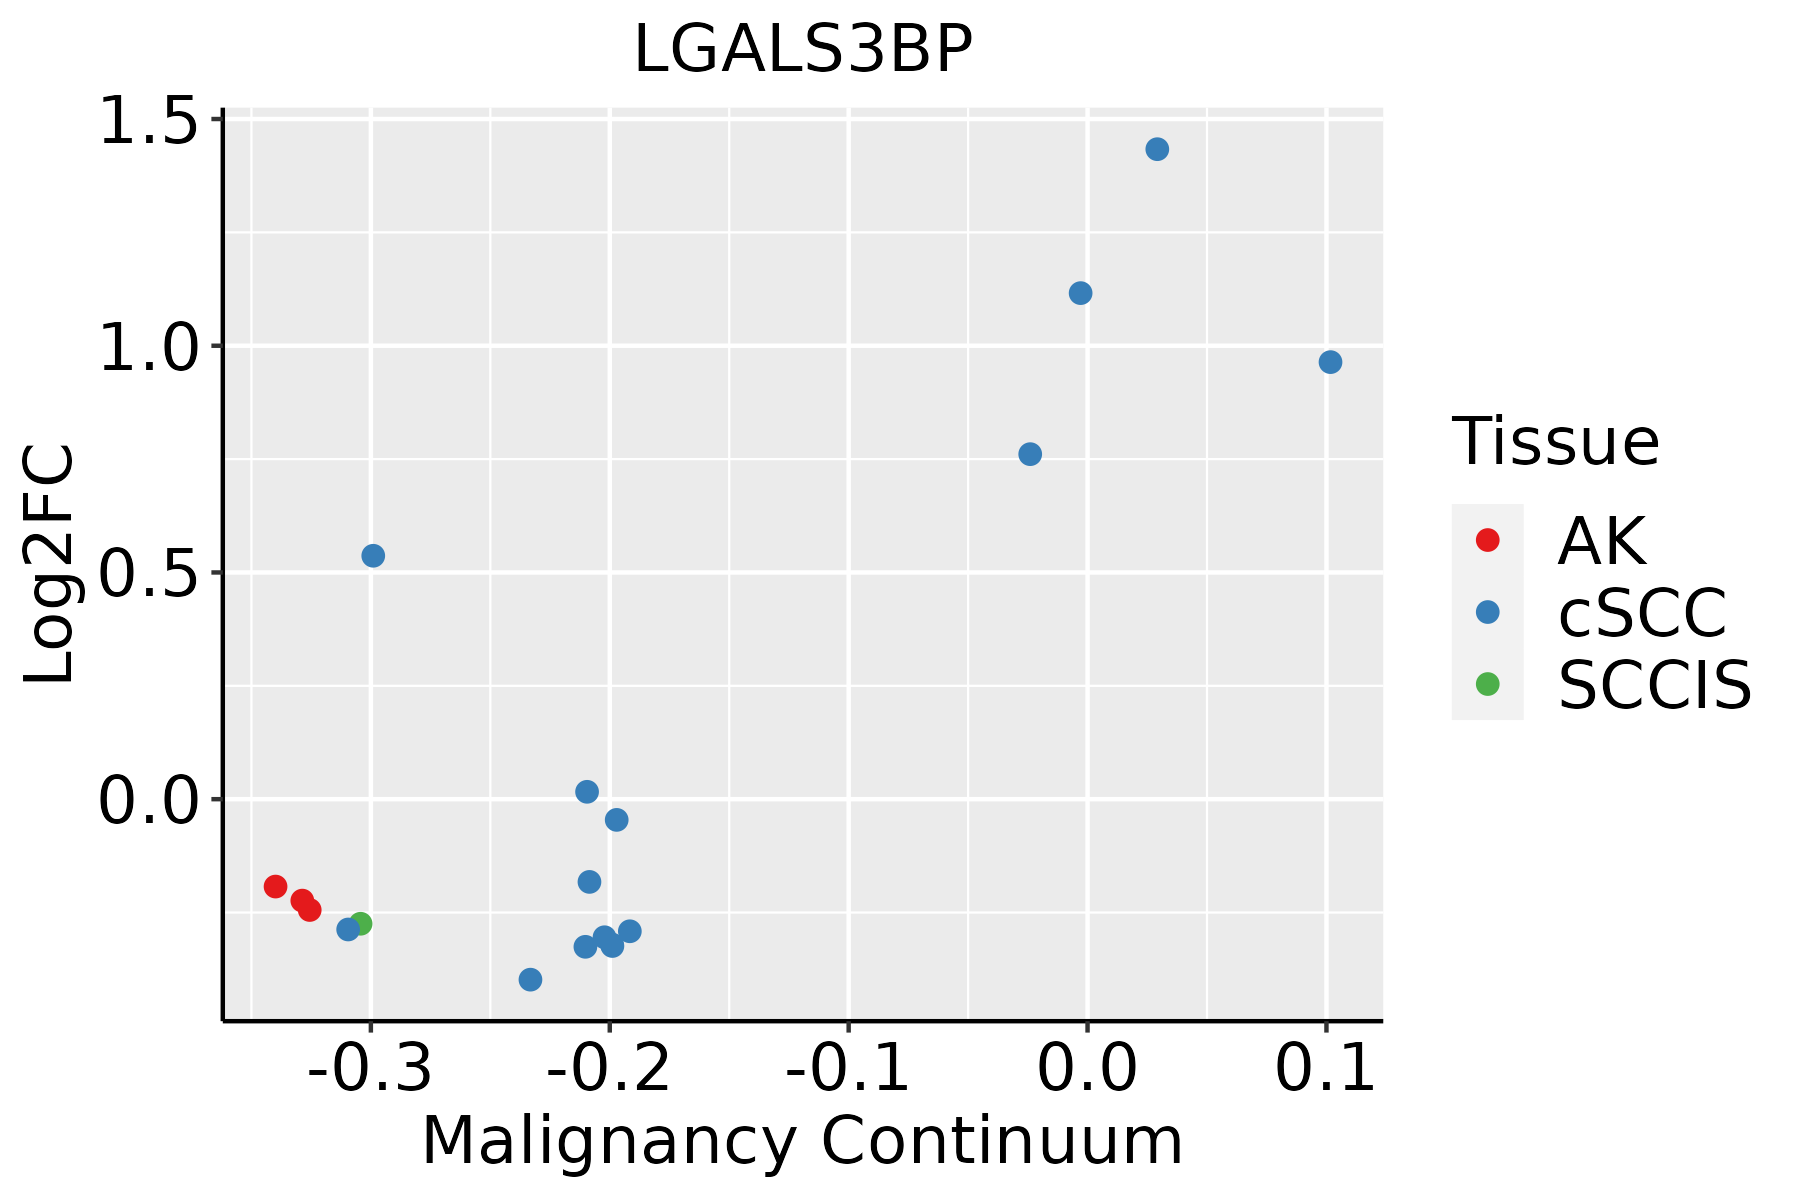 | AK: Actinic keratosis |
| cSCC: Cutaneous squamous cell carcinoma | ||
| SCCIS:squamous cell carcinoma in situ | ||
| Thyroid | 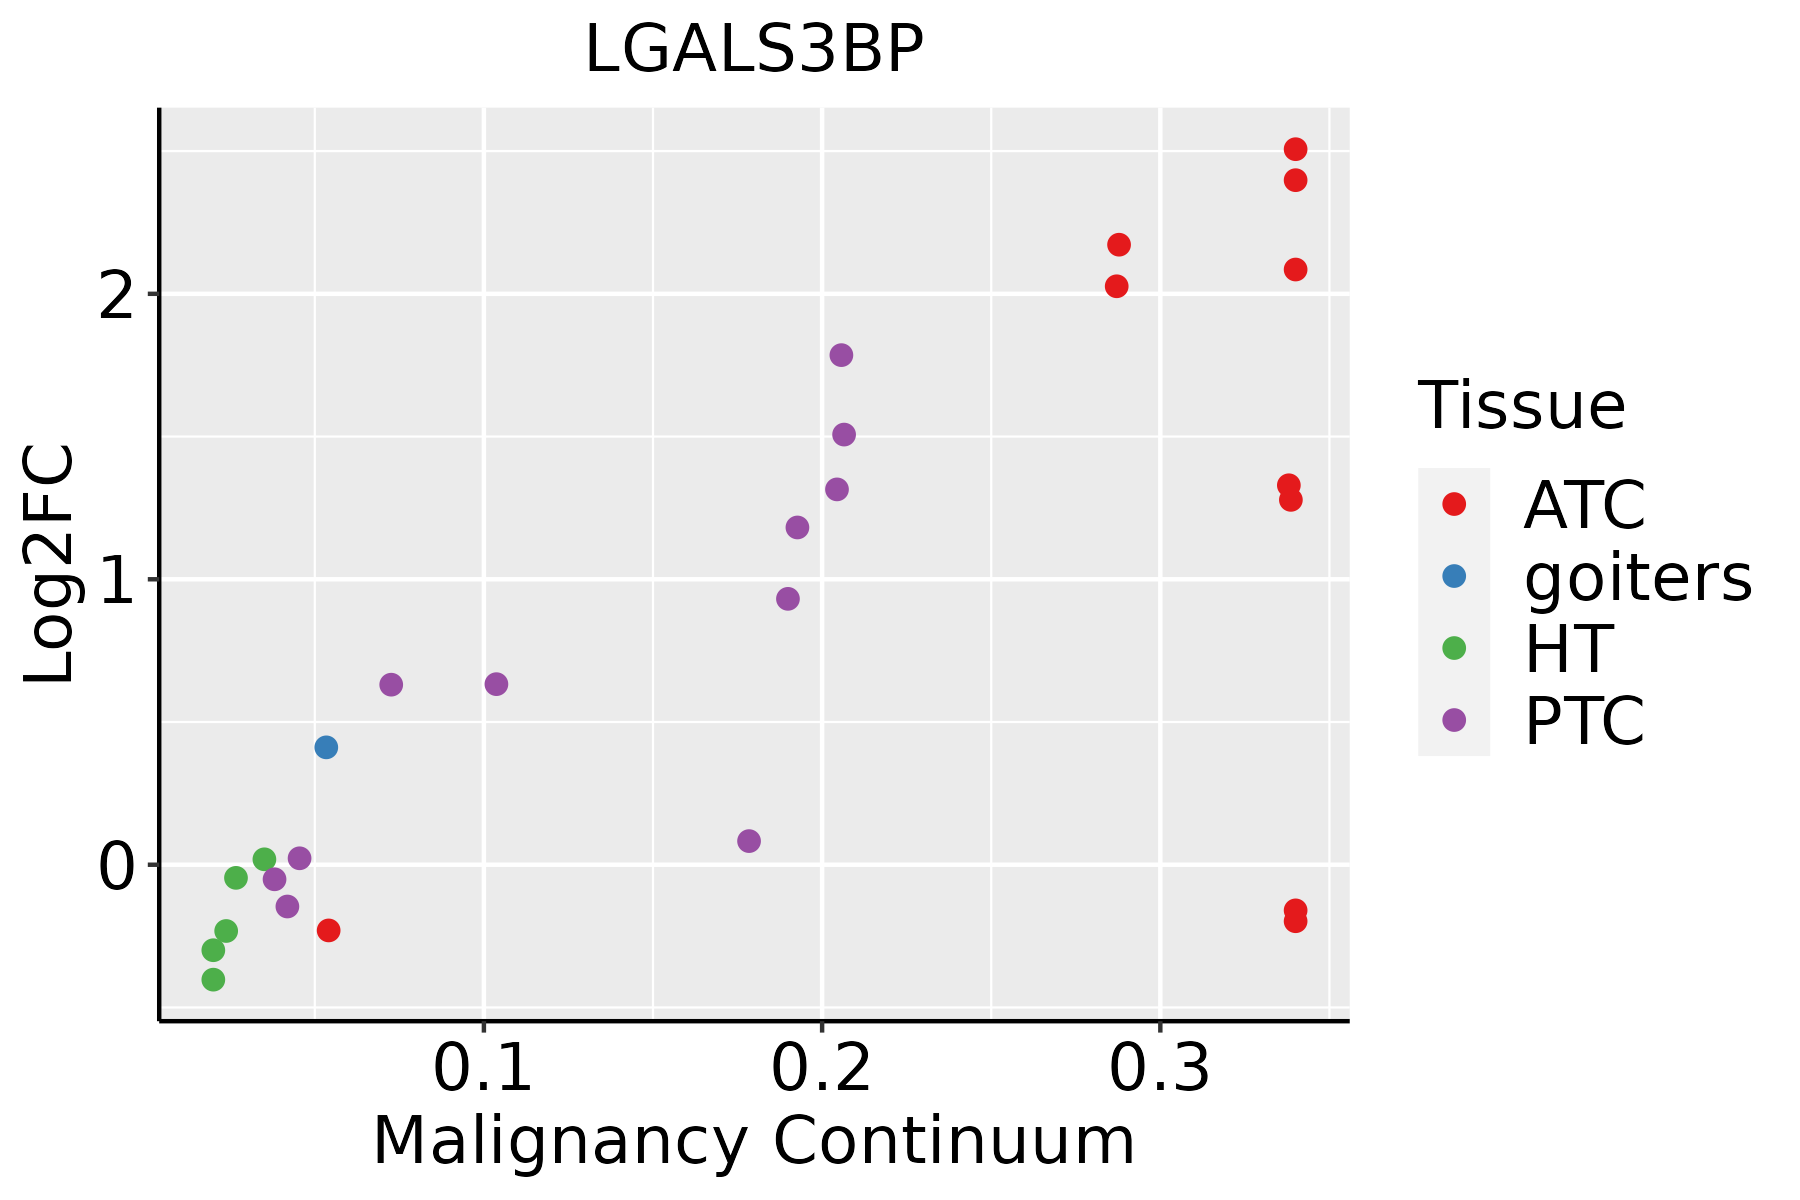 | ATC: Anaplastic thyroid cancer |
| HT: Hashimoto's thyroiditis | ||
| PTC: Papillary thyroid cancer |
| ∗log2FC in expression of this searched gene in stem-like cells from each diseased tissue sample relative to stem-like cells in normal samples in each tissue plotted against the malignancy continuum. Samples are colored based on if they are from different disease stage. |
Top |
Malignant transformation related pathway analysis |
| Find out the enriched GO biological processes and KEGG pathways involved in transition from healthy to precancer to cancer |
| Tissue | Disease Stage | Enriched GO biological Processes |
| Colorectum | AD |  |
| Colorectum | SER |  |
| Colorectum | MSS |  |
| Colorectum | MSI-H |  |
| Colorectum | FAP |  |
| ∗Top 15 enriched GO BP terms are showed in the bar plot of each disease state in each tissue. Each row represents a significant GO biological process which is colored according to the -log10(p.adjust). |
| Page: 1 2 3 4 5 6 7 8 9 |
| GO ID | Tissue | Disease Stage | Description | Gene Ratio | Bg Ratio | pvalue | p.adjust | Count |
| Page: 1 |
| Pathway ID | Tissue | Disease Stage | Description | Gene Ratio | Bg Ratio | pvalue | p.adjust | qvalue | Count |
| Page: 1 |
Top |
Cell-cell communication analysis |
| Identification of potential cell-cell interactions between two cell types and their ligand-receptor pairs for different disease states |
| Ligand | Receptor | LRpair | Pathway | Tissue | Disease Stage |
| Page: 1 |
Top |
Single-cell gene regulatory network inference analysis |
| Find out the significant the regulons (TFs) and the target genes of each regulon across cell types for different disease states |
| TF | Cell Type | Tissue | Disease Stage | Target Gene | RSS | Regulon Activity |
| ∗The dot plots of a searched regulon are shown for all cell subpopulations in each disease state of each tissue based on the regulon specific score inferred using pySCENIC and by calculating the average expression. |
| Page: 1 |
Top |
Somatic mutation of malignant transformation related genes |
| Annotation of somatic variants for genes involved in malignant transformation |
| Hugo Symbol | Variant Class | Variant Classification | dbSNP RS | HGVSc | HGVSp | HGVSp Short | SWISSPROT | BIOTYPE | SIFT | PolyPhen | Tumor Sample Barcode | Tissue | Histology | Sex | Age | Stage | Therapy Types | Drugs | Outcome |
| LGALS3BP | SNV | Missense_Mutation | novel | c.1583N>T | p.Gly528Val | p.G528V | Q08380 | protein_coding | deleterious(0) | possibly_damaging(0.577) | TCGA-AN-A0FN-01 | Breast | breast invasive carcinoma | Female | <65 | I/II | Unknown | Unknown | SD |
| LGALS3BP | SNV | Missense_Mutation | novel | c.244N>C | p.Gly82Arg | p.G82R | Q08380 | protein_coding | deleterious(0) | probably_damaging(1) | TCGA-GI-A2C9-01 | Breast | breast invasive carcinoma | Female | <65 | I/II | Unspecific | SD | |
| LGALS3BP | insertion | In_Frame_Ins | novel | c.1583_1584insCTCACAAAACCT | p.Gly528_Leu529insSerGlnAsnLeu | p.G528_L529insSQNL | Q08380 | protein_coding | TCGA-AN-A0FN-01 | Breast | breast invasive carcinoma | Female | <65 | I/II | Unknown | Unknown | SD | ||
| LGALS3BP | deletion | Frame_Shift_Del | novel | c.1505_1506delNN | p.Pro502ArgfsTer92 | p.P502Rfs*92 | Q08380 | protein_coding | TCGA-C8-A12M-01 | Breast | breast invasive carcinoma | Female | >=65 | I/II | Unknown | Unknown | SD | ||
| LGALS3BP | SNV | Missense_Mutation | rs756907705 | c.1625N>T | p.Ala542Val | p.A542V | Q08380 | protein_coding | tolerated(0.06) | benign(0.268) | TCGA-2W-A8YY-01 | Cervix | cervical & endocervical cancer | Female | <65 | I/II | Chemotherapy | cisplatin | CR |
| LGALS3BP | SNV | Missense_Mutation | c.412G>A | p.Glu138Lys | p.E138K | Q08380 | protein_coding | tolerated(0.12) | benign(0.007) | TCGA-IR-A3LH-01 | Cervix | cervical & endocervical cancer | Female | <65 | I/II | Chemotherapy | cisplatin | CR | |
| LGALS3BP | SNV | Missense_Mutation | c.861C>G | p.Phe287Leu | p.F287L | Q08380 | protein_coding | tolerated(0.08) | benign(0.127) | TCGA-JW-A5VL-01 | Cervix | cervical & endocervical cancer | Female | <65 | I/II | Unknown | Unknown | SD | |
| LGALS3BP | SNV | Missense_Mutation | rs143986382 | c.1658N>T | p.Ser553Leu | p.S553L | Q08380 | protein_coding | deleterious(0) | benign(0.297) | TCGA-AZ-4315-01 | Colorectum | colon adenocarcinoma | Male | <65 | I/II | Unknown | Unknown | SD |
| LGALS3BP | SNV | Missense_Mutation | c.1510N>A | p.Leu504Met | p.L504M | Q08380 | protein_coding | deleterious(0.02) | possibly_damaging(0.879) | TCGA-AZ-6601-01 | Colorectum | colon adenocarcinoma | Male | >=65 | I/II | Unknown | Unknown | PD | |
| LGALS3BP | SNV | Missense_Mutation | novel | c.1250N>C | p.Phe417Ser | p.F417S | Q08380 | protein_coding | tolerated(0.9) | benign(0) | TCGA-CA-6717-01 | Colorectum | colon adenocarcinoma | Male | <65 | I/II | Chemotherapy | oxaliplatin | CR |
| Page: 1 2 3 4 |
Top |
Related drugs of malignant transformation related genes |
| Identification of chemicals and drugs interact with genes involved in malignant transfromation |
| (DGIdb 4.0) |
| Entrez ID | Symbol | Category | Interaction Types | Drug Claim Name | Drug Name | PMIDs |
| Page: 1 |

Copyright 2023-Present -The University of Texas Health Science Center at Houston |