
|
|||||
|
 | |
| |
| |
| |
| |
| |
|
Gene: LGALS3 |
Gene summary for LGALS3 |
| Gene information | Species | Human | Gene symbol | LGALS3 | Gene ID | 3958 |
| Gene name | galectin 3 | |
| Gene Alias | CBP35 | |
| Cytomap | 14q22.3 | |
| Gene Type | protein-coding | GO ID | GO:0001771 | UniProtAcc | A0A024R693 |
Top |
Malignant transformation analysis |
| Identification of the aberrant gene expression in precancerous and cancerous lesions by comparing the gene expression of stem-like cells in diseased tissues with normal stem cells |
| Entrez ID | Symbol | Replicates | Species | Organ | Tissue | Adj P-value | Log2FC | Malignancy |
| 3958 | LGALS3 | GSM4909282 | Human | Breast | IDC | 2.56e-31 | 5.20e-01 | -0.0288 |
| 3958 | LGALS3 | GSM4909285 | Human | Breast | IDC | 8.09e-06 | -1.89e-03 | 0.21 |
| 3958 | LGALS3 | GSM4909286 | Human | Breast | IDC | 8.15e-27 | -7.40e-01 | 0.1081 |
| 3958 | LGALS3 | GSM4909287 | Human | Breast | IDC | 3.35e-05 | -3.87e-01 | 0.2057 |
| 3958 | LGALS3 | GSM4909288 | Human | Breast | IDC | 2.73e-03 | -5.12e-01 | 0.0988 |
| 3958 | LGALS3 | GSM4909289 | Human | Breast | IDC | 6.51e-03 | -6.23e-01 | 0.1064 |
| 3958 | LGALS3 | GSM4909291 | Human | Breast | IDC | 1.07e-22 | -8.69e-01 | 0.1753 |
| 3958 | LGALS3 | GSM4909292 | Human | Breast | IDC | 4.39e-03 | -7.70e-01 | 0.1236 |
| 3958 | LGALS3 | GSM4909293 | Human | Breast | IDC | 3.33e-34 | -9.05e-01 | 0.1581 |
| 3958 | LGALS3 | GSM4909294 | Human | Breast | IDC | 1.93e-04 | -4.13e-01 | 0.2022 |
| 3958 | LGALS3 | GSM4909296 | Human | Breast | IDC | 1.91e-12 | -4.27e-01 | 0.1524 |
| 3958 | LGALS3 | GSM4909297 | Human | Breast | IDC | 7.26e-22 | -5.41e-01 | 0.1517 |
| 3958 | LGALS3 | GSM4909298 | Human | Breast | IDC | 1.94e-28 | -7.83e-01 | 0.1551 |
| 3958 | LGALS3 | GSM4909301 | Human | Breast | IDC | 2.69e-42 | -9.45e-01 | 0.1577 |
| 3958 | LGALS3 | GSM4909302 | Human | Breast | IDC | 1.03e-08 | -4.61e-01 | 0.1545 |
| 3958 | LGALS3 | GSM4909303 | Human | Breast | IDC | 2.71e-04 | -5.58e-01 | 0.0438 |
| 3958 | LGALS3 | GSM4909304 | Human | Breast | IDC | 8.27e-09 | -4.03e-01 | 0.1636 |
| 3958 | LGALS3 | GSM4909306 | Human | Breast | IDC | 7.44e-11 | -5.16e-01 | 0.1564 |
| 3958 | LGALS3 | GSM4909307 | Human | Breast | IDC | 9.74e-13 | -5.81e-01 | 0.1569 |
| 3958 | LGALS3 | GSM4909308 | Human | Breast | IDC | 9.97e-31 | -8.24e-01 | 0.158 |
| Page: 1 2 3 4 5 6 7 8 9 10 11 12 13 14 15 16 17 18 |
| Tissue | Expression Dynamics | Abbreviation |
| Breast | 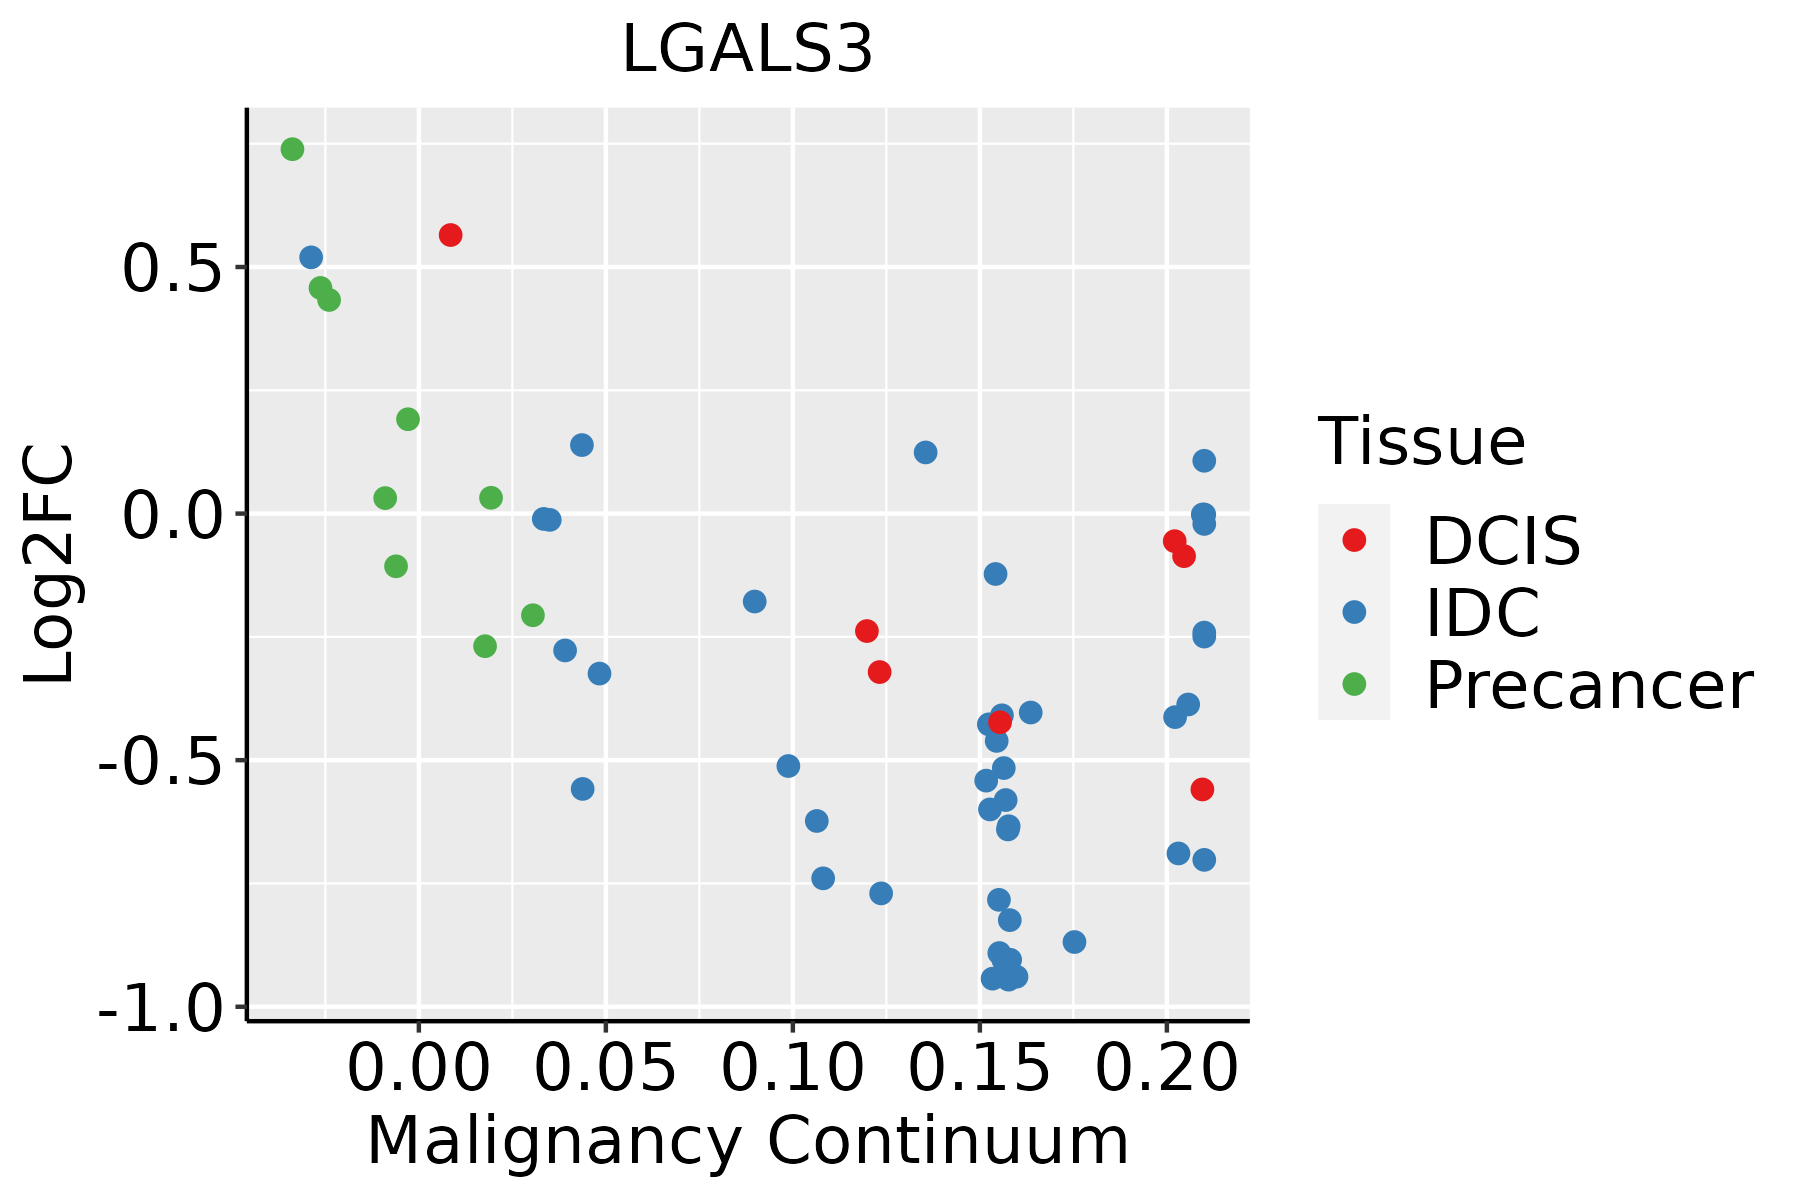 | IDC: Invasive ductal carcinoma |
| DCIS: Ductal carcinoma in situ | ||
| Precancer(BRCA1-mut): Precancerous lesion from BRCA1 mutation carriers | ||
| Cervix | 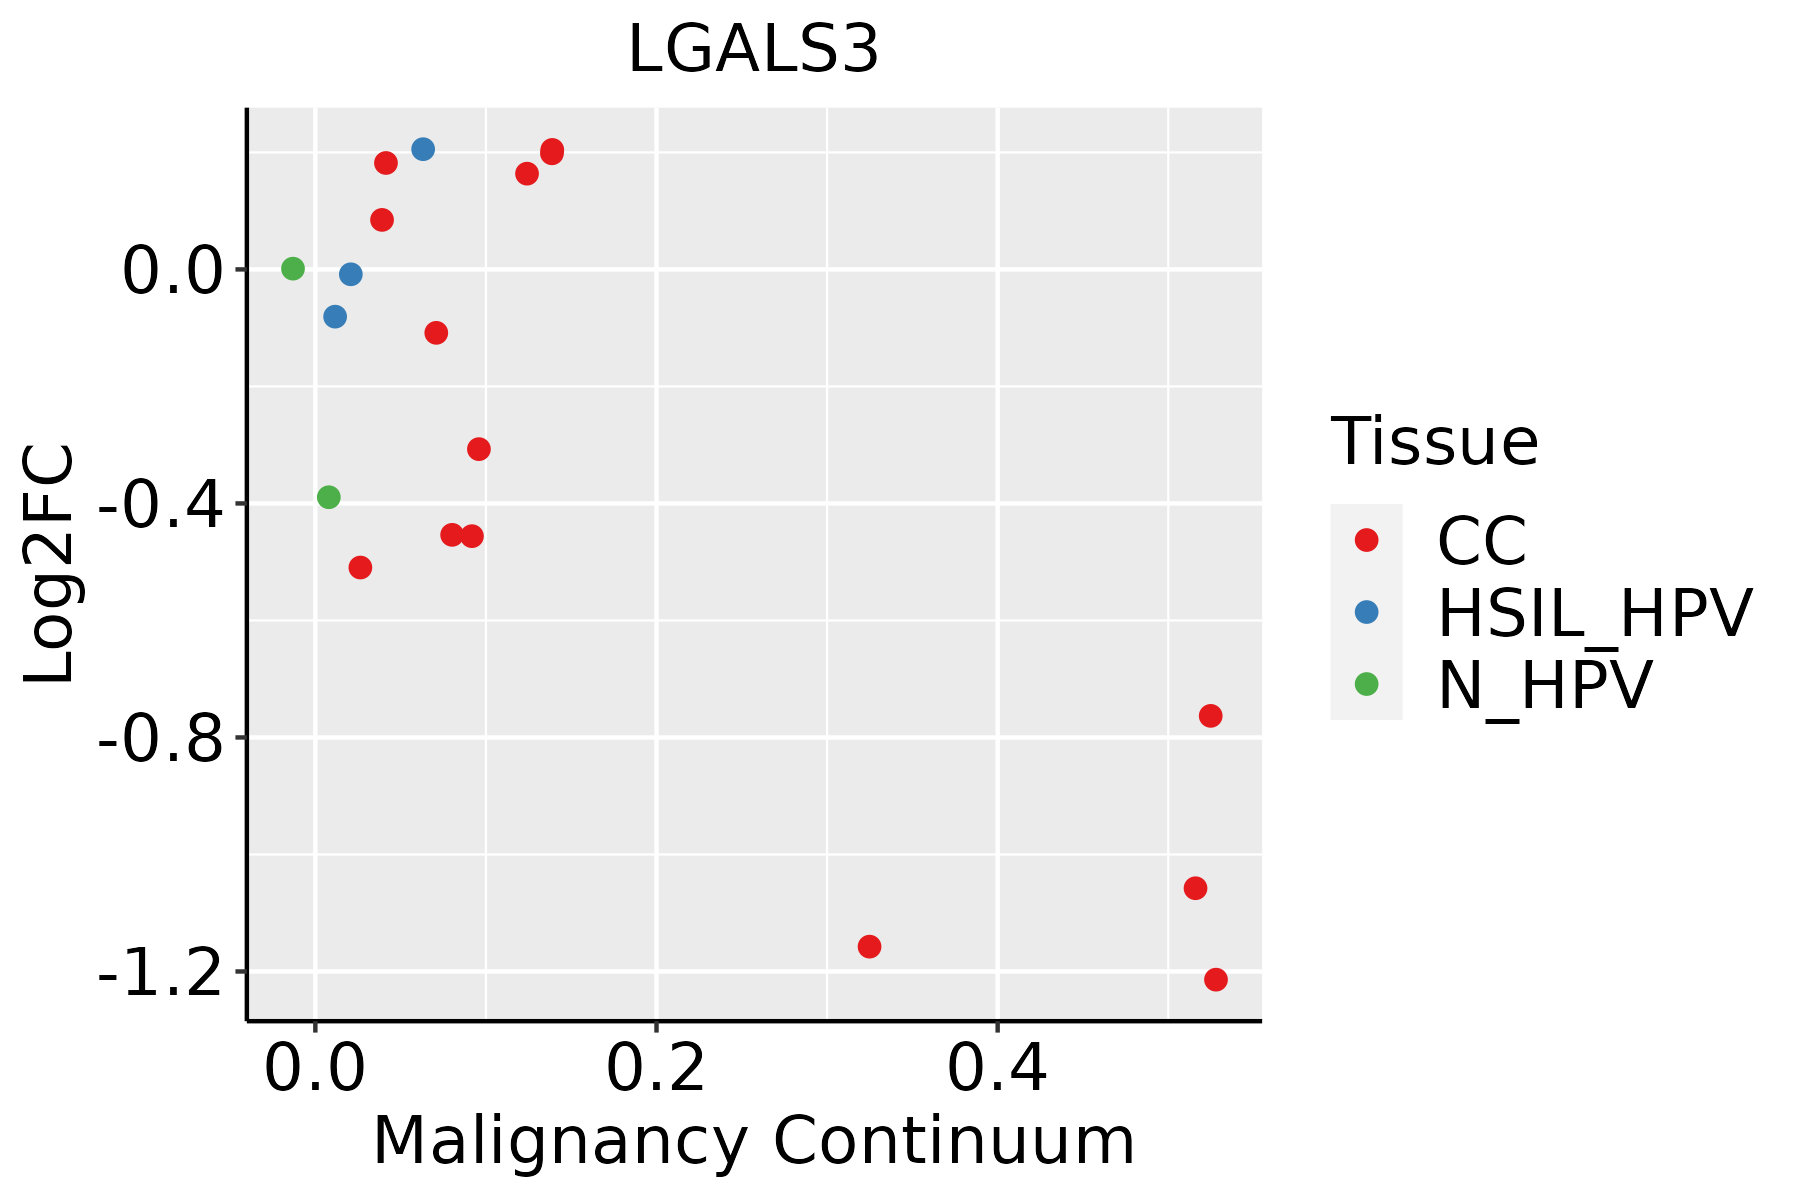 | CC: Cervix cancer |
| HSIL_HPV: HPV-infected high-grade squamous intraepithelial lesions | ||
| N_HPV: HPV-infected normal cervix | ||
| Colorectum (GSE201348) |  | FAP: Familial adenomatous polyposis |
| CRC: Colorectal cancer | ||
| Colorectum (HTA11) |  | AD: Adenomas |
| SER: Sessile serrated lesions | ||
| MSI-H: Microsatellite-high colorectal cancer | ||
| MSS: Microsatellite stable colorectal cancer | ||
| Endometrium | 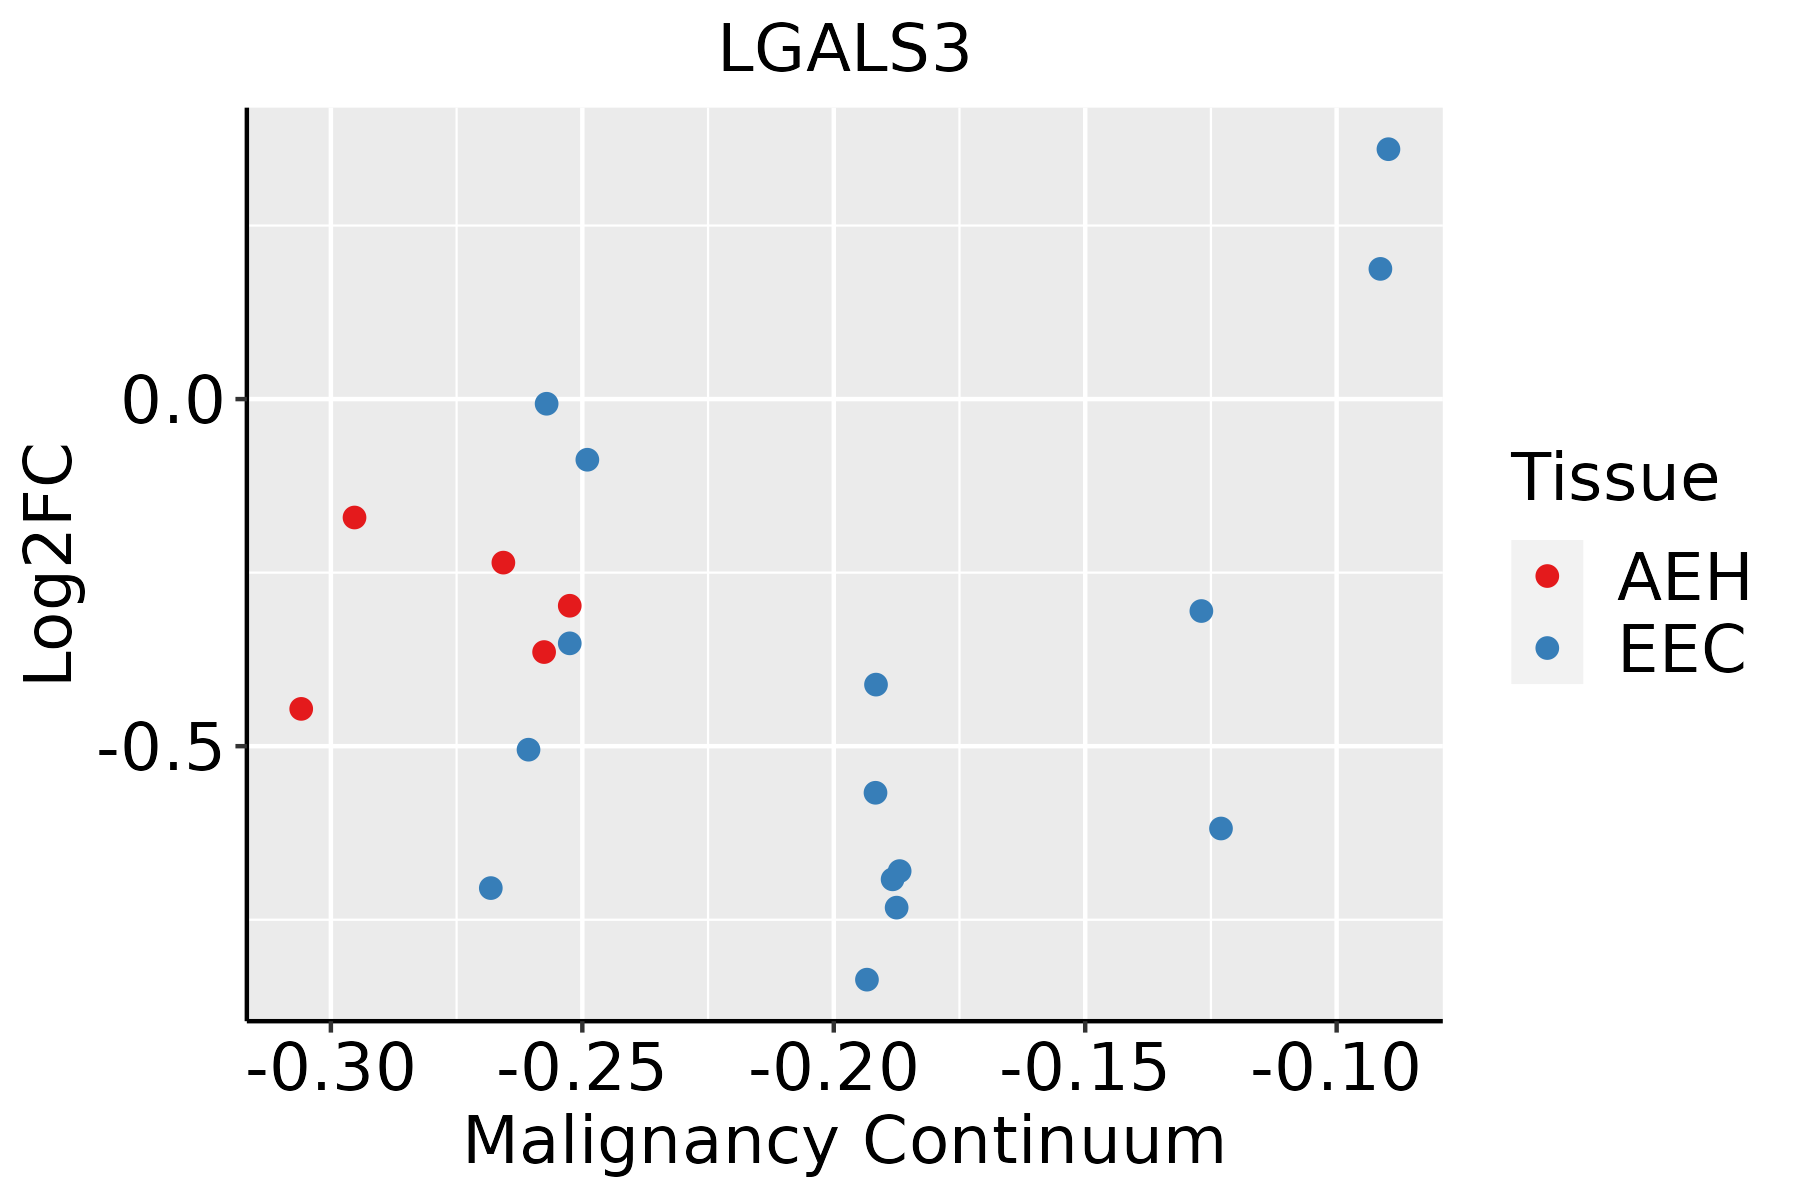 | AEH: Atypical endometrial hyperplasia |
| EEC: Endometrioid Cancer | ||
| Esophagus | 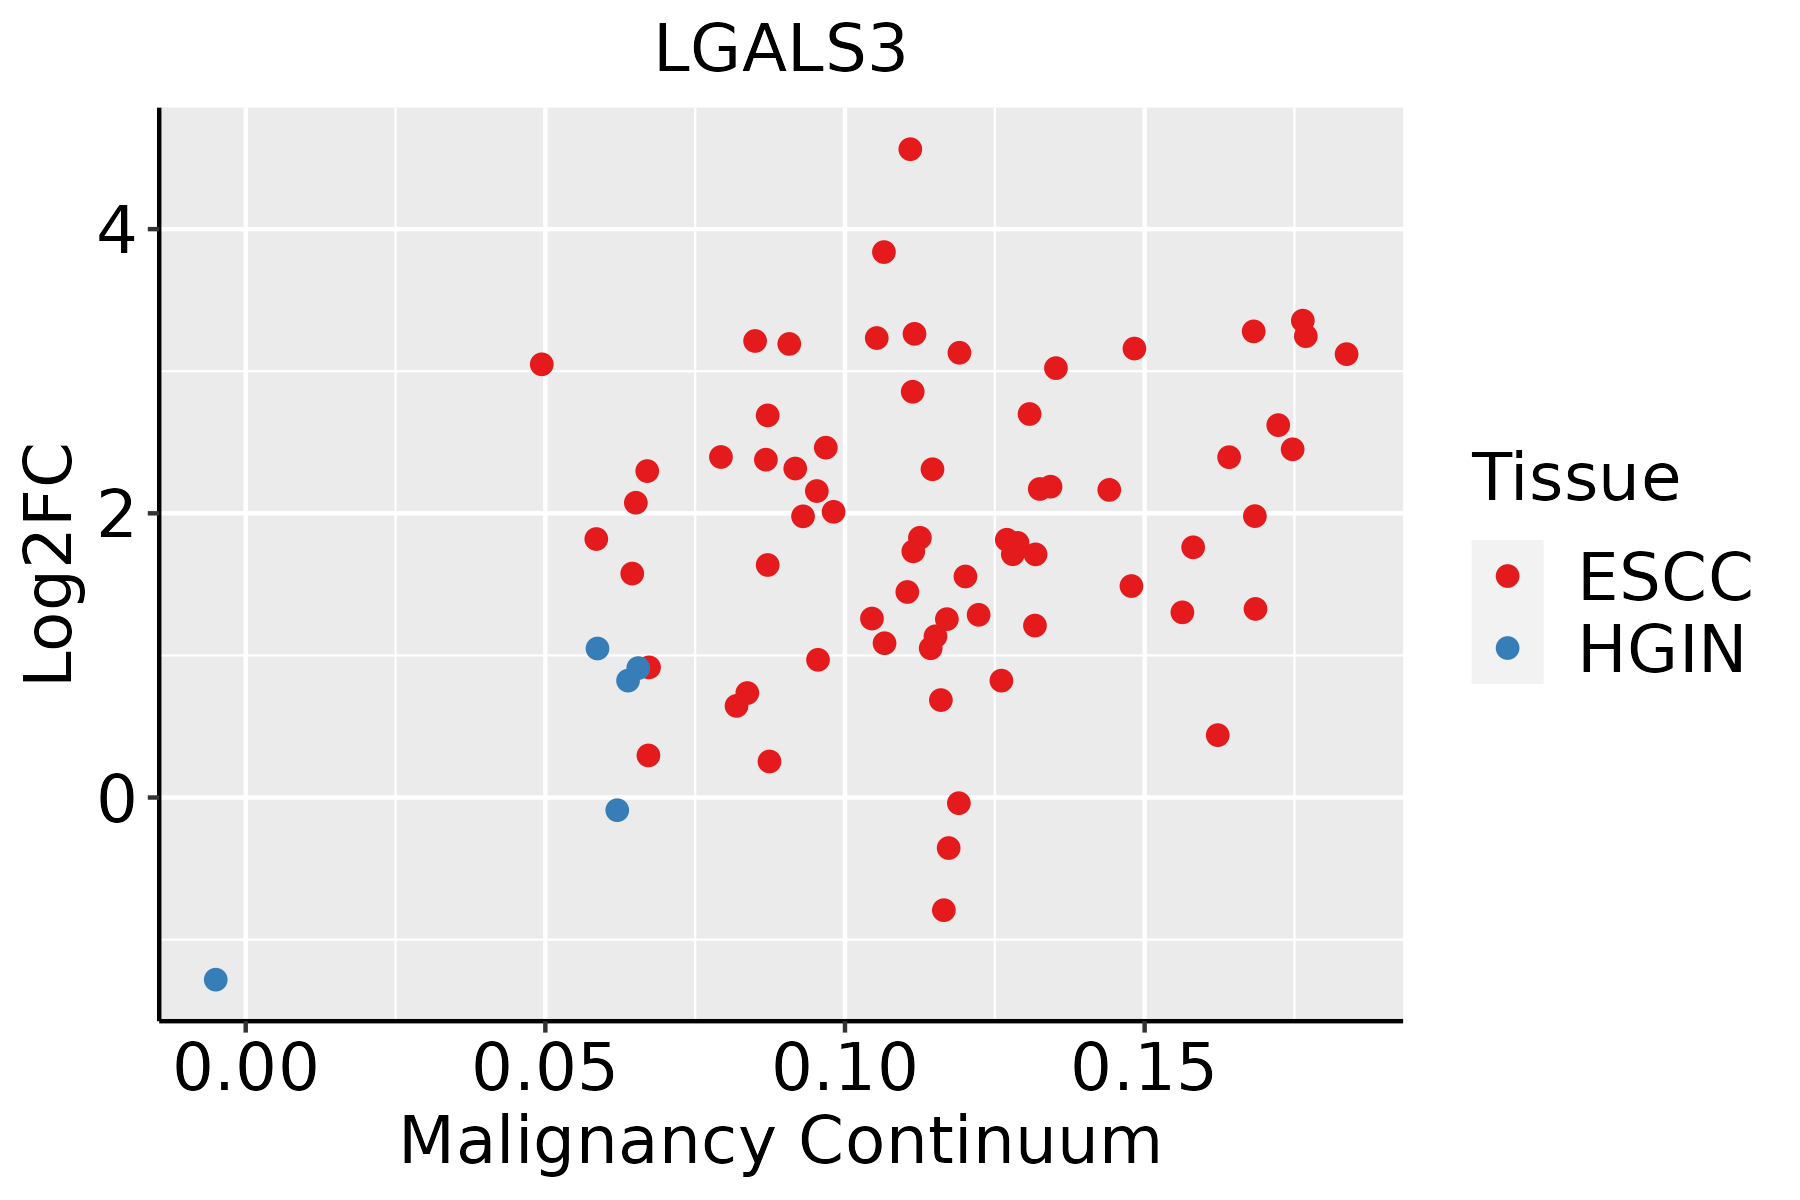 | ESCC: Esophageal squamous cell carcinoma |
| HGIN: High-grade intraepithelial neoplasias | ||
| LGIN: Low-grade intraepithelial neoplasias | ||
| GC | 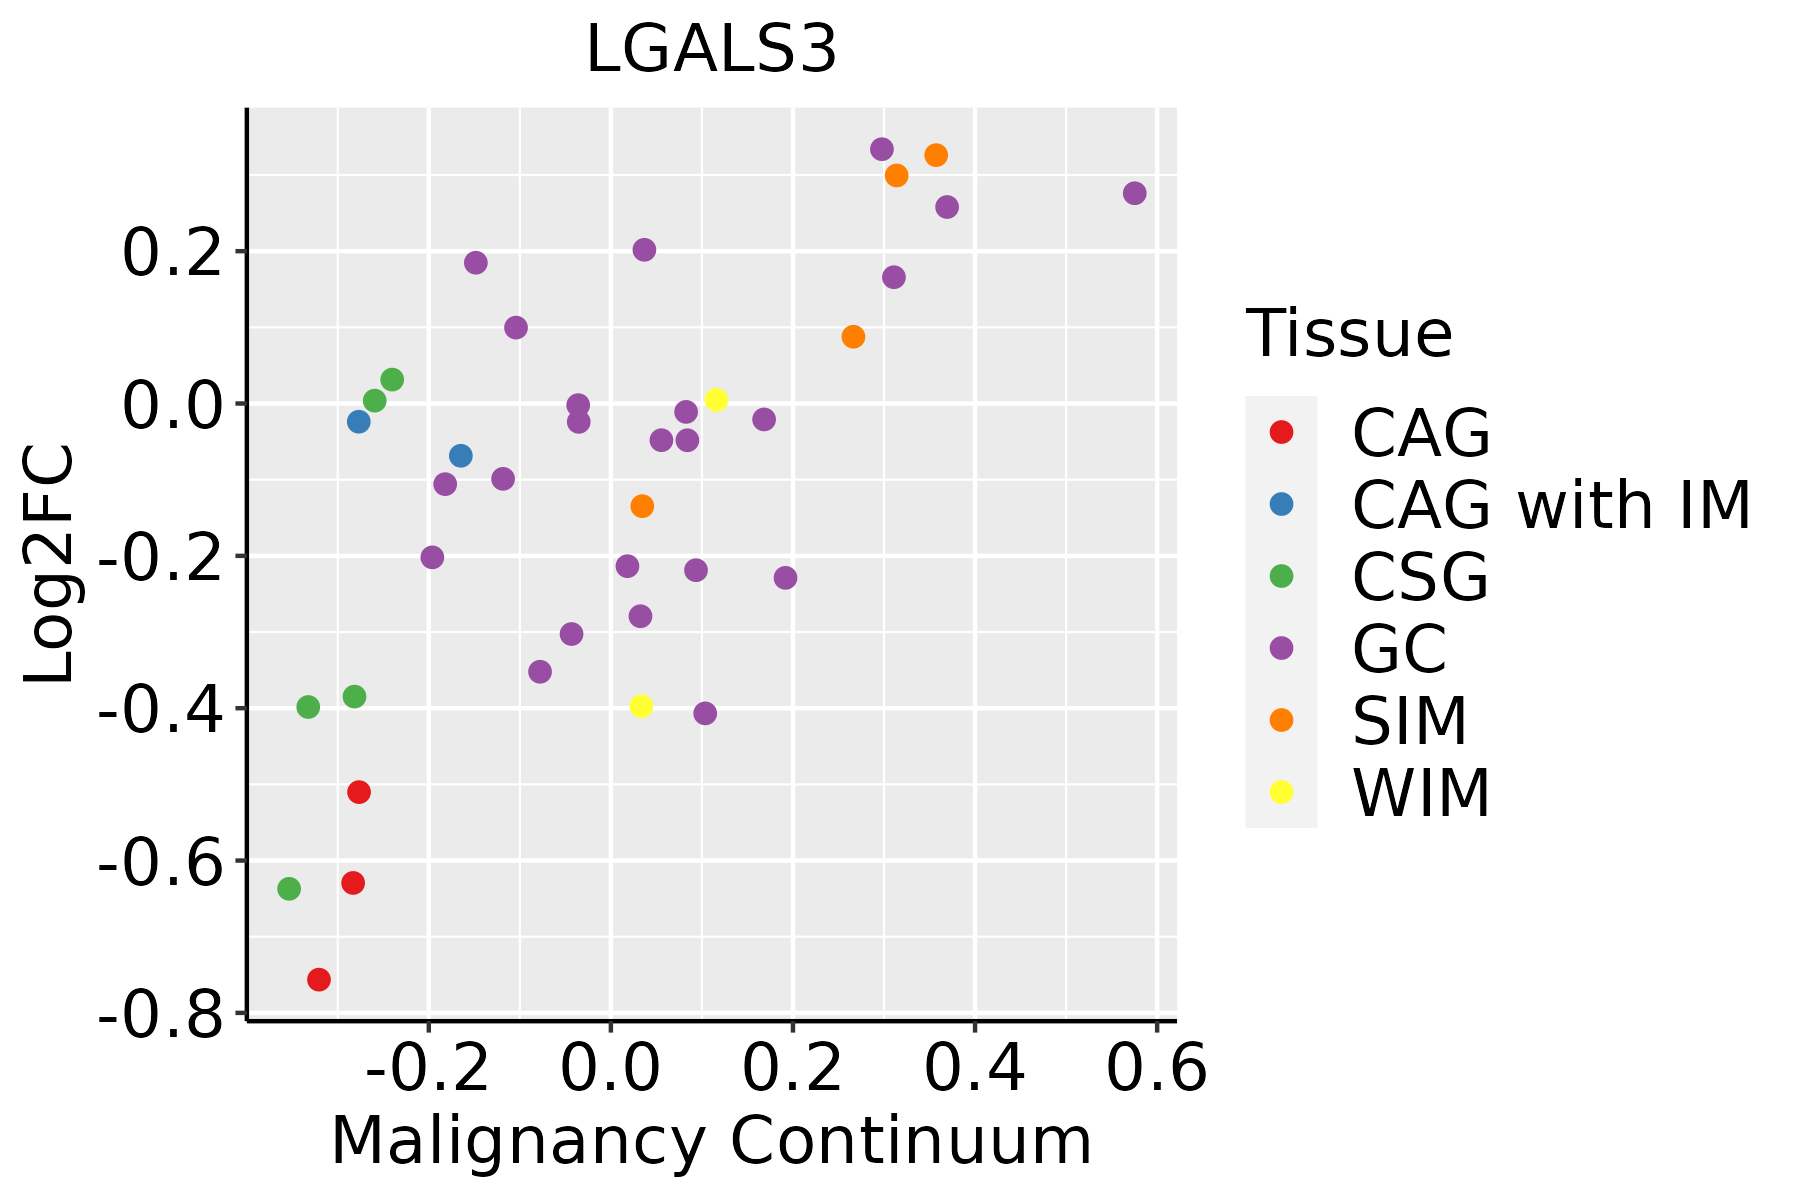 | CAG: Chronic atrophic gastritis |
| CAG with IM: Chronic atrophic gastritis with intestinal metaplasia | ||
| CSG: Chronic superficial gastritis | ||
| GC: Gastric cancer | ||
| SIM: Severe intestinal metaplasia | ||
| WIM: Wild intestinal metaplasia | ||
| Liver | 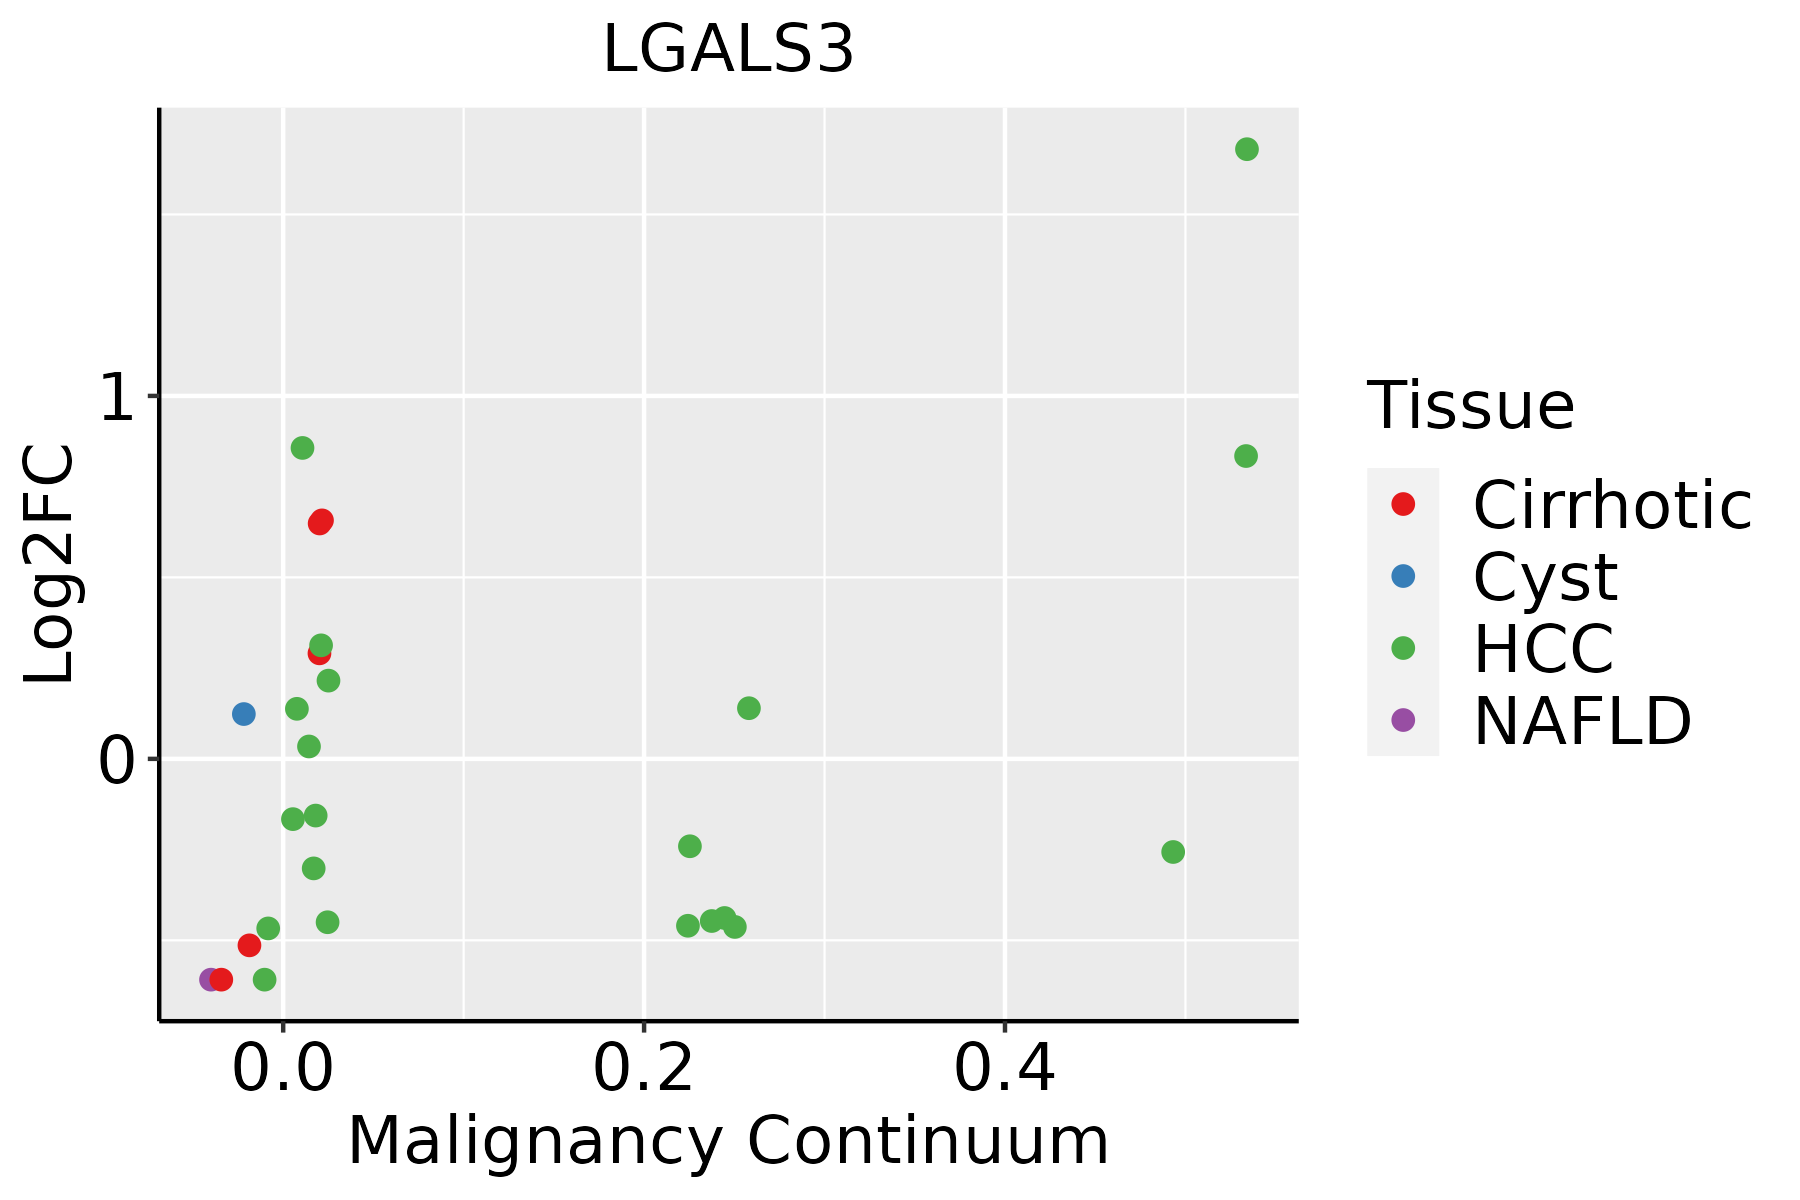 | HCC: Hepatocellular carcinoma |
| NAFLD: Non-alcoholic fatty liver disease | ||
| Oral Cavity | 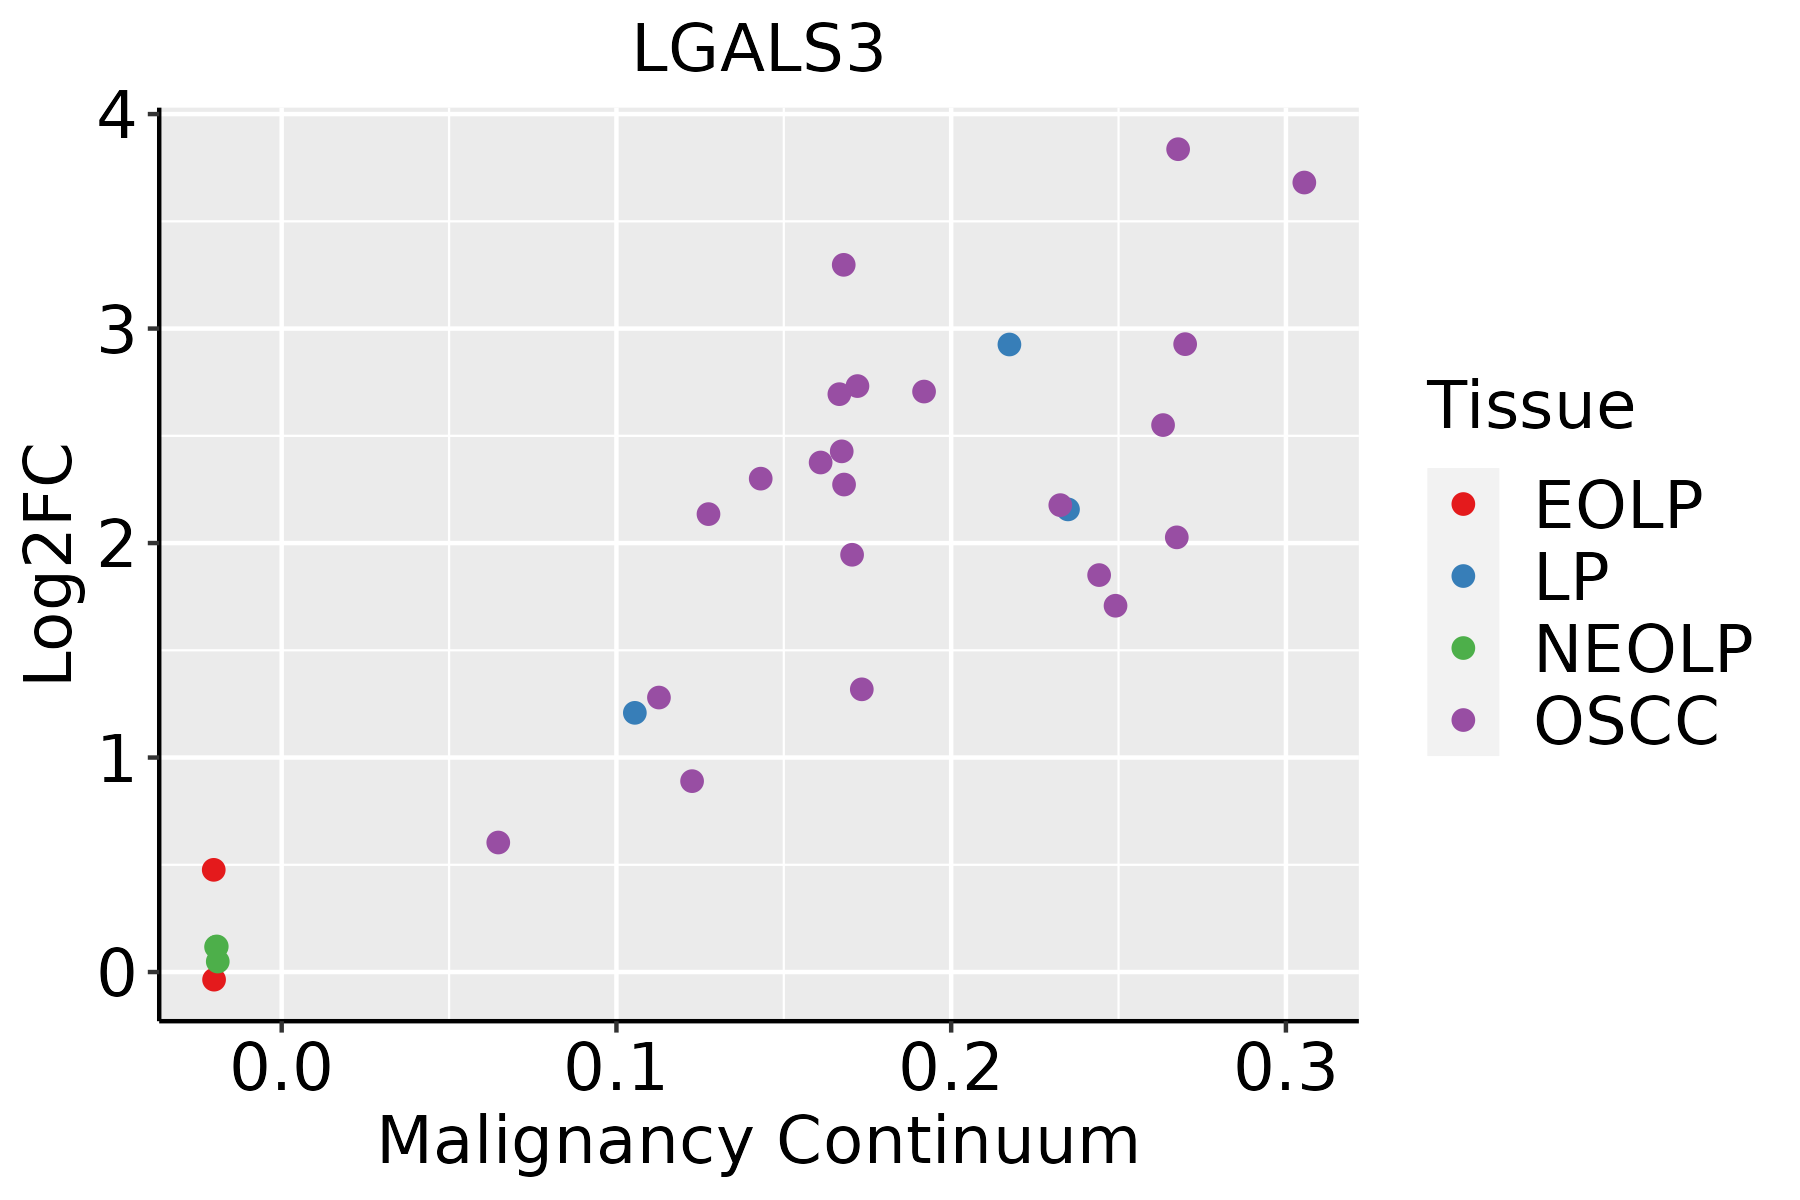 | EOLP: Erosive Oral lichen planus |
| LP: leukoplakia | ||
| NEOLP: Non-erosive oral lichen planus | ||
| OSCC: Oral squamous cell carcinoma | ||
| Prostate | 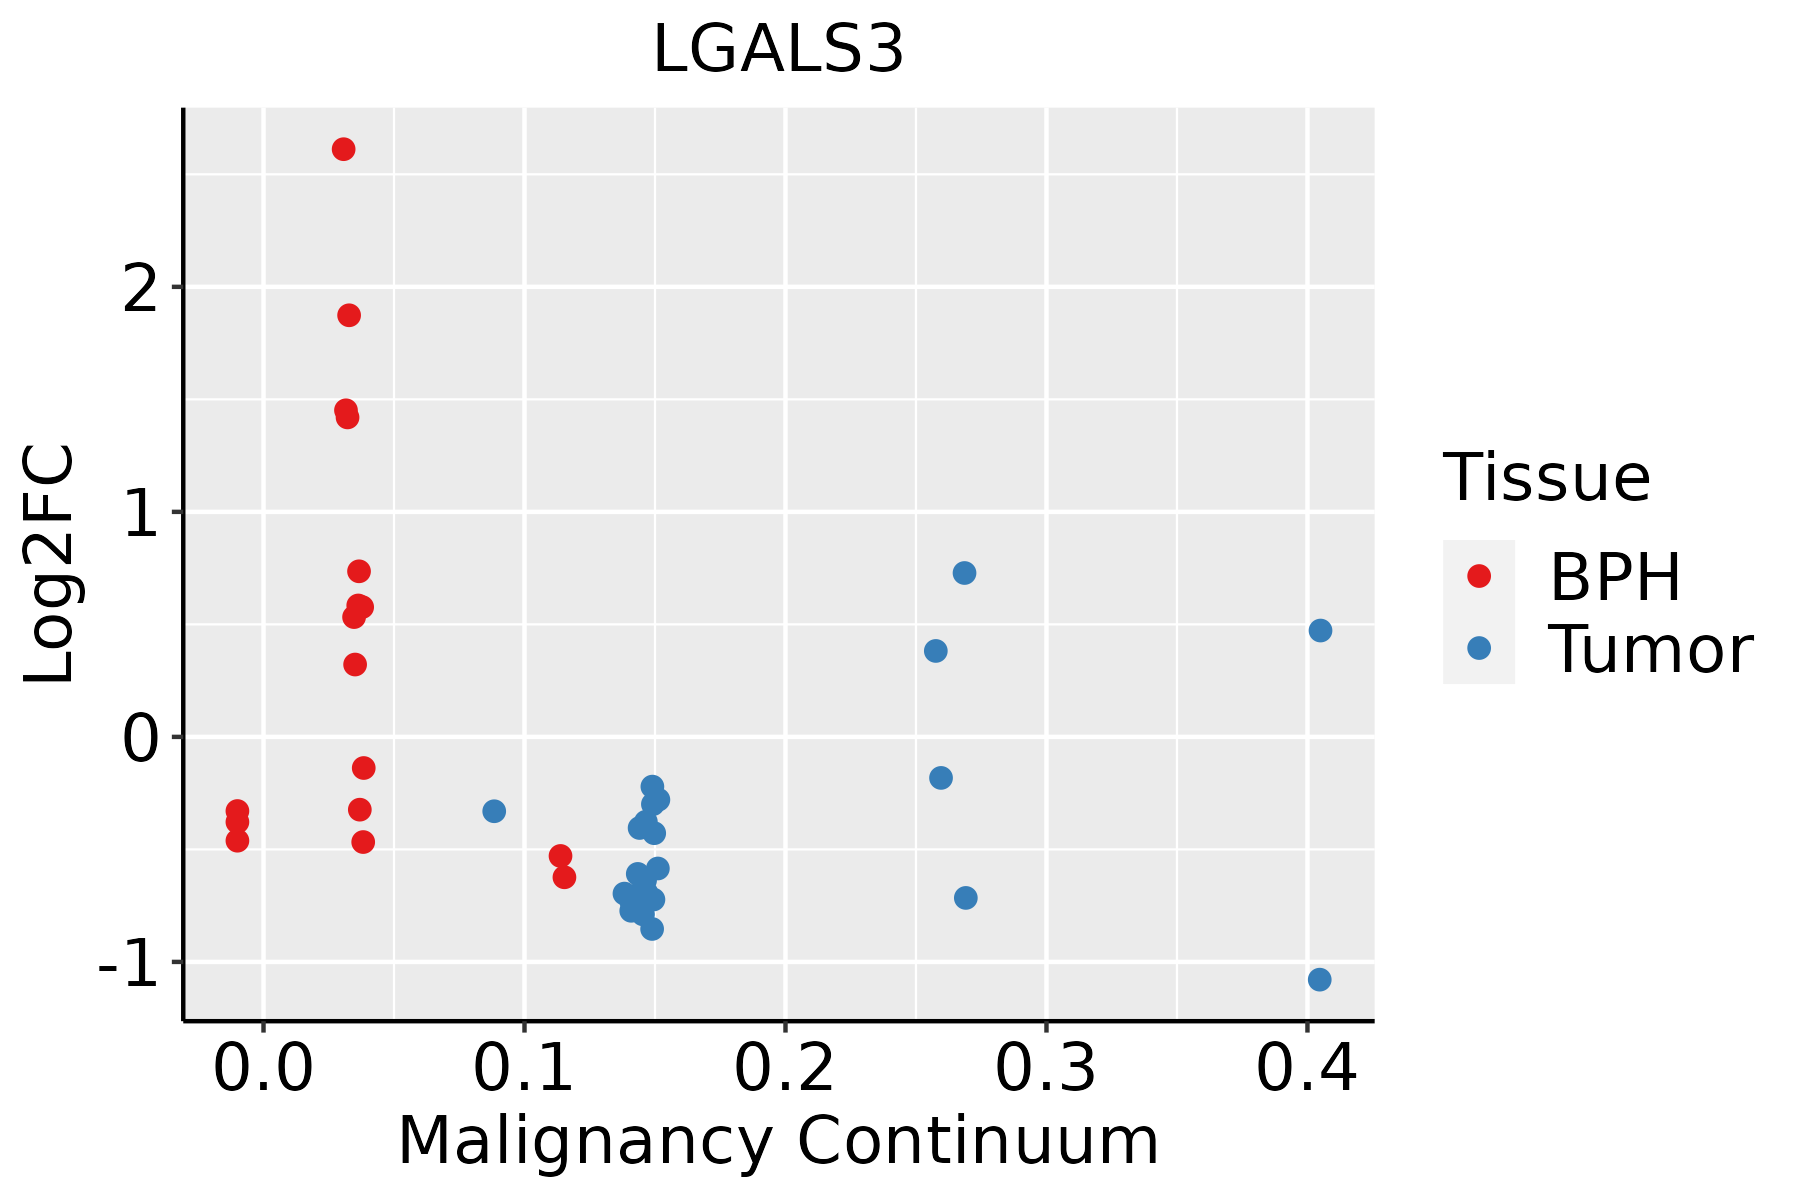 | BPH: Benign Prostatic Hyperplasia |
| Skin |  | AK: Actinic keratosis |
| cSCC: Cutaneous squamous cell carcinoma | ||
| SCCIS:squamous cell carcinoma in situ | ||
| Thyroid | 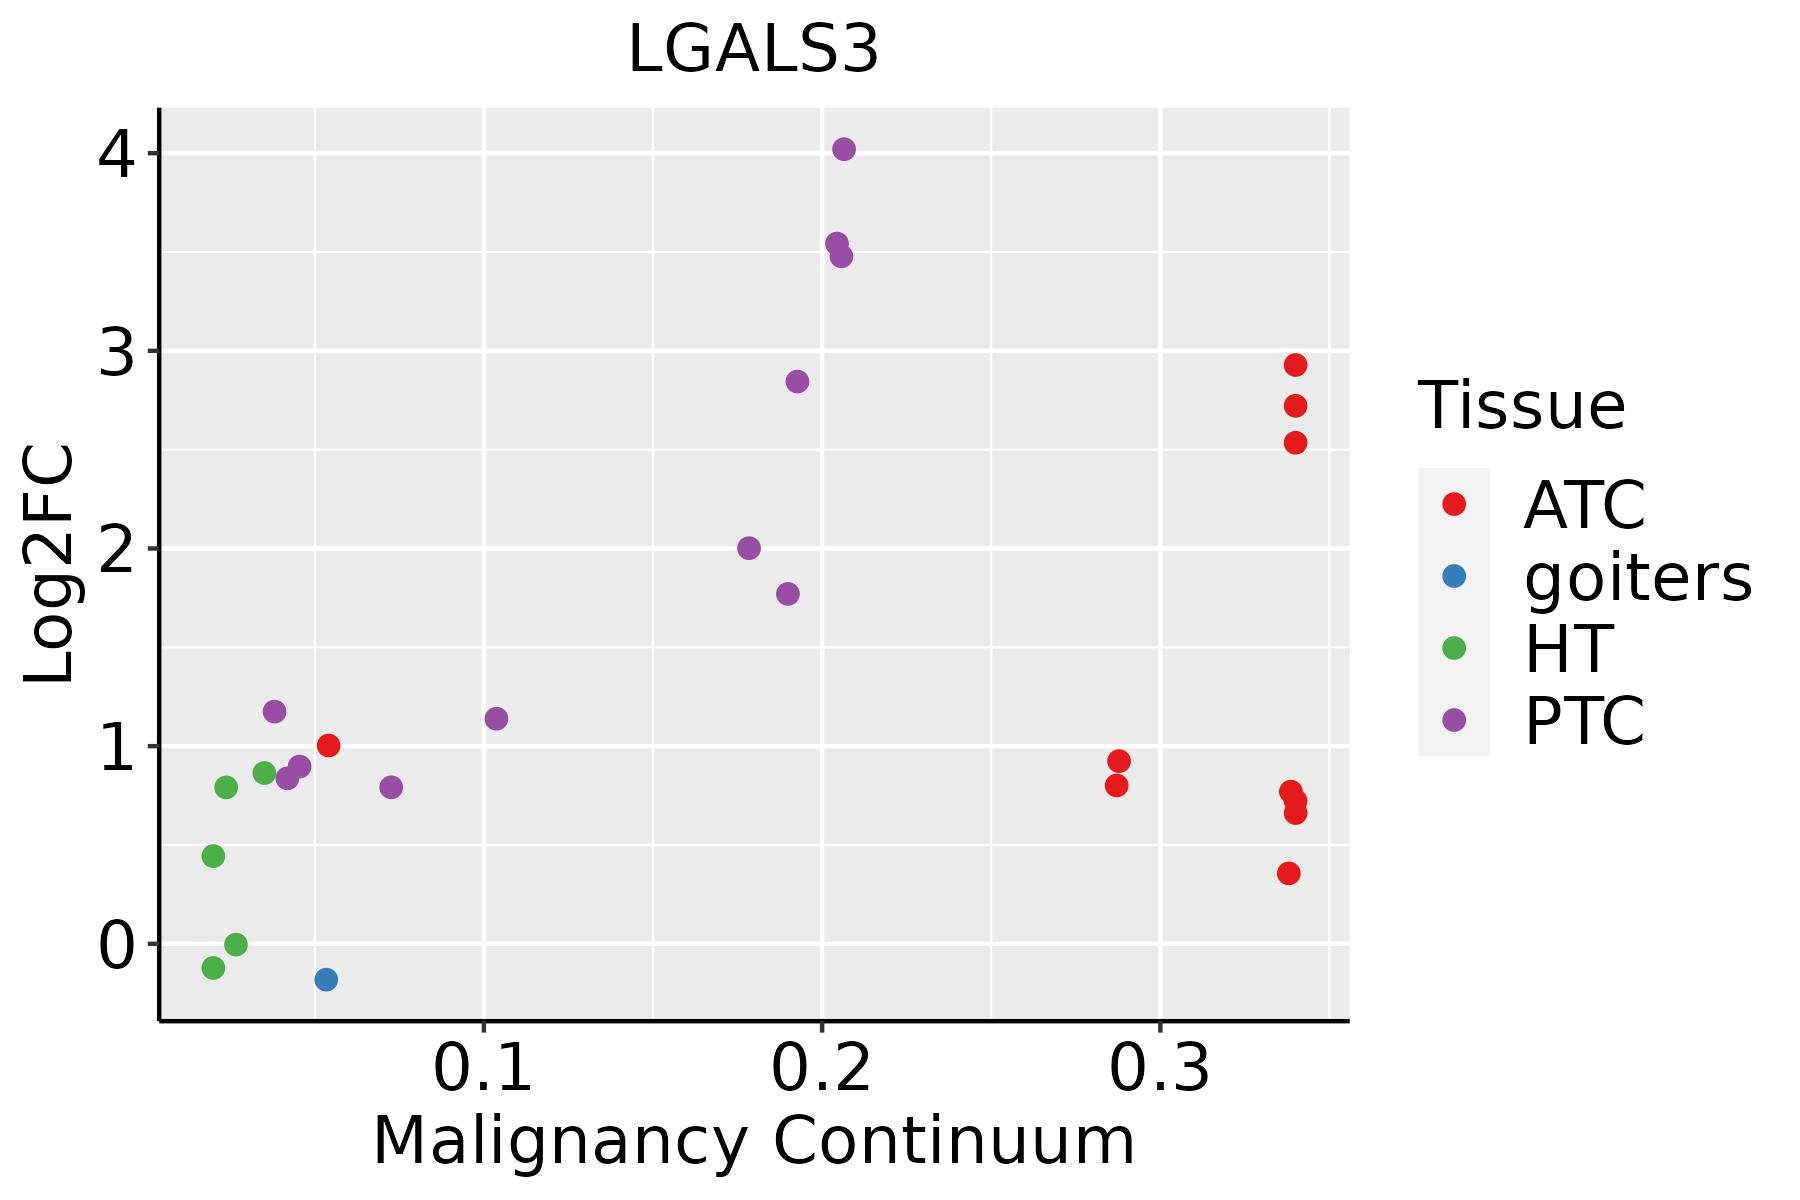 | ATC: Anaplastic thyroid cancer |
| HT: Hashimoto's thyroiditis | ||
| PTC: Papillary thyroid cancer |
| ∗log2FC in expression of this searched gene in stem-like cells from each diseased tissue sample relative to stem-like cells in normal samples in each tissue plotted against the malignancy continuum. Samples are colored based on if they are from different disease stage. |
Top |
Malignant transformation related pathway analysis |
| Find out the enriched GO biological processes and KEGG pathways involved in transition from healthy to precancer to cancer |
| Tissue | Disease Stage | Enriched GO biological Processes |
| Colorectum | AD |  |
| Colorectum | SER |  |
| Colorectum | MSS |  |
| Colorectum | MSI-H |  |
| Colorectum | FAP |  |
| ∗Top 15 enriched GO BP terms are showed in the bar plot of each disease state in each tissue. Each row represents a significant GO biological process which is colored according to the -log10(p.adjust). |
| Page: 1 2 3 4 5 6 7 8 9 |
| GO ID | Tissue | Disease Stage | Description | Gene Ratio | Bg Ratio | pvalue | p.adjust | Count |
| GO:20012339 | Breast | Precancer | regulation of apoptotic signaling pathway | 65/1080 | 356/18723 | 7.70e-17 | 3.17e-14 | 65 |
| GO:00083809 | Breast | Precancer | RNA splicing | 65/1080 | 434/18723 | 1.27e-12 | 2.53e-10 | 65 |
| GO:20012349 | Breast | Precancer | negative regulation of apoptotic signaling pathway | 39/1080 | 224/18723 | 5.35e-10 | 4.77e-08 | 39 |
| GO:00513468 | Breast | Precancer | negative regulation of hydrolase activity | 50/1080 | 379/18723 | 3.85e-08 | 2.34e-06 | 50 |
| GO:00975297 | Breast | Precancer | myeloid leukocyte migration | 34/1080 | 220/18723 | 1.42e-07 | 7.82e-06 | 34 |
| GO:00509006 | Breast | Precancer | leukocyte migration | 47/1080 | 369/18723 | 2.82e-07 | 1.39e-05 | 47 |
| GO:00305956 | Breast | Precancer | leukocyte chemotaxis | 34/1080 | 230/18723 | 4.16e-07 | 1.89e-05 | 34 |
| GO:00603266 | Breast | Precancer | cell chemotaxis | 41/1080 | 310/18723 | 5.99e-07 | 2.55e-05 | 41 |
| GO:00716217 | Breast | Precancer | granulocyte chemotaxis | 23/1080 | 125/18723 | 6.73e-07 | 2.77e-05 | 23 |
| GO:00432549 | Breast | Precancer | regulation of protein-containing complex assembly | 50/1080 | 428/18723 | 1.63e-06 | 5.97e-05 | 50 |
| GO:00313349 | Breast | Precancer | positive regulation of protein-containing complex assembly | 33/1080 | 237/18723 | 2.39e-06 | 8.21e-05 | 33 |
| GO:00975307 | Breast | Precancer | granulocyte migration | 24/1080 | 148/18723 | 4.04e-06 | 1.26e-04 | 24 |
| GO:20012369 | Breast | Precancer | regulation of extrinsic apoptotic signaling pathway | 24/1080 | 151/18723 | 5.78e-06 | 1.70e-04 | 24 |
| GO:00305937 | Breast | Precancer | neutrophil chemotaxis | 19/1080 | 103/18723 | 5.94e-06 | 1.71e-04 | 19 |
| GO:00971919 | Breast | Precancer | extrinsic apoptotic signaling pathway | 30/1080 | 219/18723 | 9.42e-06 | 2.50e-04 | 30 |
| GO:00421107 | Breast | Precancer | T cell activation | 52/1080 | 487/18723 | 1.37e-05 | 3.42e-04 | 52 |
| GO:19902665 | Breast | Precancer | neutrophil migration | 20/1080 | 122/18723 | 2.13e-05 | 4.99e-04 | 20 |
| GO:00026856 | Breast | Precancer | regulation of leukocyte migration | 27/1080 | 210/18723 | 7.93e-05 | 1.54e-03 | 27 |
| GO:00508637 | Breast | Precancer | regulation of T cell activation | 37/1080 | 329/18723 | 8.04e-05 | 1.56e-03 | 37 |
| GO:00071597 | Breast | Precancer | leukocyte cell-cell adhesion | 40/1080 | 371/18723 | 1.07e-04 | 1.94e-03 | 40 |
| Page: 1 2 3 4 5 6 7 8 9 10 11 12 13 14 15 16 17 18 19 20 21 22 23 24 25 26 27 28 29 30 31 32 33 34 35 36 37 38 39 40 41 42 43 44 45 46 47 48 49 50 51 52 53 54 55 56 57 58 59 60 61 62 63 64 65 66 67 68 69 70 71 72 73 74 75 76 77 78 79 80 81 82 83 84 |
| Pathway ID | Tissue | Disease Stage | Description | Gene Ratio | Bg Ratio | pvalue | p.adjust | qvalue | Count |
| Page: 1 |
Top |
Cell-cell communication analysis |
| Identification of potential cell-cell interactions between two cell types and their ligand-receptor pairs for different disease states |
| Ligand | Receptor | LRpair | Pathway | Tissue | Disease Stage |
| Page: 1 |
Top |
Single-cell gene regulatory network inference analysis |
| Find out the significant the regulons (TFs) and the target genes of each regulon across cell types for different disease states |
| TF | Cell Type | Tissue | Disease Stage | Target Gene | RSS | Regulon Activity |
| ∗The dot plots of a searched regulon are shown for all cell subpopulations in each disease state of each tissue based on the regulon specific score inferred using pySCENIC and by calculating the average expression. |
| Page: 1 |
Top |
Somatic mutation of malignant transformation related genes |
| Annotation of somatic variants for genes involved in malignant transformation |
| Hugo Symbol | Variant Class | Variant Classification | dbSNP RS | HGVSc | HGVSp | HGVSp Short | SWISSPROT | BIOTYPE | SIFT | PolyPhen | Tumor Sample Barcode | Tissue | Histology | Sex | Age | Stage | Therapy Types | Drugs | Outcome |
| LGALS3 | SNV | Missense_Mutation | c.649C>T | p.His217Tyr | p.H217Y | P17931 | protein_coding | deleterious(0.03) | probably_damaging(0.915) | TCGA-D8-A27G-01 | Breast | breast invasive carcinoma | Female | >=65 | I/II | Unknown | Unknown | SD | |
| LGALS3 | SNV | Missense_Mutation | c.594C>G | p.Phe198Leu | p.F198L | P17931 | protein_coding | deleterious(0) | probably_damaging(0.996) | TCGA-IR-A3LK-01 | Cervix | cervical & endocervical cancer | Female | >=65 | I/II | Chemotherapy | cisplatin | PD | |
| LGALS3 | SNV | Missense_Mutation | novel | c.734N>T | p.Ala245Val | p.A245V | P17931 | protein_coding | tolerated(1) | benign(0.044) | TCGA-AA-3877-01 | Colorectum | colon adenocarcinoma | Female | >=65 | I/II | Unknown | Unknown | SD |
| LGALS3 | SNV | Missense_Mutation | c.193N>A | p.Gly65Arg | p.G65R | P17931 | protein_coding | deleterious(0) | possibly_damaging(0.619) | TCGA-AD-5900-01 | Colorectum | colon adenocarcinoma | Male | >=65 | I/II | Unknown | Unknown | SD | |
| LGALS3 | SNV | Missense_Mutation | c.182N>A | p.Gly61Asp | p.G61D | P17931 | protein_coding | deleterious(0.03) | possibly_damaging(0.684) | TCGA-AY-A69D-01 | Colorectum | colon adenocarcinoma | Female | <65 | I/II | Unknown | Unknown | SD | |
| LGALS3 | SNV | Missense_Mutation | rs201398647 | c.386N>A | p.Arg129His | p.R129H | P17931 | protein_coding | deleterious(0.01) | benign(0.03) | TCGA-D5-6530-01 | Colorectum | colon adenocarcinoma | Male | <65 | I/II | Unknown | Unknown | SD |
| LGALS3 | SNV | Missense_Mutation | c.695G>A | p.Ser232Asn | p.S232N | P17931 | protein_coding | tolerated(1) | benign(0) | TCGA-D1-A0ZO-01 | Endometrium | uterine corpus endometrioid carcinoma | Female | >=65 | I/II | Unknown | Unknown | SD | |
| LGALS3 | SNV | Missense_Mutation | novel | c.367N>T | p.Pro123Ser | p.P123S | P17931 | protein_coding | deleterious(0.03) | benign(0.013) | TCGA-EO-A22R-01 | Endometrium | uterine corpus endometrioid carcinoma | Female | <65 | I/II | Unknown | Unknown | SD |
| LGALS3 | deletion | Frame_Shift_Del | novel | c.152delC | p.Pro51GlnfsTer64 | p.P51Qfs*64 | P17931 | protein_coding | TCGA-B5-A0K6-01 | Endometrium | uterine corpus endometrioid carcinoma | Female | <65 | I/II | Unknown | Unknown | SD | ||
| LGALS3 | SNV | Missense_Mutation | novel | c.38N>T | p.Gly13Val | p.G13V | P17931 | protein_coding | deleterious(0) | probably_damaging(0.999) | TCGA-49-AAR4-01 | Lung | lung adenocarcinoma | Male | <65 | III/IV | Chemotherapy | taxol | PD |
| Page: 1 2 |
Top |
Related drugs of malignant transformation related genes |
| Identification of chemicals and drugs interact with genes involved in malignant transfromation |
| (DGIdb 4.0) |
| Entrez ID | Symbol | Category | Interaction Types | Drug Claim Name | Drug Name | PMIDs |
| 3958 | LGALS3 | CELL SURFACE, DRUGGABLE GENOME | LACTOSE, ANHYDROUS | LACTOSE, ANHYDROUS | 21524586 | |
| 3958 | LGALS3 | CELL SURFACE, DRUGGABLE GENOME | GR-MD-02 | BELAPECTIN | ||
| 3958 | LGALS3 | CELL SURFACE, DRUGGABLE GENOME | Antibiotics | 25869013 |
| Page: 1 |

Copyright 2023-Present -The University of Texas Health Science Center at Houston |