
|
|||||
|
 | |
| |
| |
| |
| |
| |
|
Gene: LFNG |
Gene summary for LFNG |
| Gene information | Species | Human | Gene symbol | LFNG | Gene ID | 3955 |
| Gene name | LFNG O-fucosylpeptide 3-beta-N-acetylglucosaminyltransferase | |
| Gene Alias | SCDO3 | |
| Cytomap | 7p22.3 | |
| Gene Type | protein-coding | GO ID | GO:0001756 | UniProtAcc | Q8NES3 |
Top |
Malignant transformation analysis |
| Identification of the aberrant gene expression in precancerous and cancerous lesions by comparing the gene expression of stem-like cells in diseased tissues with normal stem cells |
| Entrez ID | Symbol | Replicates | Species | Organ | Tissue | Adj P-value | Log2FC | Malignancy |
| 3955 | LFNG | HTA11_1938_2000001011 | Human | Colorectum | AD | 4.88e-03 | 2.68e-01 | -0.0811 |
| 3955 | LFNG | HTA11_347_2000001011 | Human | Colorectum | AD | 2.02e-03 | 1.84e-01 | -0.1954 |
| 3955 | LFNG | HTA11_696_2000001011 | Human | Colorectum | AD | 2.84e-02 | 1.80e-01 | -0.1464 |
| 3955 | LFNG | HTA11_7696_3000711011 | Human | Colorectum | AD | 3.20e-05 | 2.44e-01 | 0.0674 |
| 3955 | LFNG | HTA11_6818_2000001021 | Human | Colorectum | AD | 1.03e-02 | 3.14e-01 | 0.0588 |
| 3955 | LFNG | HTA11_99999970781_79442 | Human | Colorectum | MSS | 1.67e-02 | 1.76e-01 | 0.294 |
| 3955 | LFNG | HTA11_99999971662_82457 | Human | Colorectum | MSS | 1.65e-03 | 1.83e-01 | 0.3859 |
| 3955 | LFNG | CRC-1-8810 | Human | Colorectum | CRC | 1.69e-02 | 2.88e-01 | 0.6257 |
| 3955 | LFNG | CRC-3-11773 | Human | Colorectum | CRC | 4.43e-09 | 5.23e-01 | 0.2564 |
| 3955 | LFNG | C04 | Human | Oral cavity | OSCC | 2.60e-09 | 6.42e-01 | 0.2633 |
| 3955 | LFNG | C21 | Human | Oral cavity | OSCC | 3.22e-06 | 2.94e-01 | 0.2678 |
| 3955 | LFNG | C30 | Human | Oral cavity | OSCC | 1.22e-31 | 1.38e+00 | 0.3055 |
| 3955 | LFNG | C51 | Human | Oral cavity | OSCC | 8.33e-17 | 7.98e-01 | 0.2674 |
| 3955 | LFNG | SYSMH2 | Human | Oral cavity | OSCC | 2.88e-03 | 1.40e-01 | 0.2326 |
| 3955 | LFNG | SYSMH3 | Human | Oral cavity | OSCC | 4.83e-23 | 5.90e-01 | 0.2442 |
| 3955 | LFNG | SYSMH4 | Human | Oral cavity | OSCC | 2.12e-12 | 2.90e-01 | 0.1226 |
| 3955 | LFNG | SYSMH5 | Human | Oral cavity | OSCC | 1.46e-11 | 2.53e-01 | 0.0647 |
| 3955 | LFNG | SYSMH6 | Human | Oral cavity | OSCC | 5.95e-04 | 1.72e-01 | 0.1275 |
| 3955 | LFNG | P1_S1_AK | Human | Skin | AK | 5.94e-03 | 1.81e-01 | -0.3399 |
| 3955 | LFNG | P2_S3_AK | Human | Skin | AK | 2.63e-02 | 2.27e-01 | -0.3287 |
| Page: 1 2 |
| Tissue | Expression Dynamics | Abbreviation |
| Colorectum (GSE201348) |  | FAP: Familial adenomatous polyposis |
| CRC: Colorectal cancer | ||
| Colorectum (HTA11) |  | AD: Adenomas |
| SER: Sessile serrated lesions | ||
| MSI-H: Microsatellite-high colorectal cancer | ||
| MSS: Microsatellite stable colorectal cancer | ||
| Oral Cavity | 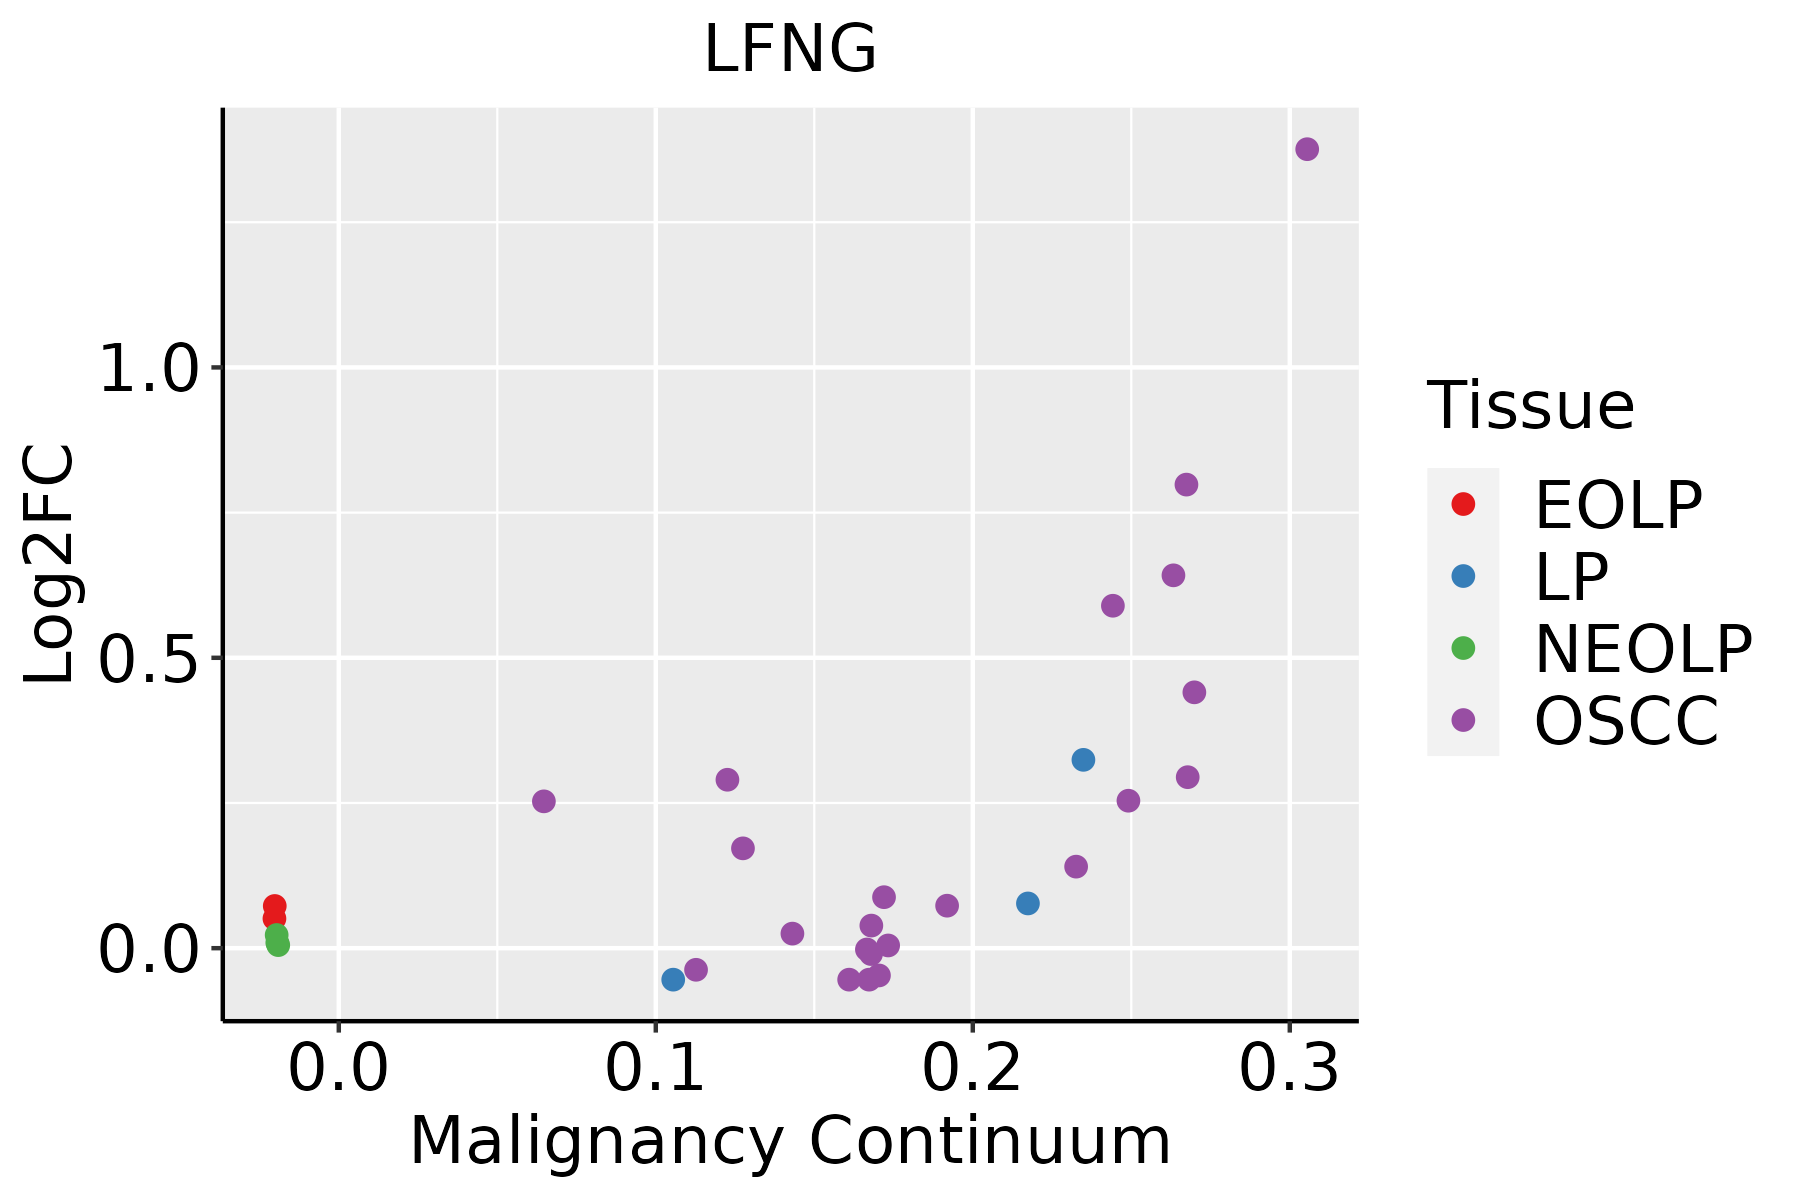 | EOLP: Erosive Oral lichen planus |
| LP: leukoplakia | ||
| NEOLP: Non-erosive oral lichen planus | ||
| OSCC: Oral squamous cell carcinoma | ||
| Skin |  | AK: Actinic keratosis |
| cSCC: Cutaneous squamous cell carcinoma | ||
| SCCIS:squamous cell carcinoma in situ |
| ∗log2FC in expression of this searched gene in stem-like cells from each diseased tissue sample relative to stem-like cells in normal samples in each tissue plotted against the malignancy continuum. Samples are colored based on if they are from different disease stage. |
Top |
Malignant transformation related pathway analysis |
| Find out the enriched GO biological processes and KEGG pathways involved in transition from healthy to precancer to cancer |
| Tissue | Disease Stage | Enriched GO biological Processes |
| Colorectum | AD |  |
| Colorectum | SER |  |
| Colorectum | MSS |  |
| Colorectum | MSI-H |  |
| Colorectum | FAP |  |
| ∗Top 15 enriched GO BP terms are showed in the bar plot of each disease state in each tissue. Each row represents a significant GO biological process which is colored according to the -log10(p.adjust). |
| Page: 1 2 3 4 5 6 7 8 9 |
| GO ID | Tissue | Disease Stage | Description | Gene Ratio | Bg Ratio | pvalue | p.adjust | Count |
| GO:0007219 | Colorectum | AD | Notch signaling pathway | 50/3918 | 172/18723 | 6.92e-03 | 4.26e-02 | 50 |
| GO:00072192 | Colorectum | CRC | Notch signaling pathway | 36/2078 | 172/18723 | 1.26e-04 | 2.42e-03 | 36 |
| GO:0008593 | Colorectum | CRC | regulation of Notch signaling pathway | 21/2078 | 95/18723 | 1.48e-03 | 1.58e-02 | 21 |
| GO:00099521 | Colorectum | CRC | anterior/posterior pattern specification | 36/2078 | 201/18723 | 2.56e-03 | 2.40e-02 | 36 |
| GO:004211016 | Oral cavity | OSCC | T cell activation | 245/7305 | 487/18723 | 2.00e-07 | 3.22e-06 | 245 |
| GO:19031316 | Oral cavity | OSCC | mononuclear cell differentiation | 210/7305 | 426/18723 | 8.44e-06 | 9.02e-05 | 210 |
| GO:00072196 | Oral cavity | OSCC | Notch signaling pathway | 92/7305 | 172/18723 | 7.84e-05 | 6.08e-04 | 92 |
| GO:00300983 | Oral cavity | OSCC | lymphocyte differentiation | 179/7305 | 374/18723 | 2.74e-04 | 1.74e-03 | 179 |
| GO:00302175 | Oral cavity | OSCC | T cell differentiation | 126/7305 | 257/18723 | 6.51e-04 | 3.66e-03 | 126 |
| GO:00085934 | Oral cavity | OSCC | regulation of Notch signaling pathway | 53/7305 | 95/18723 | 6.64e-04 | 3.72e-03 | 53 |
| GO:004211019 | Skin | AK | T cell activation | 85/1910 | 487/18723 | 5.16e-07 | 1.85e-05 | 85 |
| GO:00302177 | Skin | AK | T cell differentiation | 46/1910 | 257/18723 | 1.10e-04 | 1.42e-03 | 46 |
| GO:00072198 | Skin | AK | Notch signaling pathway | 34/1910 | 172/18723 | 1.20e-04 | 1.50e-03 | 34 |
| GO:00085936 | Skin | AK | regulation of Notch signaling pathway | 21/1910 | 95/18723 | 4.96e-04 | 4.58e-03 | 21 |
| GO:19031318 | Skin | AK | mononuclear cell differentiation | 65/1910 | 426/18723 | 6.24e-04 | 5.45e-03 | 65 |
| GO:00300985 | Skin | AK | lymphocyte differentiation | 57/1910 | 374/18723 | 1.34e-03 | 1.00e-02 | 57 |
| GO:000721922 | Skin | cSCC | Notch signaling pathway | 60/4864 | 172/18723 | 5.82e-03 | 2.87e-02 | 60 |
| Page: 1 |
| Pathway ID | Tissue | Disease Stage | Description | Gene Ratio | Bg Ratio | pvalue | p.adjust | qvalue | Count |
| hsa051659 | Oral cavity | OSCC | Human papillomavirus infection | 200/3704 | 331/8465 | 3.83e-10 | 4.93e-09 | 2.51e-09 | 200 |
| hsa043305 | Oral cavity | OSCC | Notch signaling pathway | 44/3704 | 62/8465 | 1.26e-05 | 5.55e-05 | 2.83e-05 | 44 |
| hsa0516514 | Oral cavity | OSCC | Human papillomavirus infection | 200/3704 | 331/8465 | 3.83e-10 | 4.93e-09 | 2.51e-09 | 200 |
| hsa0433012 | Oral cavity | OSCC | Notch signaling pathway | 44/3704 | 62/8465 | 1.26e-05 | 5.55e-05 | 2.83e-05 | 44 |
| Page: 1 |
Top |
Cell-cell communication analysis |
| Identification of potential cell-cell interactions between two cell types and their ligand-receptor pairs for different disease states |
| Ligand | Receptor | LRpair | Pathway | Tissue | Disease Stage |
| Page: 1 |
Top |
Single-cell gene regulatory network inference analysis |
| Find out the significant the regulons (TFs) and the target genes of each regulon across cell types for different disease states |
| TF | Cell Type | Tissue | Disease Stage | Target Gene | RSS | Regulon Activity |
| ∗The dot plots of a searched regulon are shown for all cell subpopulations in each disease state of each tissue based on the regulon specific score inferred using pySCENIC and by calculating the average expression. |
| Page: 1 |
Top |
Somatic mutation of malignant transformation related genes |
| Annotation of somatic variants for genes involved in malignant transformation |
| Hugo Symbol | Variant Class | Variant Classification | dbSNP RS | HGVSc | HGVSp | HGVSp Short | SWISSPROT | BIOTYPE | SIFT | PolyPhen | Tumor Sample Barcode | Tissue | Histology | Sex | Age | Stage | Therapy Types | Drugs | Outcome |
| LFNG | SNV | Missense_Mutation | rs76051534 | c.673N>A | p.Val225Ile | p.V225I | Q8NES3 | protein_coding | tolerated(1) | benign(0.014) | TCGA-D8-A27F-01 | Breast | breast invasive carcinoma | Female | <65 | I/II | Chemotherapy | adriamycin+cyclophosphamide | SD |
| LFNG | SNV | Missense_Mutation | c.511N>T | p.Ala171Ser | p.A171S | Q8NES3 | protein_coding | tolerated(0.19) | benign(0.107) | TCGA-FU-A3TQ-01 | Cervix | cervical & endocervical cancer | Female | <65 | III/IV | Unknown | Unknown | SD | |
| LFNG | SNV | Missense_Mutation | c.670N>C | p.Tyr224His | p.Y224H | Q8NES3 | protein_coding | deleterious(0) | probably_damaging(0.999) | TCGA-AZ-6608-01 | Colorectum | colon adenocarcinoma | Female | <65 | III/IV | Unknown | Unknown | SD | |
| LFNG | SNV | Missense_Mutation | novel | c.704N>C | p.Gln235Pro | p.Q235P | Q8NES3 | protein_coding | deleterious(0.01) | possibly_damaging(0.845) | TCGA-D5-6538-01 | Colorectum | colon adenocarcinoma | Female | >=65 | III/IV | Chemotherapy | xeloda | SD |
| LFNG | SNV | Missense_Mutation | rs373426024 | c.520N>T | p.Arg174Cys | p.R174C | Q8NES3 | protein_coding | deleterious(0) | probably_damaging(1) | TCGA-D5-6540-01 | Colorectum | colon adenocarcinoma | Male | >=65 | I/II | Unknown | Unknown | SD |
| LFNG | SNV | Missense_Mutation | rs377387325 | c.661N>T | p.Arg221Trp | p.R221W | Q8NES3 | protein_coding | tolerated(0.12) | benign(0.022) | TCGA-G4-6304-01 | Colorectum | colon adenocarcinoma | Female | >=65 | I/II | Chemotherapy | fluorouracil | PD |
| LFNG | SNV | Missense_Mutation | rs868274958 | c.545C>T | p.Ala182Val | p.A182V | Q8NES3 | protein_coding | deleterious(0) | probably_damaging(0.943) | TCGA-G4-6309-01 | Colorectum | colon adenocarcinoma | Female | <65 | III/IV | Chemotherapy | xeloda | PD |
| LFNG | SNV | Missense_Mutation | novel | c.700N>G | p.Ile234Val | p.I234V | Q8NES3 | protein_coding | deleterious(0.03) | possibly_damaging(0.456) | TCGA-A5-A2K7-01 | Endometrium | uterine corpus endometrioid carcinoma | Female | <65 | I/II | Chemotherapy | taxol | SD |
| LFNG | SNV | Missense_Mutation | novel | c.131N>T | p.Arg44Ile | p.R44I | Q8NES3 | protein_coding | deleterious_low_confidence(0) | benign(0.048) | TCGA-AJ-A3EL-01 | Endometrium | uterine corpus endometrioid carcinoma | Female | <65 | I/II | Unknown | Unknown | SD |
| LFNG | SNV | Missense_Mutation | rs756209984 | c.199N>A | p.Gly67Arg | p.G67R | Q8NES3 | protein_coding | tolerated_low_confidence(0.49) | benign(0.007) | TCGA-AP-A1DV-01 | Endometrium | uterine corpus endometrioid carcinoma | Female | <65 | I/II | Unknown | Unknown | SD |
| Page: 1 2 3 |
Top |
Related drugs of malignant transformation related genes |
| Identification of chemicals and drugs interact with genes involved in malignant transfromation |
| (DGIdb 4.0) |
| Entrez ID | Symbol | Category | Interaction Types | Drug Claim Name | Drug Name | PMIDs |
| Page: 1 |

Copyright 2023-Present -The University of Texas Health Science Center at Houston |