
|
|||||
|
 | |
| |
| |
| |
| |
| |
|
Gene: LETM2 |
Gene summary for LETM2 |
| Gene information | Species | Human | Gene symbol | LETM2 | Gene ID | 137994 |
| Gene name | leucine zipper and EF-hand containing transmembrane protein 2 | |
| Gene Alias | SLC55A2 | |
| Cytomap | 8p11.23 | |
| Gene Type | protein-coding | GO ID | GO:0006873 | UniProtAcc | Q2VYF4 |
Top |
Malignant transformation analysis |
| Identification of the aberrant gene expression in precancerous and cancerous lesions by comparing the gene expression of stem-like cells in diseased tissues with normal stem cells |
| Entrez ID | Symbol | Replicates | Species | Organ | Tissue | Adj P-value | Log2FC | Malignancy |
| 137994 | LETM2 | LZE20T | Human | Esophagus | ESCC | 3.15e-06 | 2.16e-01 | 0.0662 |
| 137994 | LETM2 | P1T-E | Human | Esophagus | ESCC | 1.45e-03 | 1.58e-01 | 0.0875 |
| 137994 | LETM2 | P2T-E | Human | Esophagus | ESCC | 1.19e-04 | 6.97e-02 | 0.1177 |
| 137994 | LETM2 | P11T-E | Human | Esophagus | ESCC | 3.34e-02 | 1.62e-01 | 0.1426 |
| 137994 | LETM2 | P15T-E | Human | Esophagus | ESCC | 1.94e-09 | 1.01e-01 | 0.1149 |
| 137994 | LETM2 | P22T-E | Human | Esophagus | ESCC | 6.94e-03 | 1.35e-02 | 0.1236 |
| 137994 | LETM2 | P24T-E | Human | Esophagus | ESCC | 2.55e-05 | 7.09e-02 | 0.1287 |
| 137994 | LETM2 | P27T-E | Human | Esophagus | ESCC | 1.53e-04 | 2.84e-02 | 0.1055 |
| 137994 | LETM2 | P28T-E | Human | Esophagus | ESCC | 4.87e-04 | 4.68e-02 | 0.1149 |
| 137994 | LETM2 | P37T-E | Human | Esophagus | ESCC | 3.79e-03 | 9.89e-02 | 0.1371 |
| 137994 | LETM2 | P42T-E | Human | Esophagus | ESCC | 8.22e-03 | 6.38e-02 | 0.1175 |
| 137994 | LETM2 | P47T-E | Human | Esophagus | ESCC | 3.55e-02 | 2.46e-02 | 0.1067 |
| 137994 | LETM2 | P52T-E | Human | Esophagus | ESCC | 9.24e-03 | 2.34e-01 | 0.1555 |
| 137994 | LETM2 | P62T-E | Human | Esophagus | ESCC | 2.02e-12 | 2.22e-01 | 0.1302 |
| 137994 | LETM2 | P65T-E | Human | Esophagus | ESCC | 1.76e-08 | 2.59e-01 | 0.0978 |
| 137994 | LETM2 | P75T-E | Human | Esophagus | ESCC | 6.06e-23 | 6.56e-01 | 0.1125 |
| 137994 | LETM2 | P83T-E | Human | Esophagus | ESCC | 2.38e-03 | 1.50e-01 | 0.1738 |
| 137994 | LETM2 | P89T-E | Human | Esophagus | ESCC | 3.17e-05 | 4.57e-01 | 0.1752 |
| 137994 | LETM2 | P130T-E | Human | Esophagus | ESCC | 1.04e-41 | 1.51e+00 | 0.1676 |
| 137994 | LETM2 | HCC2_Meng | Human | Liver | HCC | 8.88e-12 | 1.02e-01 | 0.0107 |
| Page: 1 2 |
| Tissue | Expression Dynamics | Abbreviation |
| Esophagus | 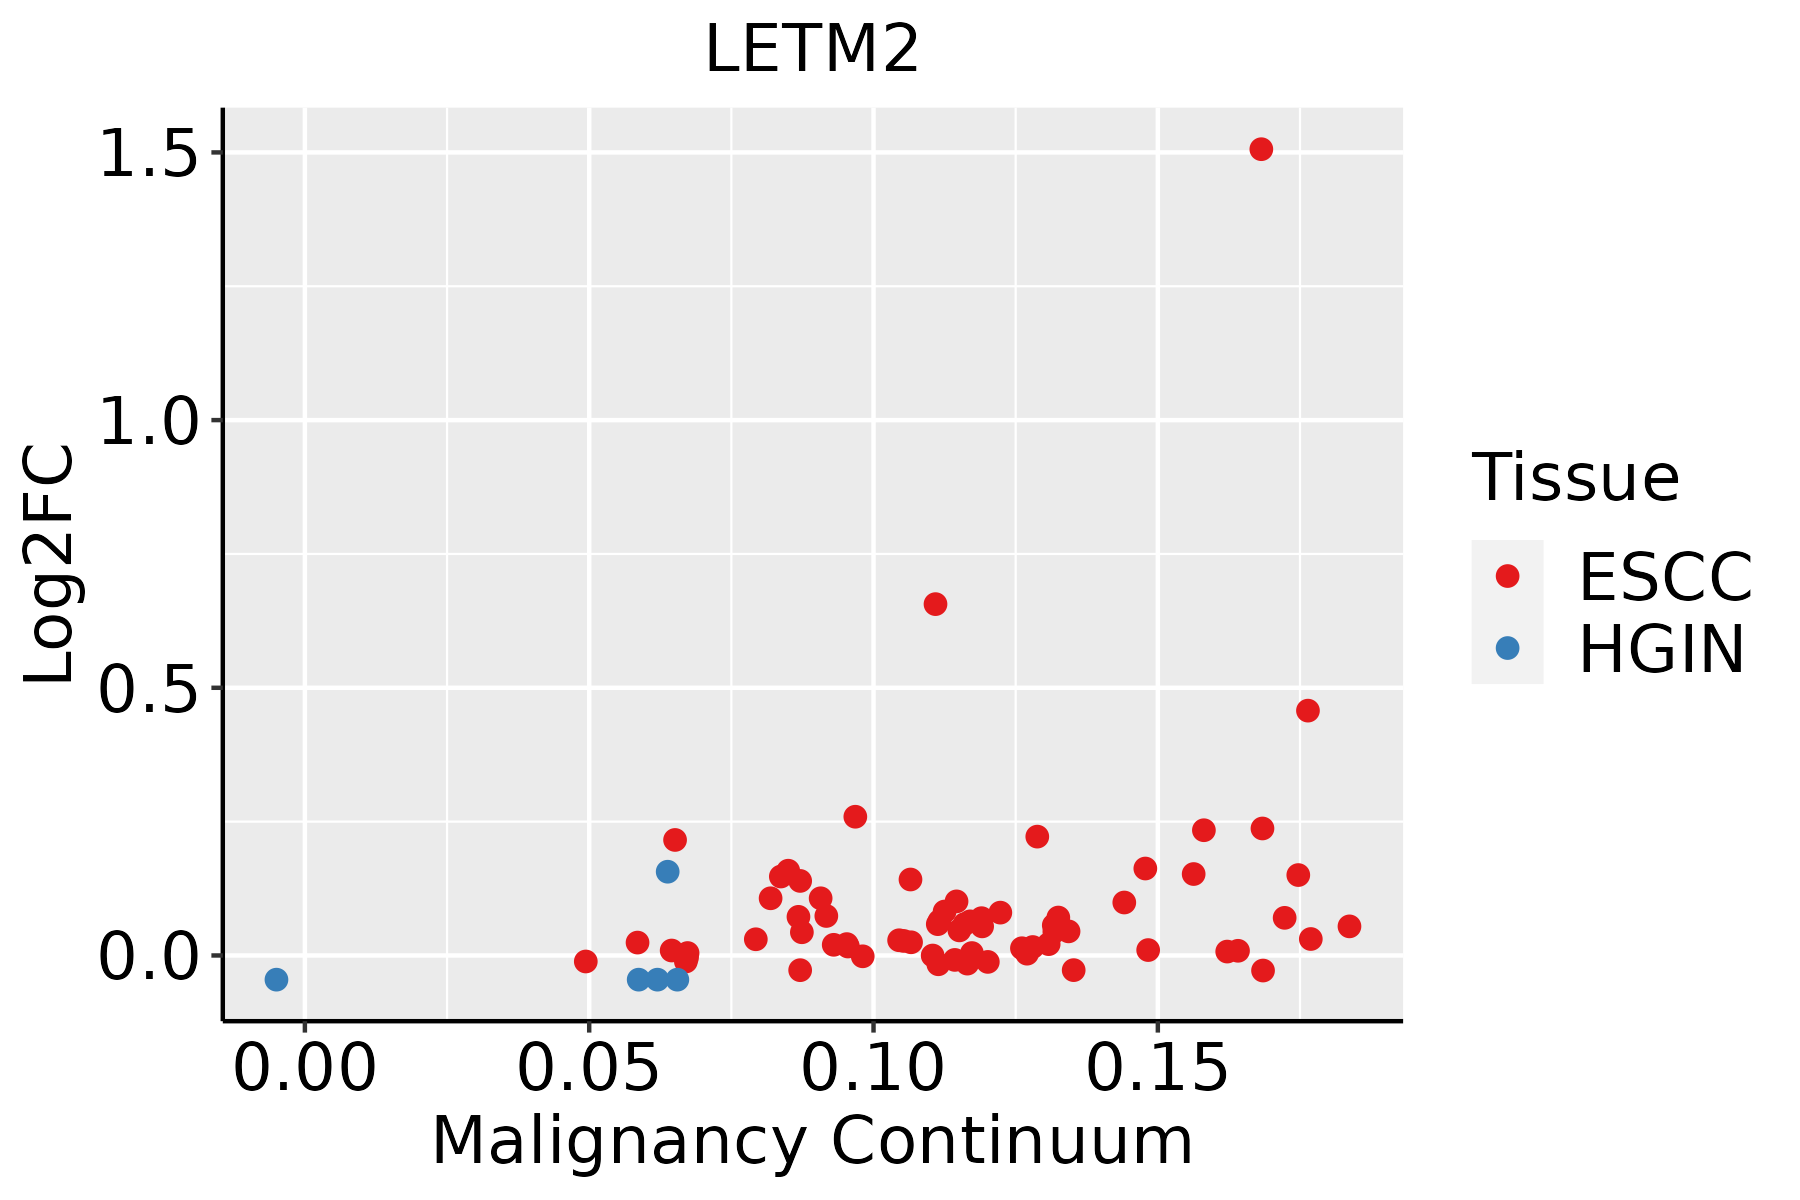 | ESCC: Esophageal squamous cell carcinoma |
| HGIN: High-grade intraepithelial neoplasias | ||
| LGIN: Low-grade intraepithelial neoplasias | ||
| Liver | 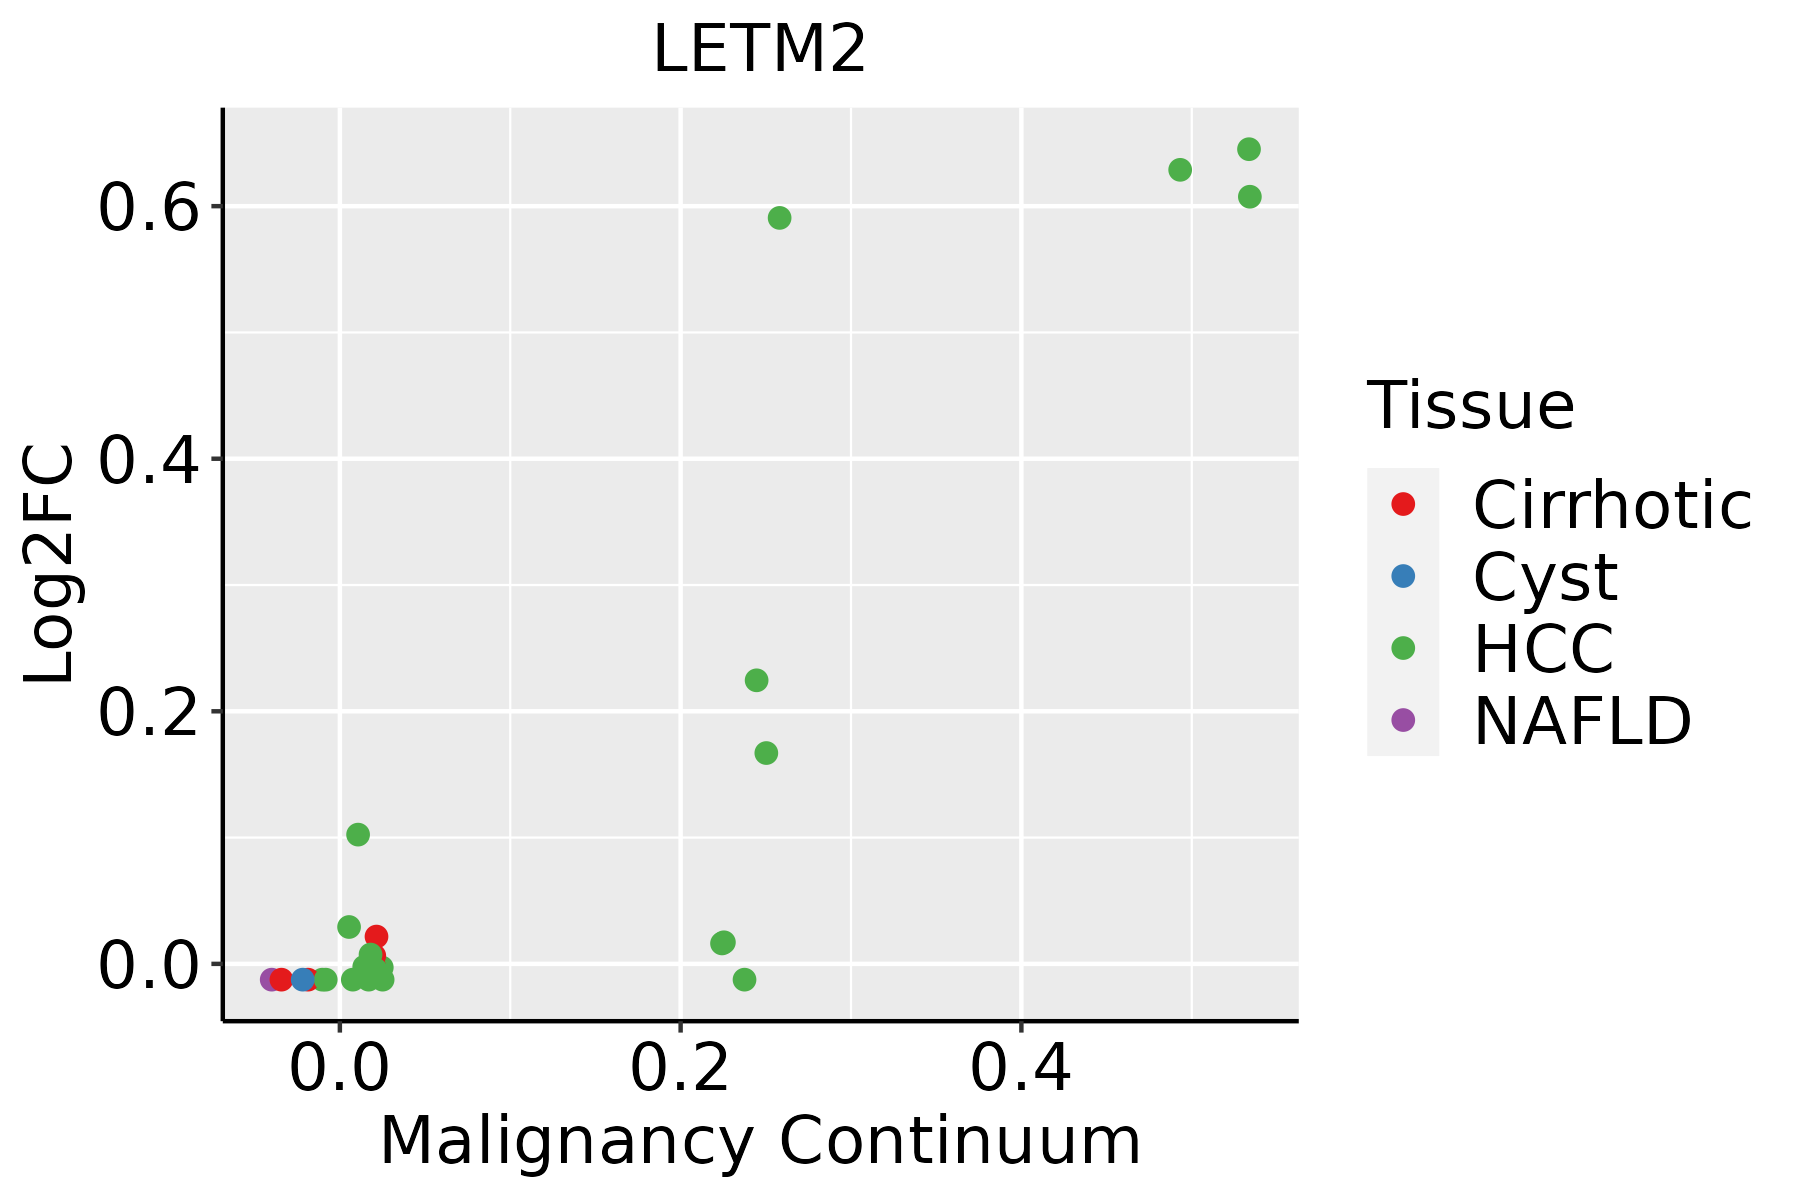 | HCC: Hepatocellular carcinoma |
| NAFLD: Non-alcoholic fatty liver disease | ||
| Oral Cavity |  | EOLP: Erosive Oral lichen planus |
| LP: leukoplakia | ||
| NEOLP: Non-erosive oral lichen planus | ||
| OSCC: Oral squamous cell carcinoma |
| ∗log2FC in expression of this searched gene in stem-like cells from each diseased tissue sample relative to stem-like cells in normal samples in each tissue plotted against the malignancy continuum. Samples are colored based on if they are from different disease stage. |
Top |
Malignant transformation related pathway analysis |
| Find out the enriched GO biological processes and KEGG pathways involved in transition from healthy to precancer to cancer |
| Tissue | Disease Stage | Enriched GO biological Processes |
| Colorectum | AD |  |
| Colorectum | SER |  |
| Colorectum | MSS |  |
| Colorectum | MSI-H |  |
| Colorectum | FAP |  |
| ∗Top 15 enriched GO BP terms are showed in the bar plot of each disease state in each tissue. Each row represents a significant GO biological process which is colored according to the -log10(p.adjust). |
| Page: 1 2 3 4 5 6 7 8 9 |
| GO ID | Tissue | Disease Stage | Description | Gene Ratio | Bg Ratio | pvalue | p.adjust | Count |
| Page: 1 |
| Pathway ID | Tissue | Disease Stage | Description | Gene Ratio | Bg Ratio | pvalue | p.adjust | qvalue | Count |
| Page: 1 |
Top |
Cell-cell communication analysis |
| Identification of potential cell-cell interactions between two cell types and their ligand-receptor pairs for different disease states |
| Ligand | Receptor | LRpair | Pathway | Tissue | Disease Stage |
| Page: 1 |
Top |
Single-cell gene regulatory network inference analysis |
| Find out the significant the regulons (TFs) and the target genes of each regulon across cell types for different disease states |
| TF | Cell Type | Tissue | Disease Stage | Target Gene | RSS | Regulon Activity |
| ∗The dot plots of a searched regulon are shown for all cell subpopulations in each disease state of each tissue based on the regulon specific score inferred using pySCENIC and by calculating the average expression. |
| Page: 1 |
Top |
Somatic mutation of malignant transformation related genes |
| Annotation of somatic variants for genes involved in malignant transformation |
| Hugo Symbol | Variant Class | Variant Classification | dbSNP RS | HGVSc | HGVSp | HGVSp Short | SWISSPROT | BIOTYPE | SIFT | PolyPhen | Tumor Sample Barcode | Tissue | Histology | Sex | Age | Stage | Therapy Types | Drugs | Outcome |
| LETM2 | insertion | In_Frame_Ins | novel | c.863_864insTTA | p.His288_Leu289insTyr | p.H288_L289insY | Q2VYF4 | protein_coding | TCGA-A8-A07R-01 | Breast | breast invasive carcinoma | Female | >=65 | III/IV | Ancillary | zoledronic | SD | ||
| LETM2 | insertion | Nonsense_Mutation | novel | c.864_865insATGATGTAGGGATGAGCAATAACAAGGAGACAG | p.His288_Leu289insMetMetTerGlyTerAlaIleThrArgArgGln | p.H288_L289insMM*G*AITRRQ | Q2VYF4 | protein_coding | TCGA-A8-A07R-01 | Breast | breast invasive carcinoma | Female | >=65 | III/IV | Ancillary | zoledronic | SD | ||
| LETM2 | SNV | Missense_Mutation | novel | c.509N>C | p.Arg170Thr | p.R170T | Q2VYF4 | protein_coding | deleterious(0.01) | probably_damaging(0.997) | TCGA-C5-A8YQ-01 | Cervix | cervical & endocervical cancer | Female | >=65 | I/II | Chemotherapy | cisplatin | PD |
| LETM2 | SNV | Missense_Mutation | c.378C>G | p.Ile126Met | p.I126M | Q2VYF4 | protein_coding | deleterious(0.01) | possibly_damaging(0.758) | TCGA-WL-A834-01 | Cervix | cervical & endocervical cancer | Female | <65 | I/II | Chemotherapy | paclitaxel | SD | |
| LETM2 | SNV | Missense_Mutation | c.501G>T | p.Arg167Ser | p.R167S | Q2VYF4 | protein_coding | deleterious(0) | possibly_damaging(0.593) | TCGA-AA-3815-01 | Colorectum | colon adenocarcinoma | Female | >=65 | I/II | Unknown | Unknown | SD | |
| LETM2 | SNV | Missense_Mutation | novel | c.401A>T | p.Tyr134Phe | p.Y134F | Q2VYF4 | protein_coding | deleterious(0) | probably_damaging(0.992) | TCGA-AY-4070-01 | Colorectum | colon adenocarcinoma | Female | <65 | III/IV | Chemotherapy | 5-fu | PD |
| LETM2 | SNV | Missense_Mutation | c.166N>C | p.Tyr56His | p.Y56H | Q2VYF4 | protein_coding | tolerated(0.27) | benign(0.001) | TCGA-AZ-6601-01 | Colorectum | colon adenocarcinoma | Male | >=65 | I/II | Unknown | Unknown | PD | |
| LETM2 | SNV | Missense_Mutation | c.271N>A | p.Pro91Thr | p.P91T | Q2VYF4 | protein_coding | deleterious(0) | benign(0.154) | TCGA-AZ-6606-01 | Colorectum | colon adenocarcinoma | Male | >=65 | III/IV | Chemotherapy | folfiri | PD | |
| LETM2 | SNV | Missense_Mutation | novel | c.692N>C | p.Lys231Thr | p.K231T | Q2VYF4 | protein_coding | deleterious(0.01) | probably_damaging(0.948) | TCGA-CA-6717-01 | Colorectum | colon adenocarcinoma | Male | <65 | I/II | Chemotherapy | oxaliplatin | CR |
| LETM2 | SNV | Missense_Mutation | novel | c.1408N>A | p.Glu470Lys | p.E470K | Q2VYF4 | protein_coding | tolerated(0.23) | benign(0.283) | TCGA-CA-6717-01 | Colorectum | colon adenocarcinoma | Male | <65 | I/II | Chemotherapy | oxaliplatin | CR |
| Page: 1 2 3 4 5 |
Top |
Related drugs of malignant transformation related genes |
| Identification of chemicals and drugs interact with genes involved in malignant transfromation |
| (DGIdb 4.0) |
| Entrez ID | Symbol | Category | Interaction Types | Drug Claim Name | Drug Name | PMIDs |
| Page: 1 |

Copyright 2023-Present -The University of Texas Health Science Center at Houston |