Schematic overview of the cellular and molecular mechanisms involved in the cancer progression, including the proposed cellular and molecular mechanisms in cancer cells trajectory. AT1: alveolar type 1 cells; AT2: alveolar type 2 cells; AAH: atypical adenomatous hyperplasia; AIS: adenocarcinoma in situ; MIA: minimally invasive adenocarcinoma; IA: invasive adenocarcinoma; EMT: epithelial-mesenchymal transition

Home

Download

Statistics

Help

Contact

Center for Computational Systems Medicine
leaf

Gene summary

leaf

Malignant transformation analysis

leaf

Malignant transformation related pathway analysis

leaf

Cell-cell communication analysis

leaf

Single-cell gene regulatory network inference analysis

leaf

Somatic mutation of malignant transformation related genes

leaf

Related drugs of malignant transformation related genes

Gene: LEPROTL1

Gene summary for LEPROTL1

check button Gene summary.

Gene informationSpeciesHuman
Gene symbol

LEPROTL1

Gene ID

23484

Gene nameleptin receptor overlapping transcript like 1
Gene AliasHSPC112
Cytomap8p12
Gene Typeprotein-coding
GO ID

GO:0006810

UniProtAcc

O95214


Top

Malignant transformation analysis

check button Identification of the aberrant gene expression in precancerous and cancerous lesions by comparing the gene expression of stem-like cells in diseased tissues with normal stem cells
check button Malignant transformation involving gene list.
Entrez IDSymbolReplicatesSpeciesOrganTissueAdj P-valueLog2FCMalignancy
23484LEPROTL1LZE2THumanEsophagusESCC2.61e-056.64e-010.082
23484LEPROTL1LZE4THumanEsophagusESCC8.36e-256.58e-010.0811
23484LEPROTL1LZE7THumanEsophagusESCC1.16e-128.34e-010.0667
23484LEPROTL1LZE8THumanEsophagusESCC3.05e-153.85e-010.067
23484LEPROTL1LZE20THumanEsophagusESCC1.83e-073.05e-010.0662
23484LEPROTL1LZE22THumanEsophagusESCC3.82e-043.02e-010.068
23484LEPROTL1LZE24THumanEsophagusESCC1.46e-256.09e-010.0596
23484LEPROTL1LZE6THumanEsophagusESCC2.38e-231.04e+000.0845
23484LEPROTL1P1T-EHumanEsophagusESCC1.41e-083.97e-010.0875
23484LEPROTL1P2T-EHumanEsophagusESCC1.15e-416.80e-010.1177
23484LEPROTL1P4T-EHumanEsophagusESCC1.15e-701.30e+000.1323
23484LEPROTL1P5T-EHumanEsophagusESCC3.83e-203.95e-010.1327
23484LEPROTL1P8T-EHumanEsophagusESCC3.13e-233.72e-010.0889
23484LEPROTL1P9T-EHumanEsophagusESCC6.64e-286.03e-010.1131
23484LEPROTL1P10T-EHumanEsophagusESCC6.19e-305.43e-010.116
23484LEPROTL1P11T-EHumanEsophagusESCC6.35e-245.39e-010.1426
23484LEPROTL1P12T-EHumanEsophagusESCC1.19e-244.95e-010.1122
23484LEPROTL1P15T-EHumanEsophagusESCC1.20e-531.23e+000.1149
23484LEPROTL1P16T-EHumanEsophagusESCC1.90e-336.81e-010.1153
23484LEPROTL1P17T-EHumanEsophagusESCC1.60e-114.72e-010.1278
Page: 1 2 3 4 5 6 

check button Transcriptomic changes along malignancy continuum.
TissueExpression DynamicsAbbreviation
EsophagusThe image shows the transcriptomic changes along malignancy continuum.log2FC in expression of this searched gene in stem-like cells from each diseased tissue sample relative to stem-like cells in normal samples in each tissue plotted against the malignancy continuum. Samples are colored based on if they are from different disease stage.
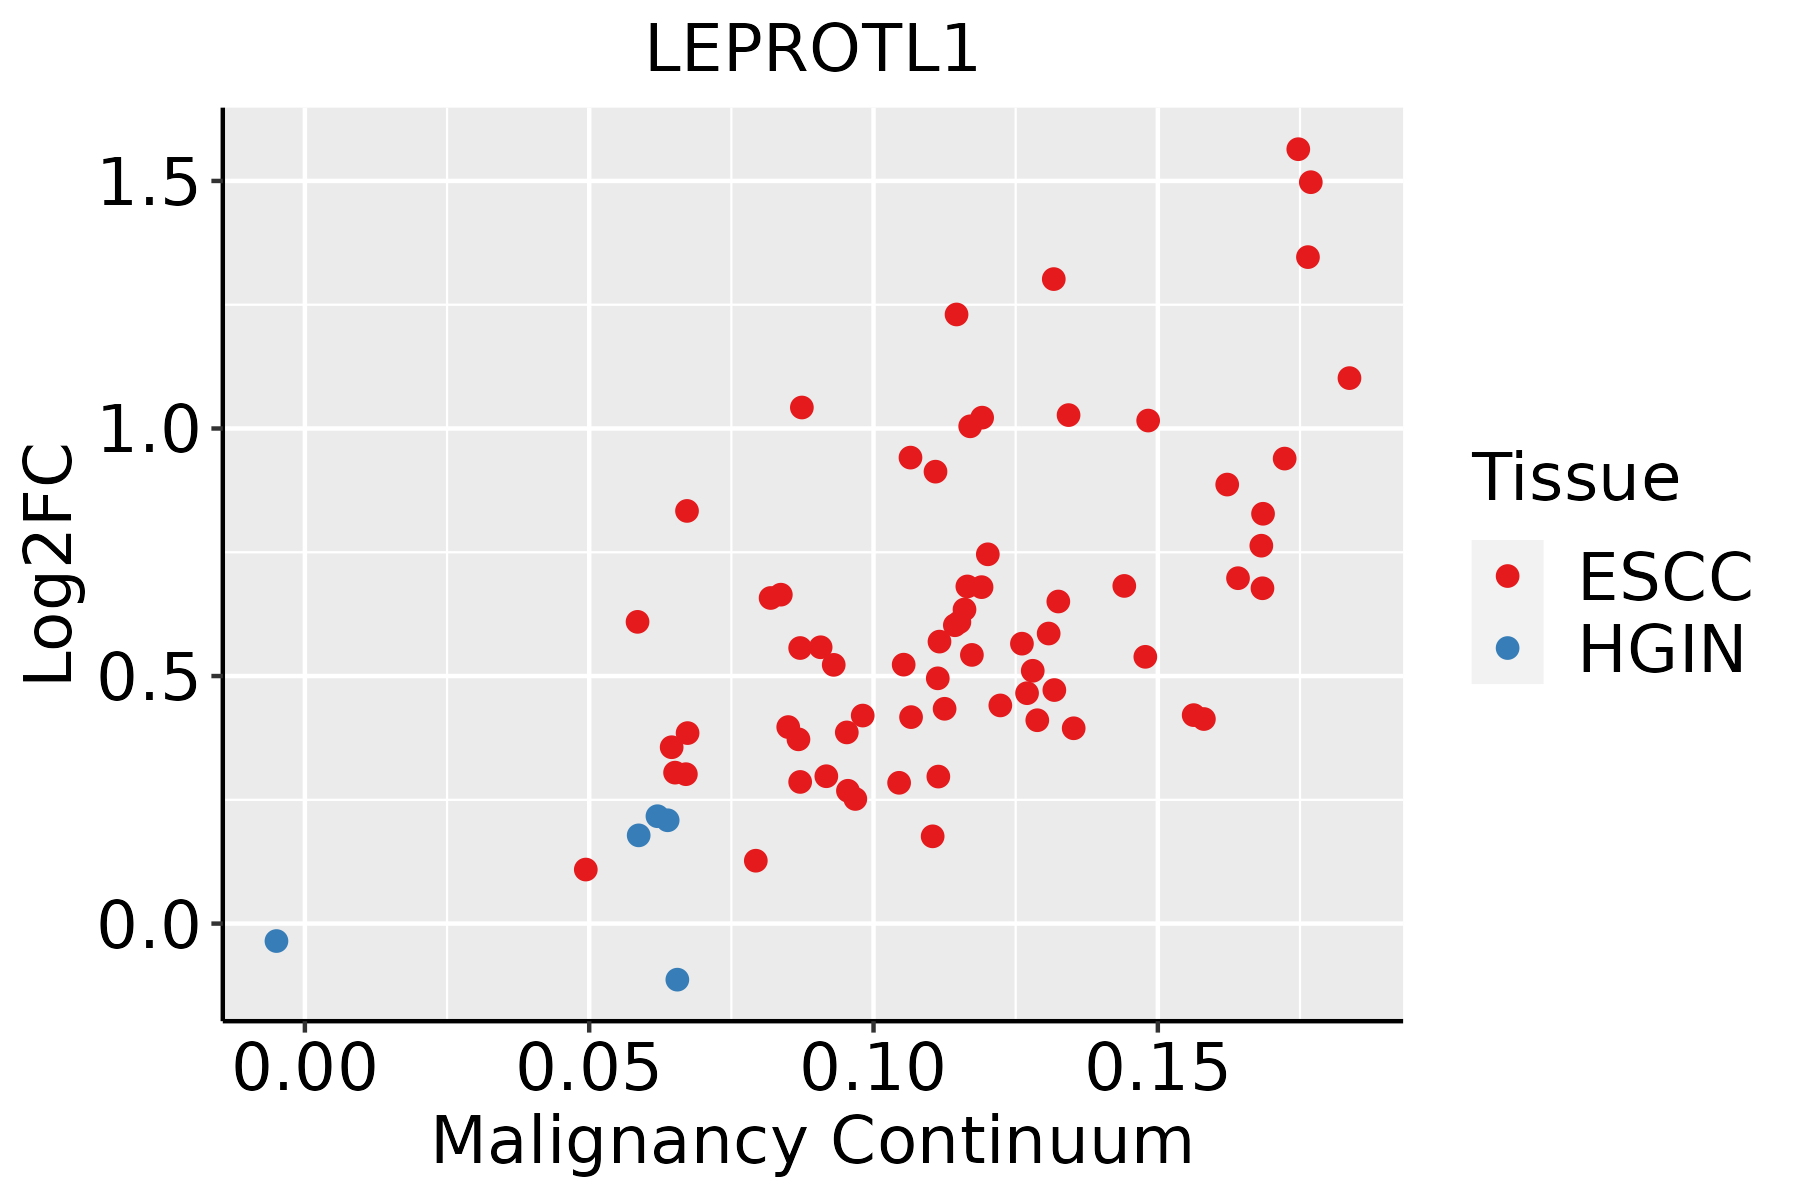
ESCC: Esophageal squamous cell carcinoma
HGIN: High-grade intraepithelial neoplasias
LGIN: Low-grade intraepithelial neoplasias
LiverThe image shows the transcriptomic changes along malignancy continuum.log2FC in expression of this searched gene in stem-like cells from each diseased tissue sample relative to stem-like cells in normal samples in each tissue plotted against the malignancy continuum. Samples are colored based on if they are from different disease stage.
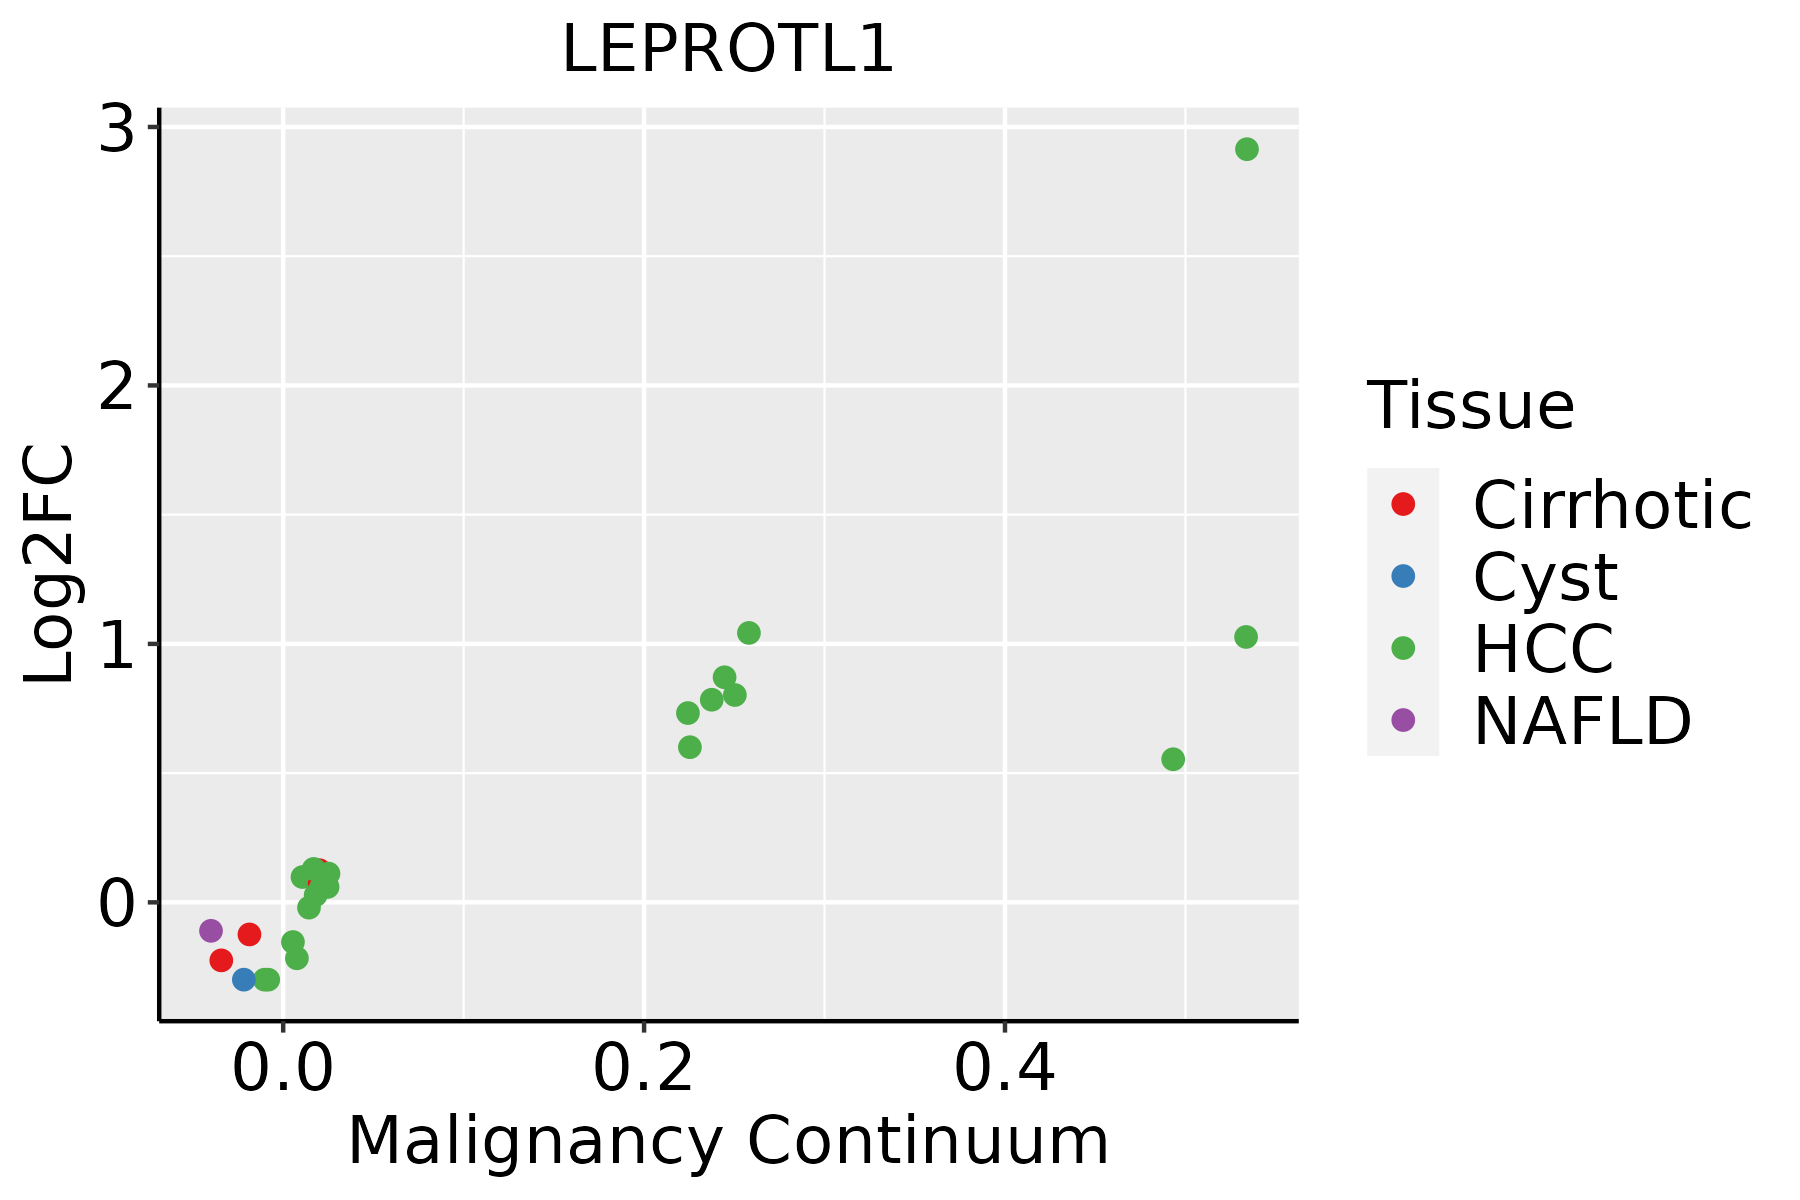
HCC: Hepatocellular carcinoma
NAFLD: Non-alcoholic fatty liver disease
Oral CavityThe image shows the transcriptomic changes along malignancy continuum.log2FC in expression of this searched gene in stem-like cells from each diseased tissue sample relative to stem-like cells in normal samples in each tissue plotted against the malignancy continuum. Samples are colored based on if they are from different disease stage.
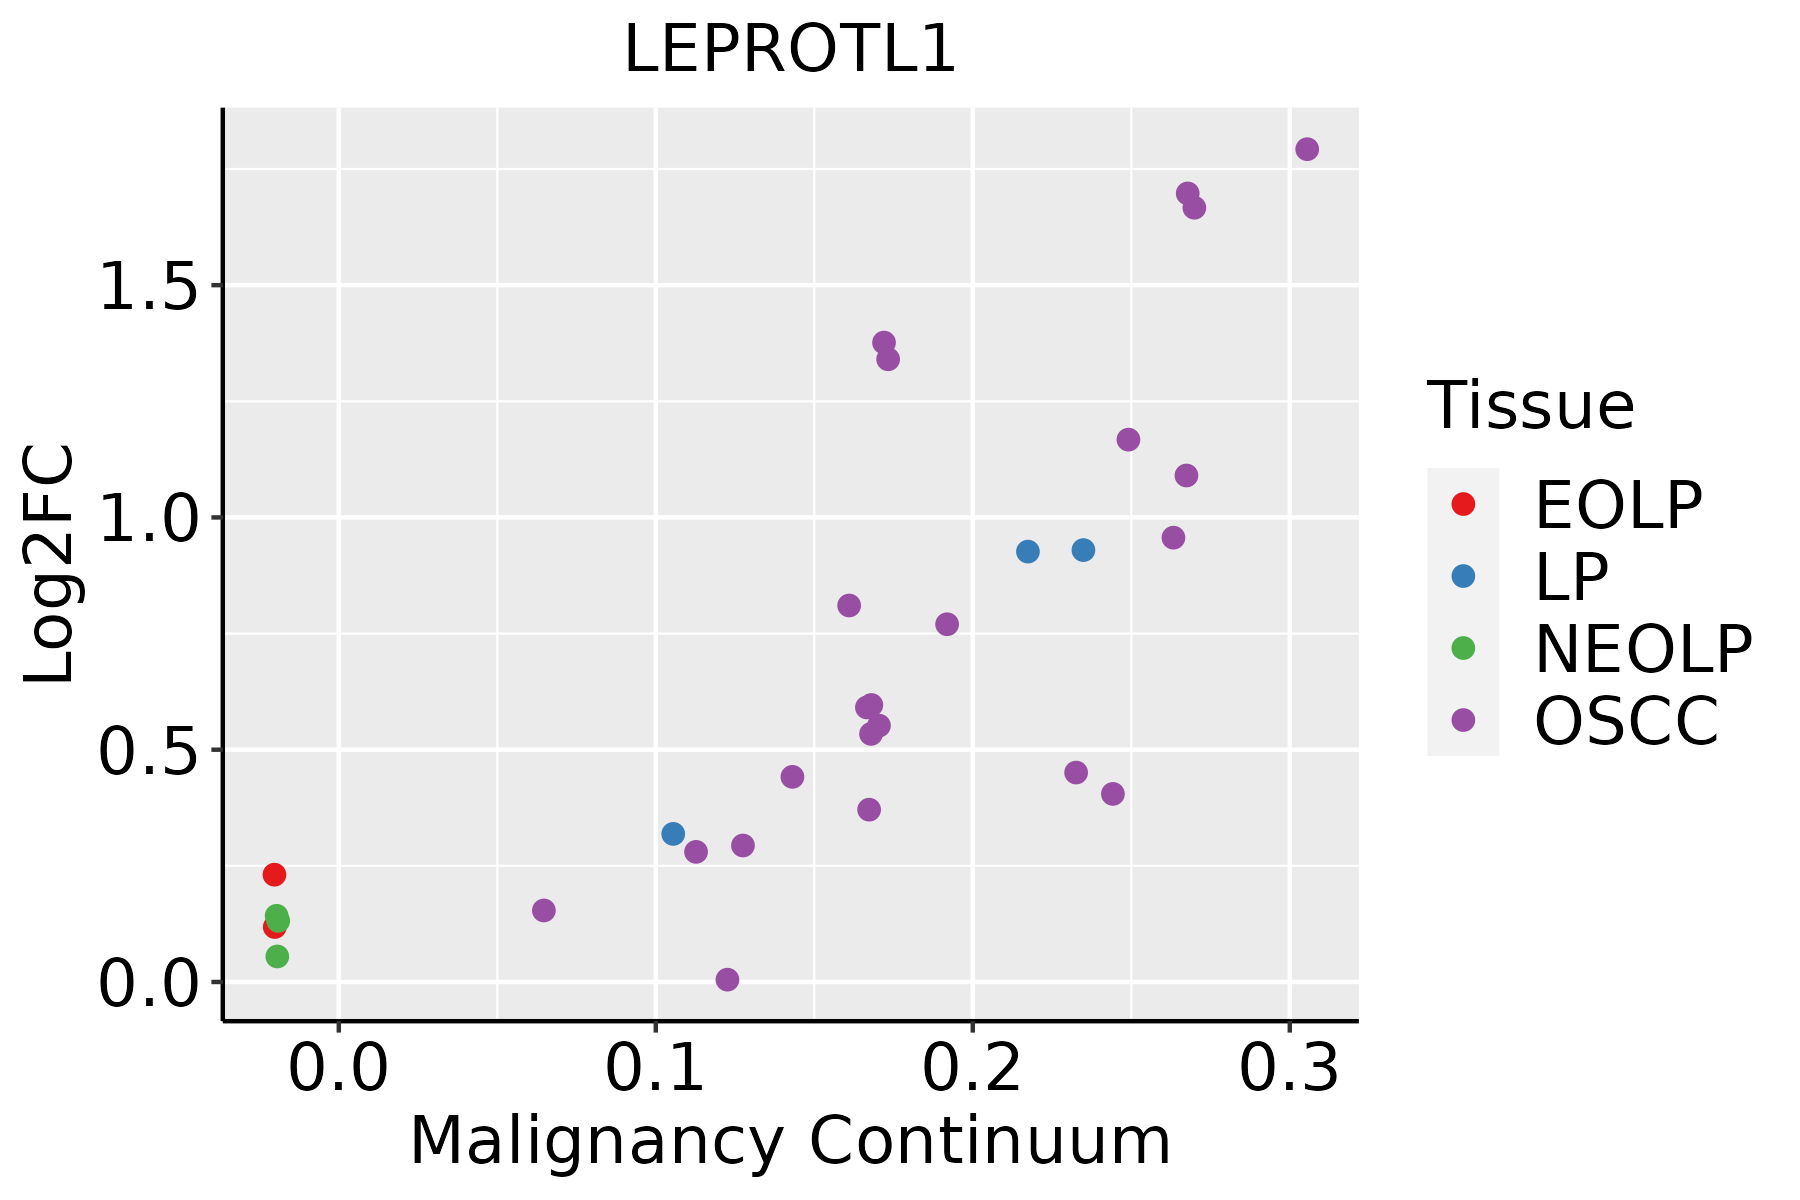
EOLP: Erosive Oral lichen planus
LP: leukoplakia
NEOLP: Non-erosive oral lichen planus
OSCC: Oral squamous cell carcinoma
SkinThe image shows the transcriptomic changes along malignancy continuum.log2FC in expression of this searched gene in stem-like cells from each diseased tissue sample relative to stem-like cells in normal samples in each tissue plotted against the malignancy continuum. Samples are colored based on if they are from different disease stage.AK: Actinic keratosis
cSCC: Cutaneous squamous cell carcinoma
SCCIS:squamous cell carcinoma in situ
ThyroidThe image shows the transcriptomic changes along malignancy continuum.log2FC in expression of this searched gene in stem-like cells from each diseased tissue sample relative to stem-like cells in normal samples in each tissue plotted against the malignancy continuum. Samples are colored based on if they are from different disease stage.ATC: Anaplastic thyroid cancer
HT: Hashimoto's thyroiditis
PTC: Papillary thyroid cancer
∗log2FC in expression of this searched gene in stem-like cells from each diseased tissue sample relative to stem-like cells in normal samples in each tissue plotted against the malignancy continuum. Samples are colored based on if they are from different disease stage.

Top

Malignant transformation related pathway analysis

check buttonFind out the enriched GO biological processes and KEGG pathways involved in transition from healthy to precancer to cancer
check button Figure of enriched GO biological processes.
TissueDisease StageEnriched GO biological Processes
ColorectumADGO analysis - Figure of enriched GO biological processes: Top 15 enriched GO BP terms are showed in the bar plot of each disease state in each tissue. Each row represents a significant GO biological process which is colored according to the -log10(p.adjust).
ColorectumSERGO analysis - Figure of enriched GO biological processes: Top 15 enriched GO BP terms are showed in the bar plot of each disease state in each tissue. Each row represents a significant GO biological process which is colored according to the -log10(p.adjust).
ColorectumMSSGO analysis - Figure of enriched GO biological processes: Top 15 enriched GO BP terms are showed in the bar plot of each disease state in each tissue. Each row represents a significant GO biological process which is colored according to the -log10(p.adjust).
ColorectumMSI-HGO analysis - Figure of enriched GO biological processes: Top 15 enriched GO BP terms are showed in the bar plot of each disease state in each tissue. Each row represents a significant GO biological process which is colored according to the -log10(p.adjust).
ColorectumFAPGO analysis - Figure of enriched GO biological processes: Top 15 enriched GO BP terms are showed in the bar plot of each disease state in each tissue. Each row represents a significant GO biological process which is colored according to the -log10(p.adjust).
∗Top 15 enriched GO BP terms are showed in the bar plot of each disease state in each tissue. Each row represents a significant GO biological process which is colored according to the -log10(p.adjust).
Page: 1 2 3 4 5 6 7 8 9 

check button Enriched GO biological processes.
GO IDTissueDisease StageDescriptionGene RatioBg Ratiopvaluep.adjustCount
GO:001619715EsophagusESCCendosomal transport168/8552230/187232.28e-171.93e-15168
GO:000703417EsophagusESCCvacuolar transport119/8552157/187231.16e-146.30e-13119
GO:007198514EsophagusESCCmultivesicular body sorting pathway34/855237/187233.49e-097.39e-0834
GO:003250915EsophagusESCCendosome transport via multivesicular body sorting pathway29/855231/187231.92e-083.72e-0729
GO:00453245EsophagusESCClate endosome to vacuole transport23/855225/187231.39e-061.69e-0523
GO:190165319EsophagusESCCcellular response to peptide208/8552359/187231.68e-062.01e-05208
GO:0043434111EsophagusESCCresponse to peptide hormone234/8552414/187234.93e-065.21e-05234
GO:00325113EsophagusESCClate endosome to vacuole transport via multivesicular body sorting pathway16/855217/187233.46e-052.82e-0416
GO:007137516EsophagusESCCcellular response to peptide hormone stimulus166/8552290/187234.48e-053.55e-04166
GO:000703411LiverCirrhoticvacuolar transport75/4634157/187233.13e-101.53e-0875
GO:00325093LiverCirrhoticendosome transport via multivesicular body sorting pathway24/463431/187231.06e-094.76e-0824
GO:00719853LiverCirrhoticmultivesicular body sorting pathway25/463437/187234.79e-081.52e-0625
GO:001619711LiverCirrhoticendosomal transport93/4634230/187231.01e-072.93e-0693
GO:004343412LiverCirrhoticresponse to peptide hormone149/4634414/187231.70e-074.49e-06149
GO:007137511LiverCirrhoticcellular response to peptide hormone stimulus110/4634290/187233.73e-078.82e-06110
GO:00453242LiverCirrhoticlate endosome to vacuole transport18/463425/187238.88e-071.84e-0518
GO:190165311LiverCirrhoticcellular response to peptide129/4634359/187231.23e-062.49e-05129
GO:0032511LiverCirrhoticlate endosome to vacuole transport via multivesicular body sorting pathway12/463417/187238.92e-059.59e-0412
GO:001619721LiverHCCendosomal transport154/7958230/187234.74e-142.95e-12154
GO:004343422LiverHCCresponse to peptide hormone247/7958414/187239.55e-134.77e-11247
Page: 1 2 3 4 

check button Enriched KEGG pathways.
Pathway IDTissueDisease StageDescriptionGene RatioBg Ratiopvaluep.adjustqvalueCount
Page: 1 

Top

Cell-cell communication analysis

check buttonIdentification of potential cell-cell interactions between two cell types and their ligand-receptor pairs for different disease states
LigandReceptorLRpairPathwayTissueDisease Stage
Page: 1 

Top

Single-cell gene regulatory network inference analysis

check buttonFind out the significant the regulons (TFs) and the target genes of each regulon across cell types for different disease states
TFCell TypeTissueDisease StageTarget GeneRSSRegulon Activity
∗The dot plots of a searched regulon are shown for all cell subpopulations in each disease state of each tissue based on the regulon specific score inferred using pySCENIC and by calculating the average expression.
Page: 1 

Top

Somatic mutation of malignant transformation related genes

check buttonAnnotation of somatic variants for genes involved in malignant transformation
Hugo SymbolVariant ClassVariant ClassificationdbSNP RSHGVScHGVSpHGVSp ShortSWISSPROTBIOTYPESIFTPolyPhenTumor Sample BarcodeTissueHistologySexAgeStageTherapy TypesDrugsOutcome
LEPROTL1deletionFrame_Shift_Delnovelc.448delCp.Leu150TrpfsTer9p.L150Wfs*9O95214protein_codingTCGA-EW-A2FV-01Breastbreast invasive carcinomaFemale<65III/IVChemotherapydocetaxelSD
LEPROTL1SNVMissense_Mutationc.193N>Ap.Ala65Thrp.A65TO95214protein_codingdeleterious(0.04)possibly_damaging(0.82)TCGA-FU-A3HZ-01Cervixcervical & endocervical cancerFemale<65I/IIChemotherapycisplatinCR
LEPROTL1SNVMissense_Mutationc.235G>Ap.Val79Metp.V79MO95214protein_codingdeleterious(0.02)probably_damaging(0.989)TCGA-AA-3864-01Colorectumcolon adenocarcinomaMale>=65I/IIUnknownUnknownSD
LEPROTL1SNVMissense_Mutationnovelc.500N>Gp.Gln167Argp.Q167RO95214protein_codingdeleterious_low_confidence(0)benign(0)TCGA-AZ-4315-01Colorectumcolon adenocarcinomaMale<65I/IIUnknownUnknownSD
LEPROTL1SNVMissense_Mutationrs550518450c.370G>Ap.Ala124Thrp.A124TO95214protein_codingdeleterious_low_confidence(0.01)benign(0.001)TCGA-AG-A02N-01Colorectumrectum adenocarcinomaMale>=65I/IIChemotherapyfolinicCR
LEPROTL1insertionFrame_Shift_Insnovelc.117_118insTp.Tyr42LeufsTer17p.Y42Lfs*17O95214protein_codingTCGA-CM-6674-01Colorectumcolon adenocarcinomaMale<65I/IIUnknownUnknownSD
LEPROTL1SNVMissense_Mutationnovelc.76N>Ap.Ala26Thrp.A26TO95214protein_codingdeleterious(0.02)benign(0.306)TCGA-DF-A2KU-01Endometriumuterine corpus endometrioid carcinomaFemaleUnknownI/IIUnknownUnknownSD
LEPROTL1SNVMissense_Mutationnovelc.470N>Tp.Ala157Valp.A157VO95214protein_codingdeleterious_low_confidence(0)benign(0)TCGA-EY-A1GK-01Endometriumuterine corpus endometrioid carcinomaFemale>=65I/IIUnknownUnknownSD
LEPROTL1insertionFrame_Shift_Insnovelc.124dupTp.Tyr42LeufsTer17p.Y42Lfs*17O95214protein_codingTCGA-B5-A3FC-01Endometriumuterine corpus endometrioid carcinomaFemale<65I/IIUnknownUnknownSD
LEPROTL1insertionFrame_Shift_Insnovelc.92_92+1insCAAATACTGGCCCCTCTTTp.Val38GlnfsTer27p.V38Qfs*27O95214protein_codingTCGA-BB-A5HY-01Oral cavityhead & neck squamous cell carcinomaMale<65I/IIChemotherapycisplatinPD
Page: 1 2 

Top

Related drugs of malignant transformation related genes

check buttonIdentification of chemicals and drugs interact with genes involved in malignant transfromation
(DGIdb 4.0)
Entrez IDSymbolCategoryInteraction TypesDrug Claim NameDrug NamePMIDs
Page: 1