
|
|||||
|
 | |
| |
| |
| |
| |
| |
|
Gene: LEMD3 |
Gene summary for LEMD3 |
| Gene information | Species | Human | Gene symbol | LEMD3 | Gene ID | 23592 |
| Gene name | LEM domain containing 3 | |
| Gene Alias | MAN1 | |
| Cytomap | 12q14.3 | |
| Gene Type | protein-coding | GO ID | GO:0006996 | UniProtAcc | Q9Y2U8 |
Top |
Malignant transformation analysis |
| Identification of the aberrant gene expression in precancerous and cancerous lesions by comparing the gene expression of stem-like cells in diseased tissues with normal stem cells |
| Entrez ID | Symbol | Replicates | Species | Organ | Tissue | Adj P-value | Log2FC | Malignancy |
| 23592 | LEMD3 | CCI_1 | Human | Cervix | CC | 6.92e-03 | 4.37e-01 | 0.528 |
| 23592 | LEMD3 | CCI_2 | Human | Cervix | CC | 8.55e-14 | 1.14e+00 | 0.5249 |
| 23592 | LEMD3 | CCI_3 | Human | Cervix | CC | 1.49e-06 | 5.76e-01 | 0.516 |
| 23592 | LEMD3 | LZE4T | Human | Esophagus | ESCC | 8.01e-07 | 8.56e-02 | 0.0811 |
| 23592 | LEMD3 | LZE7T | Human | Esophagus | ESCC | 2.16e-02 | 4.86e-02 | 0.0667 |
| 23592 | LEMD3 | LZE24T | Human | Esophagus | ESCC | 1.24e-16 | 7.91e-02 | 0.0596 |
| 23592 | LEMD3 | P1T-E | Human | Esophagus | ESCC | 4.53e-03 | 1.84e-01 | 0.0875 |
| 23592 | LEMD3 | P2T-E | Human | Esophagus | ESCC | 1.31e-33 | 6.61e-01 | 0.1177 |
| 23592 | LEMD3 | P4T-E | Human | Esophagus | ESCC | 4.12e-15 | 1.57e-01 | 0.1323 |
| 23592 | LEMD3 | P5T-E | Human | Esophagus | ESCC | 5.24e-13 | 5.67e-02 | 0.1327 |
| 23592 | LEMD3 | P8T-E | Human | Esophagus | ESCC | 6.20e-26 | 2.24e-01 | 0.0889 |
| 23592 | LEMD3 | P9T-E | Human | Esophagus | ESCC | 2.00e-05 | -1.80e-02 | 0.1131 |
| 23592 | LEMD3 | P10T-E | Human | Esophagus | ESCC | 1.58e-14 | 1.72e-01 | 0.116 |
| 23592 | LEMD3 | P11T-E | Human | Esophagus | ESCC | 1.30e-07 | 1.62e-01 | 0.1426 |
| 23592 | LEMD3 | P12T-E | Human | Esophagus | ESCC | 6.43e-16 | 3.53e-01 | 0.1122 |
| 23592 | LEMD3 | P15T-E | Human | Esophagus | ESCC | 8.24e-12 | 1.79e-01 | 0.1149 |
| 23592 | LEMD3 | P16T-E | Human | Esophagus | ESCC | 2.55e-19 | 2.14e-01 | 0.1153 |
| 23592 | LEMD3 | P17T-E | Human | Esophagus | ESCC | 7.20e-03 | 1.09e-02 | 0.1278 |
| 23592 | LEMD3 | P20T-E | Human | Esophagus | ESCC | 2.67e-16 | 2.00e-01 | 0.1124 |
| 23592 | LEMD3 | P21T-E | Human | Esophagus | ESCC | 1.69e-15 | 1.53e-01 | 0.1617 |
| Page: 1 2 3 |
| Tissue | Expression Dynamics | Abbreviation |
| Cervix | 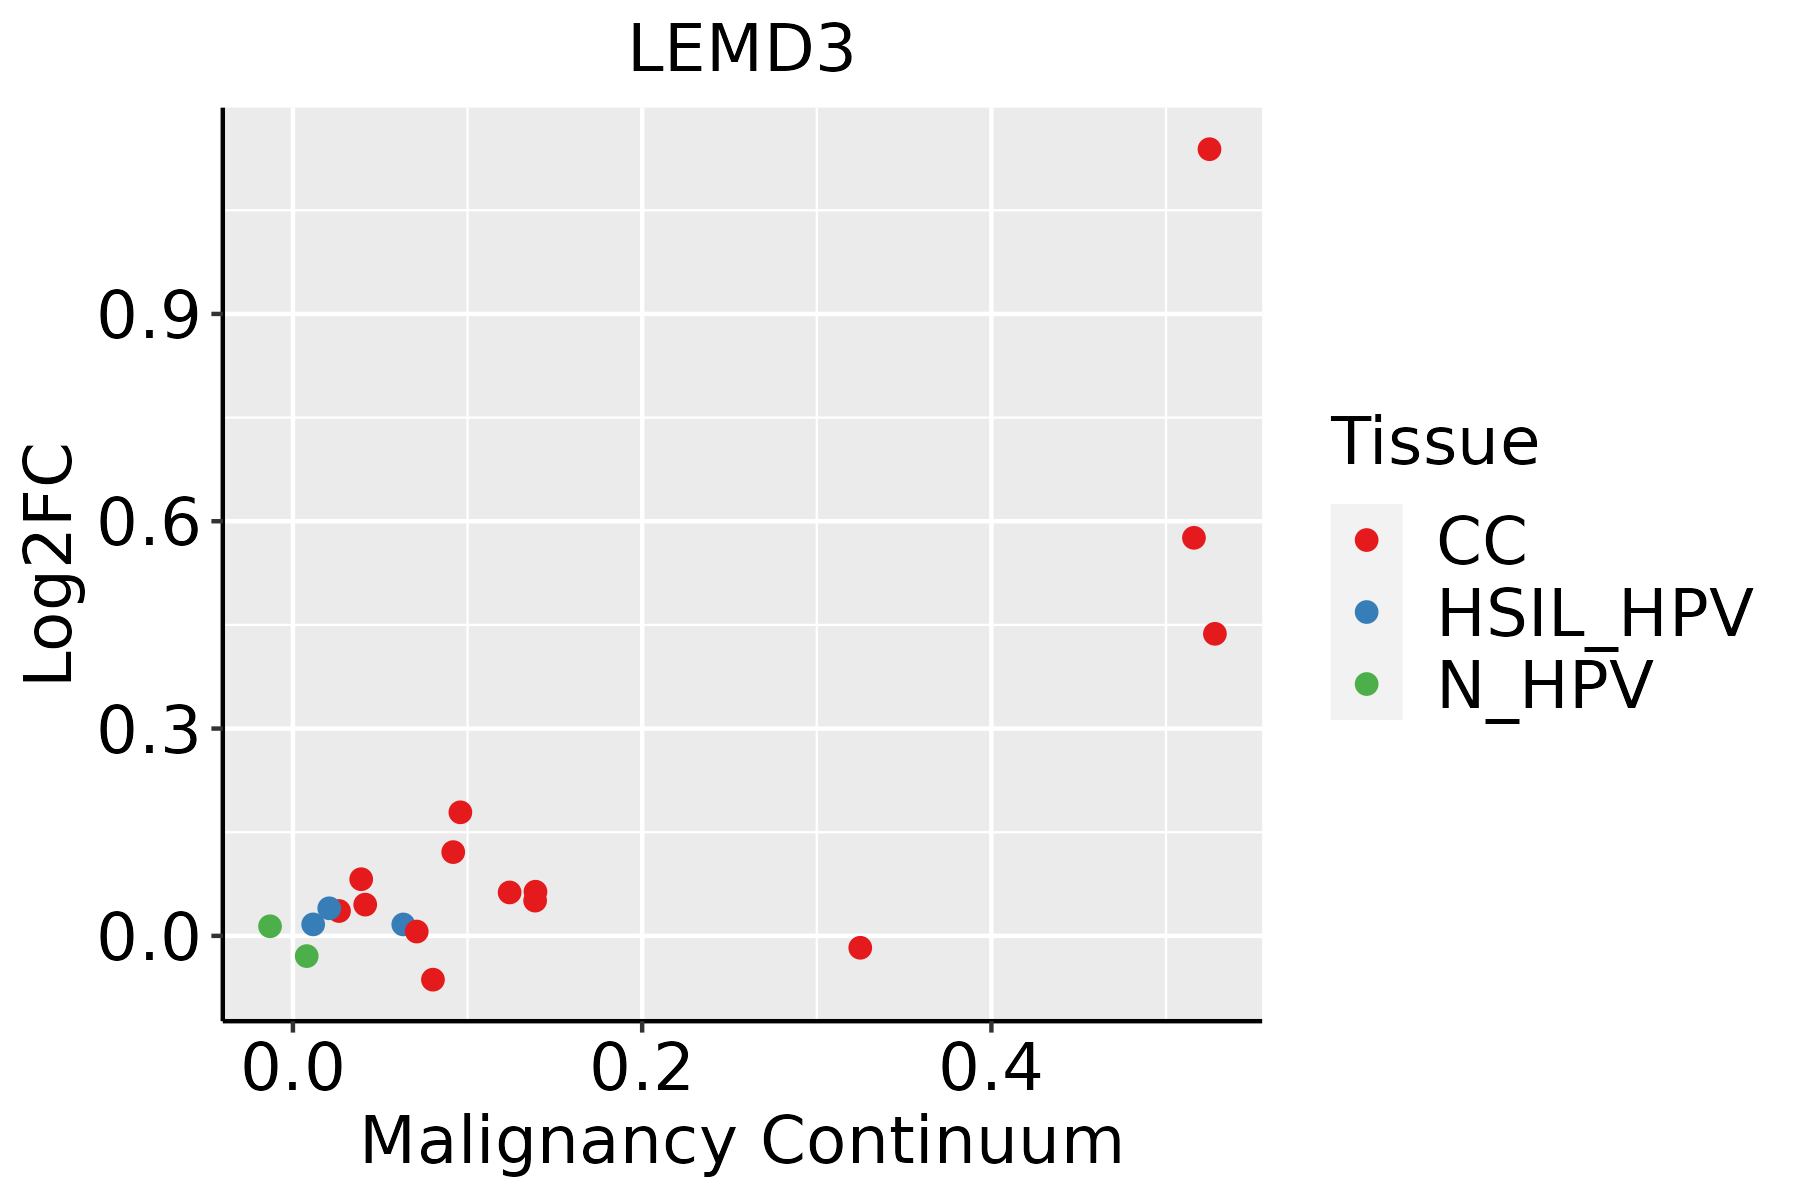 | CC: Cervix cancer |
| HSIL_HPV: HPV-infected high-grade squamous intraepithelial lesions | ||
| N_HPV: HPV-infected normal cervix | ||
| Esophagus | 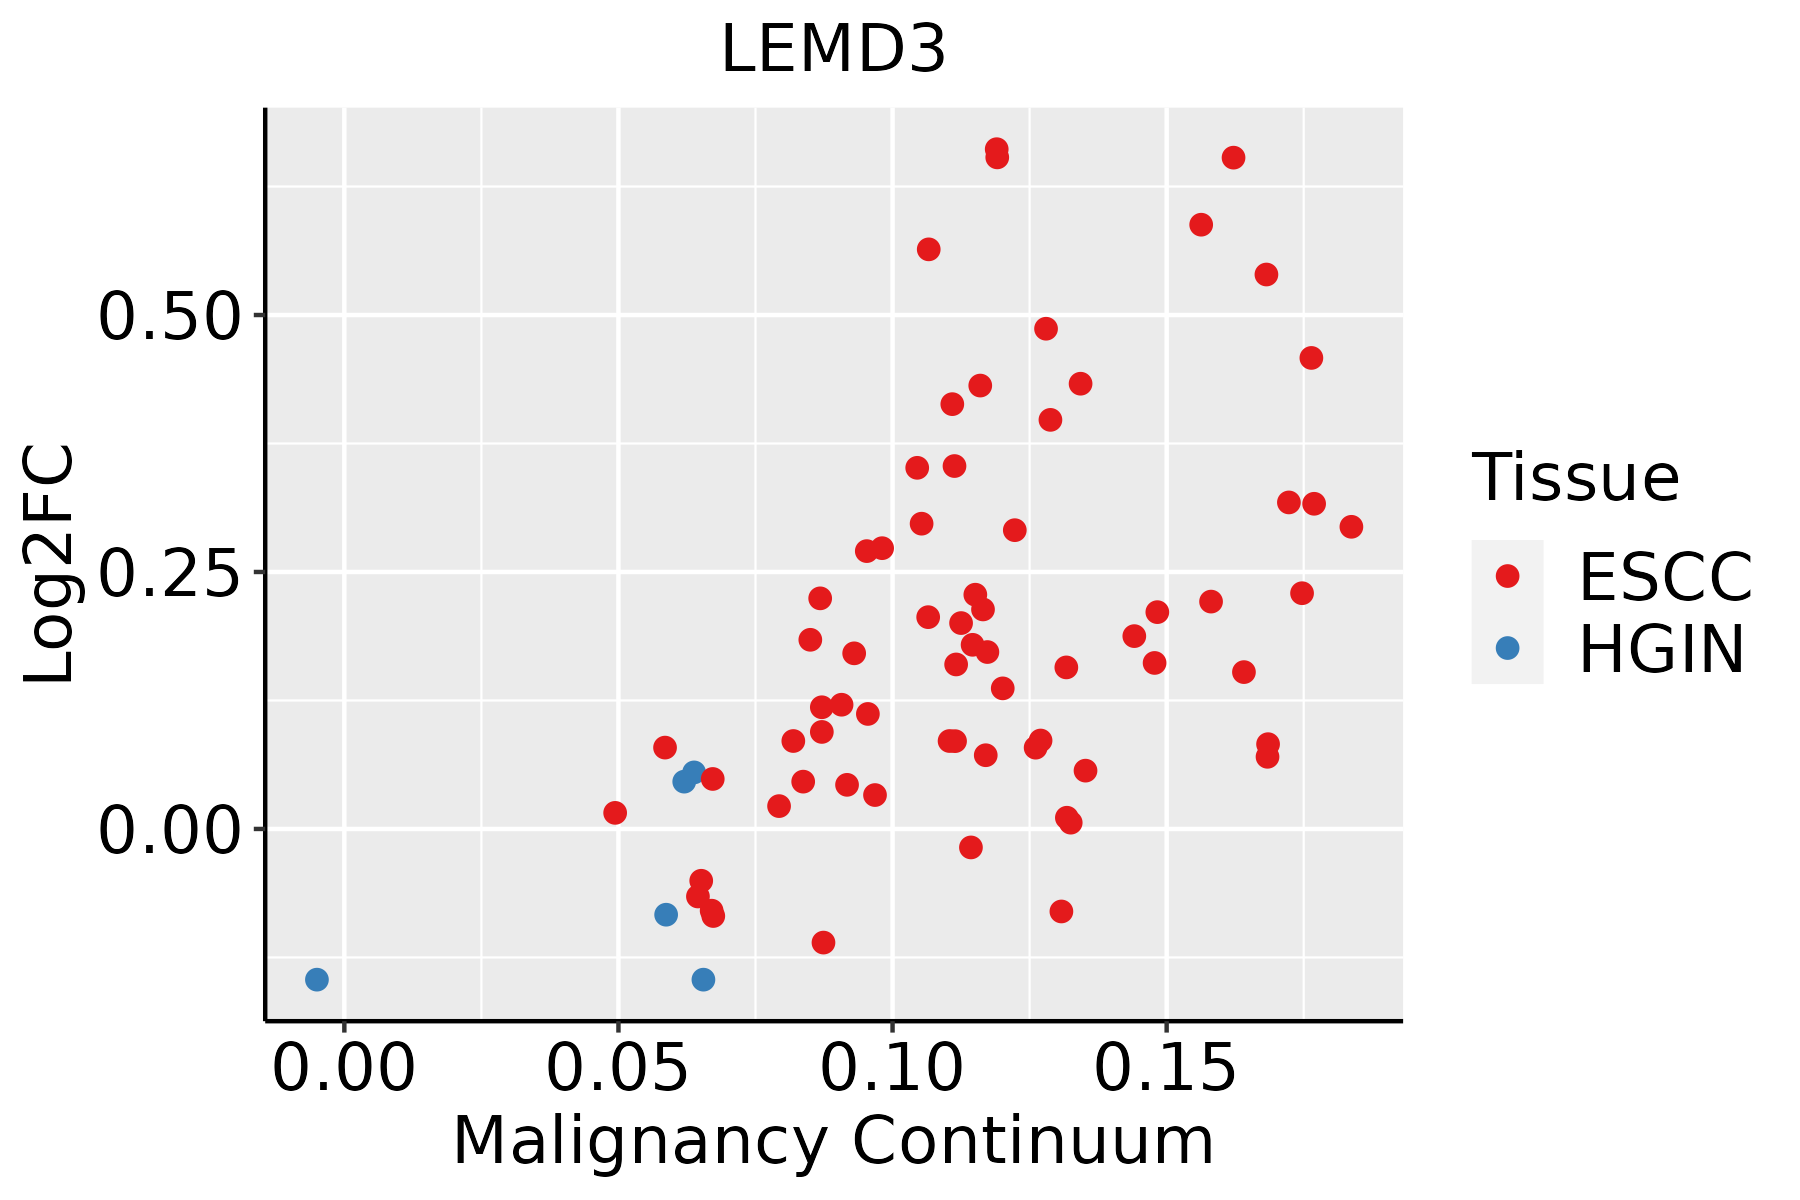 | ESCC: Esophageal squamous cell carcinoma |
| HGIN: High-grade intraepithelial neoplasias | ||
| LGIN: Low-grade intraepithelial neoplasias |
| ∗log2FC in expression of this searched gene in stem-like cells from each diseased tissue sample relative to stem-like cells in normal samples in each tissue plotted against the malignancy continuum. Samples are colored based on if they are from different disease stage. |
Top |
Malignant transformation related pathway analysis |
| Find out the enriched GO biological processes and KEGG pathways involved in transition from healthy to precancer to cancer |
| Tissue | Disease Stage | Enriched GO biological Processes |
| Colorectum | AD |  |
| Colorectum | SER |  |
| Colorectum | MSS |  |
| Colorectum | MSI-H |  |
| Colorectum | FAP |  |
| ∗Top 15 enriched GO BP terms are showed in the bar plot of each disease state in each tissue. Each row represents a significant GO biological process which is colored according to the -log10(p.adjust). |
| Page: 1 2 3 4 5 6 7 8 9 |
| GO ID | Tissue | Disease Stage | Description | Gene Ratio | Bg Ratio | pvalue | p.adjust | Count |
| GO:00071786 | Cervix | CC | transmembrane receptor protein serine/threonine kinase signaling pathway | 67/2311 | 355/18723 | 2.39e-04 | 2.67e-03 | 67 |
| GO:00715595 | Cervix | CC | response to transforming growth factor beta | 50/2311 | 256/18723 | 6.31e-04 | 5.91e-03 | 50 |
| GO:00715605 | Cervix | CC | cellular response to transforming growth factor beta stimulus | 49/2311 | 250/18723 | 6.55e-04 | 6.05e-03 | 49 |
| GO:00071795 | Cervix | CC | transforming growth factor beta receptor signaling pathway | 38/2311 | 198/18723 | 3.62e-03 | 2.31e-02 | 38 |
| GO:000699713 | Esophagus | ESCC | nucleus organization | 96/8552 | 133/18723 | 4.66e-10 | 1.21e-08 | 96 |
| GO:000699811 | Esophagus | ESCC | nuclear envelope organization | 39/8552 | 47/18723 | 1.48e-07 | 2.35e-06 | 39 |
| GO:00715599 | Esophagus | ESCC | response to transforming growth factor beta | 157/8552 | 256/18723 | 2.95e-07 | 4.23e-06 | 157 |
| GO:00715609 | Esophagus | ESCC | cellular response to transforming growth factor beta stimulus | 151/8552 | 250/18723 | 1.78e-06 | 2.10e-05 | 151 |
| GO:00071799 | Esophagus | ESCC | transforming growth factor beta receptor signaling pathway | 121/8552 | 198/18723 | 8.26e-06 | 8.03e-05 | 121 |
| GO:000717810 | Esophagus | ESCC | transmembrane receptor protein serine/threonine kinase signaling pathway | 195/8552 | 355/18723 | 2.58e-04 | 1.58e-03 | 195 |
| GO:00170156 | Esophagus | ESCC | regulation of transforming growth factor beta receptor signaling pathway | 75/8552 | 128/18723 | 2.19e-03 | 9.71e-03 | 75 |
| GO:19038447 | Esophagus | ESCC | regulation of cellular response to transforming growth factor beta stimulus | 76/8552 | 131/18723 | 2.96e-03 | 1.24e-02 | 76 |
| Page: 1 |
| Pathway ID | Tissue | Disease Stage | Description | Gene Ratio | Bg Ratio | pvalue | p.adjust | qvalue | Count |
| Page: 1 |
Top |
Cell-cell communication analysis |
| Identification of potential cell-cell interactions between two cell types and their ligand-receptor pairs for different disease states |
| Ligand | Receptor | LRpair | Pathway | Tissue | Disease Stage |
| Page: 1 |
Top |
Single-cell gene regulatory network inference analysis |
| Find out the significant the regulons (TFs) and the target genes of each regulon across cell types for different disease states |
| TF | Cell Type | Tissue | Disease Stage | Target Gene | RSS | Regulon Activity |
| ∗The dot plots of a searched regulon are shown for all cell subpopulations in each disease state of each tissue based on the regulon specific score inferred using pySCENIC and by calculating the average expression. |
| Page: 1 |
Top |
Somatic mutation of malignant transformation related genes |
| Annotation of somatic variants for genes involved in malignant transformation |
| Hugo Symbol | Variant Class | Variant Classification | dbSNP RS | HGVSc | HGVSp | HGVSp Short | SWISSPROT | BIOTYPE | SIFT | PolyPhen | Tumor Sample Barcode | Tissue | Histology | Sex | Age | Stage | Therapy Types | Drugs | Outcome |
| LEMD3 | SNV | Missense_Mutation | rs376532238 | c.2702N>A | p.Arg901Gln | p.R901Q | Q9Y2U8 | protein_coding | deleterious_low_confidence(0.03) | probably_damaging(0.978) | TCGA-AN-A046-01 | Breast | breast invasive carcinoma | Female | >=65 | I/II | Unknown | Unknown | SD |
| LEMD3 | SNV | Missense_Mutation | c.1033N>T | p.Gly345Trp | p.G345W | Q9Y2U8 | protein_coding | deleterious_low_confidence(0) | benign(0.012) | TCGA-AR-A0TW-01 | Breast | breast invasive carcinoma | Female | <65 | III/IV | Chemotherapy | doxorubicin | PD | |
| LEMD3 | SNV | Missense_Mutation | novel | c.179N>A | p.Gly60Asp | p.G60D | Q9Y2U8 | protein_coding | deleterious(0.05) | benign(0.199) | TCGA-2W-A8YY-01 | Cervix | cervical & endocervical cancer | Female | <65 | I/II | Chemotherapy | cisplatin | CR |
| LEMD3 | SNV | Missense_Mutation | rs201280850 | c.2695N>T | p.Arg899Cys | p.R899C | Q9Y2U8 | protein_coding | deleterious_low_confidence(0) | probably_damaging(0.928) | TCGA-AA-3678-01 | Colorectum | colon adenocarcinoma | Female | <65 | III/IV | Chemotherapy | folinic | CR |
| LEMD3 | SNV | Missense_Mutation | c.1252N>A | p.Ala418Thr | p.A418T | Q9Y2U8 | protein_coding | tolerated(0.94) | benign(0) | TCGA-AA-3715-01 | Colorectum | colon adenocarcinoma | Male | >=65 | I/II | Unknown | Unknown | PD | |
| LEMD3 | SNV | Missense_Mutation | novel | c.1183N>A | p.Gly395Ser | p.G395S | Q9Y2U8 | protein_coding | tolerated(0.35) | benign(0) | TCGA-AA-3950-01 | Colorectum | colon adenocarcinoma | Female | >=65 | I/II | Unknown | Unknown | SD |
| LEMD3 | SNV | Missense_Mutation | novel | c.134N>C | p.Lys45Thr | p.K45T | Q9Y2U8 | protein_coding | deleterious(0) | possibly_damaging(0.874) | TCGA-AA-A00N-01 | Colorectum | colon adenocarcinoma | Male | >=65 | I/II | Unknown | Unknown | PD |
| LEMD3 | SNV | Missense_Mutation | rs769674069 | c.2191N>T | p.Arg731Cys | p.R731C | Q9Y2U8 | protein_coding | deleterious(0.01) | probably_damaging(0.992) | TCGA-AA-A00N-01 | Colorectum | colon adenocarcinoma | Male | >=65 | I/II | Unknown | Unknown | PD |
| LEMD3 | SNV | Missense_Mutation | c.2381N>T | p.Pro794Leu | p.P794L | Q9Y2U8 | protein_coding | deleterious(0.02) | benign(0.118) | TCGA-AA-A00N-01 | Colorectum | colon adenocarcinoma | Male | >=65 | I/II | Unknown | Unknown | PD | |
| LEMD3 | SNV | Missense_Mutation | c.1706N>A | p.Pro569His | p.P569H | Q9Y2U8 | protein_coding | deleterious(0.01) | probably_damaging(0.95) | TCGA-AA-A010-01 | Colorectum | colon adenocarcinoma | Female | <65 | I/II | Chemotherapy | folinic | CR |
| Page: 1 2 3 4 5 6 7 |
Top |
Related drugs of malignant transformation related genes |
| Identification of chemicals and drugs interact with genes involved in malignant transfromation |
| (DGIdb 4.0) |
| Entrez ID | Symbol | Category | Interaction Types | Drug Claim Name | Drug Name | PMIDs |
| Page: 1 |

Copyright 2023-Present -The University of Texas Health Science Center at Houston |