Schematic overview of the cellular and molecular mechanisms involved in the cancer progression, including the proposed cellular and molecular mechanisms in cancer cells trajectory. AT1: alveolar type 1 cells; AT2: alveolar type 2 cells; AAH: atypical adenomatous hyperplasia; AIS: adenocarcinoma in situ; MIA: minimally invasive adenocarcinoma; IA: invasive adenocarcinoma; EMT: epithelial-mesenchymal transition

Home

Download

Statistics

Help

Contact

Center for Computational Systems Medicine
leaf

Gene summary

leaf

Malignant transformation analysis

leaf

Malignant transformation related pathway analysis

leaf

Cell-cell communication analysis

leaf

Single-cell gene regulatory network inference analysis

leaf

Somatic mutation of malignant transformation related genes

leaf

Related drugs of malignant transformation related genes

Gene: LEMD2

Gene summary for LEMD2

check button Gene summary.

Gene informationSpeciesHuman
Gene symbol

LEMD2

Gene ID

221496

Gene nameLEM domain nuclear envelope protein 2
Gene AliasCTRCT42
Cytomap6p21.31
Gene Typeprotein-coding
GO ID

GO:0000165

UniProtAcc

Q8NC56


Top

Malignant transformation analysis

check button Identification of the aberrant gene expression in precancerous and cancerous lesions by comparing the gene expression of stem-like cells in diseased tissues with normal stem cells
check button Malignant transformation involving gene list.
Entrez IDSymbolReplicatesSpeciesOrganTissueAdj P-valueLog2FCMalignancy
221496LEMD2HTA11_3410_2000001011HumanColorectumAD2.33e-041.50e-010.0155
221496LEMD2HTA11_1938_2000001011HumanColorectumAD4.19e-042.73e-01-0.0811
221496LEMD2HTA11_78_2000001011HumanColorectumAD6.00e-052.57e-01-0.1088
221496LEMD2HTA11_347_2000001011HumanColorectumAD1.78e-143.54e-01-0.1954
221496LEMD2HTA11_411_2000001011HumanColorectumSER1.60e-078.72e-01-0.2602
221496LEMD2HTA11_3361_2000001011HumanColorectumAD3.89e-031.91e-01-0.1207
221496LEMD2HTA11_83_2000001011HumanColorectumSER2.02e-022.43e-01-0.1526
221496LEMD2HTA11_696_2000001011HumanColorectumAD3.64e-052.70e-01-0.1464
221496LEMD2HTA11_866_2000001011HumanColorectumAD6.46e-052.31e-01-0.1001
221496LEMD2HTA11_1391_2000001011HumanColorectumAD8.07e-113.95e-01-0.059
221496LEMD2HTA11_546_2000001011HumanColorectumAD4.62e-043.39e-01-0.0842
221496LEMD2HTA11_866_3004761011HumanColorectumAD2.03e-062.32e-010.096
221496LEMD2HTA11_7663_2000001011HumanColorectumSER9.50e-033.70e-010.0131
221496LEMD2HTA11_7696_3000711011HumanColorectumAD1.14e-022.16e-010.0674
221496LEMD2HTA11_99999965104_69814HumanColorectumMSS1.87e-073.09e-010.281
221496LEMD2HTA11_99999971662_82457HumanColorectumMSS1.99e-043.29e-010.3859
221496LEMD2HTA11_99999973899_84307HumanColorectumMSS6.01e-043.43e-010.2585
221496LEMD2LZE24THumanEsophagusESCC3.16e-082.69e-010.0596
221496LEMD2P1T-EHumanEsophagusESCC3.04e-125.86e-010.0875
221496LEMD2P2T-EHumanEsophagusESCC1.13e-507.44e-010.1177
Page: 1 2 3 4 5 6 

check button Transcriptomic changes along malignancy continuum.
TissueExpression DynamicsAbbreviation
Colorectum (GSE201348)The image shows the transcriptomic changes along malignancy continuum.log2FC in expression of this searched gene in stem-like cells from each diseased tissue sample relative to stem-like cells in normal samples in each tissue plotted against the malignancy continuum. Samples are colored based on if they are from different disease stage.FAP: Familial adenomatous polyposis
CRC: Colorectal cancer
Colorectum (HTA11)The image shows the transcriptomic changes along malignancy continuum.log2FC in expression of this searched gene in stem-like cells from each diseased tissue sample relative to stem-like cells in normal samples in each tissue plotted against the malignancy continuum. Samples are colored based on if they are from different disease stage.AD: Adenomas
SER: Sessile serrated lesions
MSI-H: Microsatellite-high colorectal cancer
MSS: Microsatellite stable colorectal cancer
EsophagusThe image shows the transcriptomic changes along malignancy continuum.log2FC in expression of this searched gene in stem-like cells from each diseased tissue sample relative to stem-like cells in normal samples in each tissue plotted against the malignancy continuum. Samples are colored based on if they are from different disease stage.
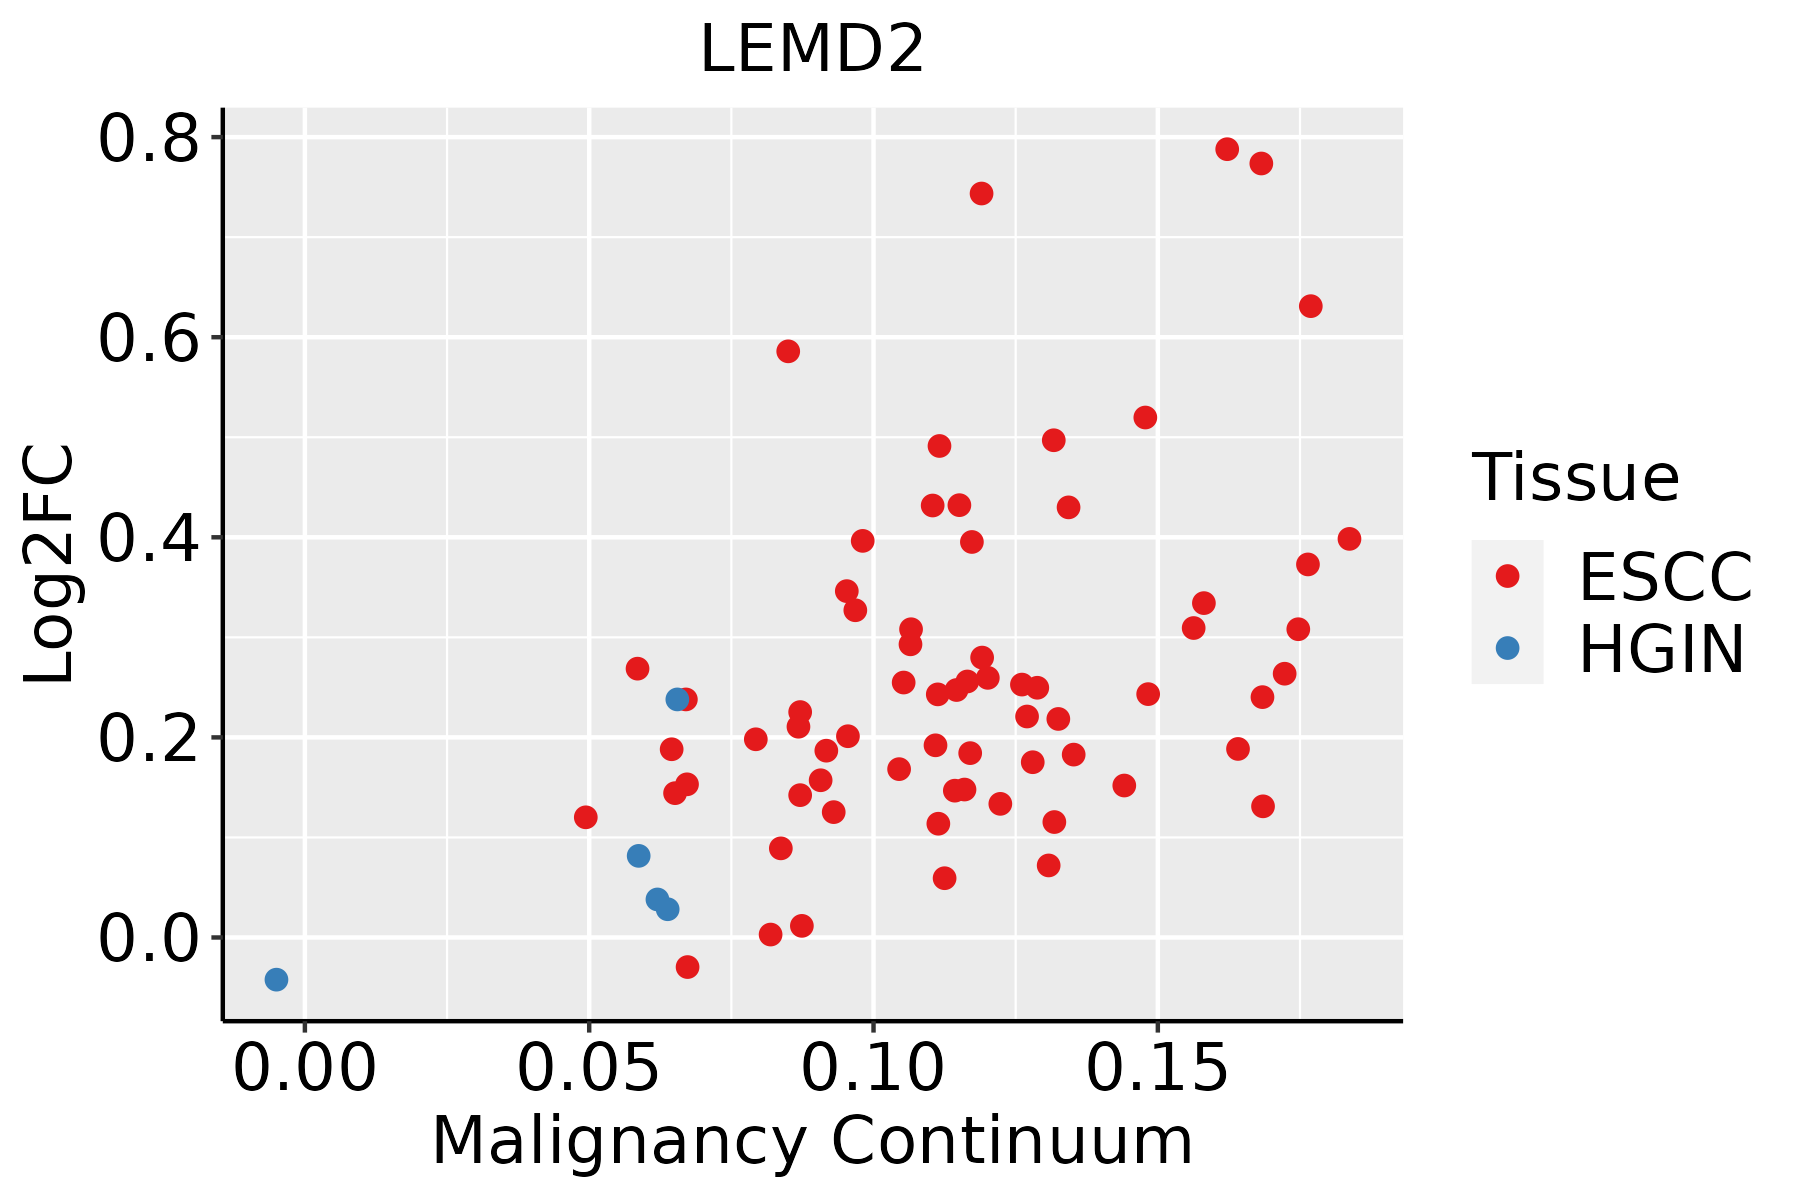
ESCC: Esophageal squamous cell carcinoma
HGIN: High-grade intraepithelial neoplasias
LGIN: Low-grade intraepithelial neoplasias
LiverThe image shows the transcriptomic changes along malignancy continuum.log2FC in expression of this searched gene in stem-like cells from each diseased tissue sample relative to stem-like cells in normal samples in each tissue plotted against the malignancy continuum. Samples are colored based on if they are from different disease stage.
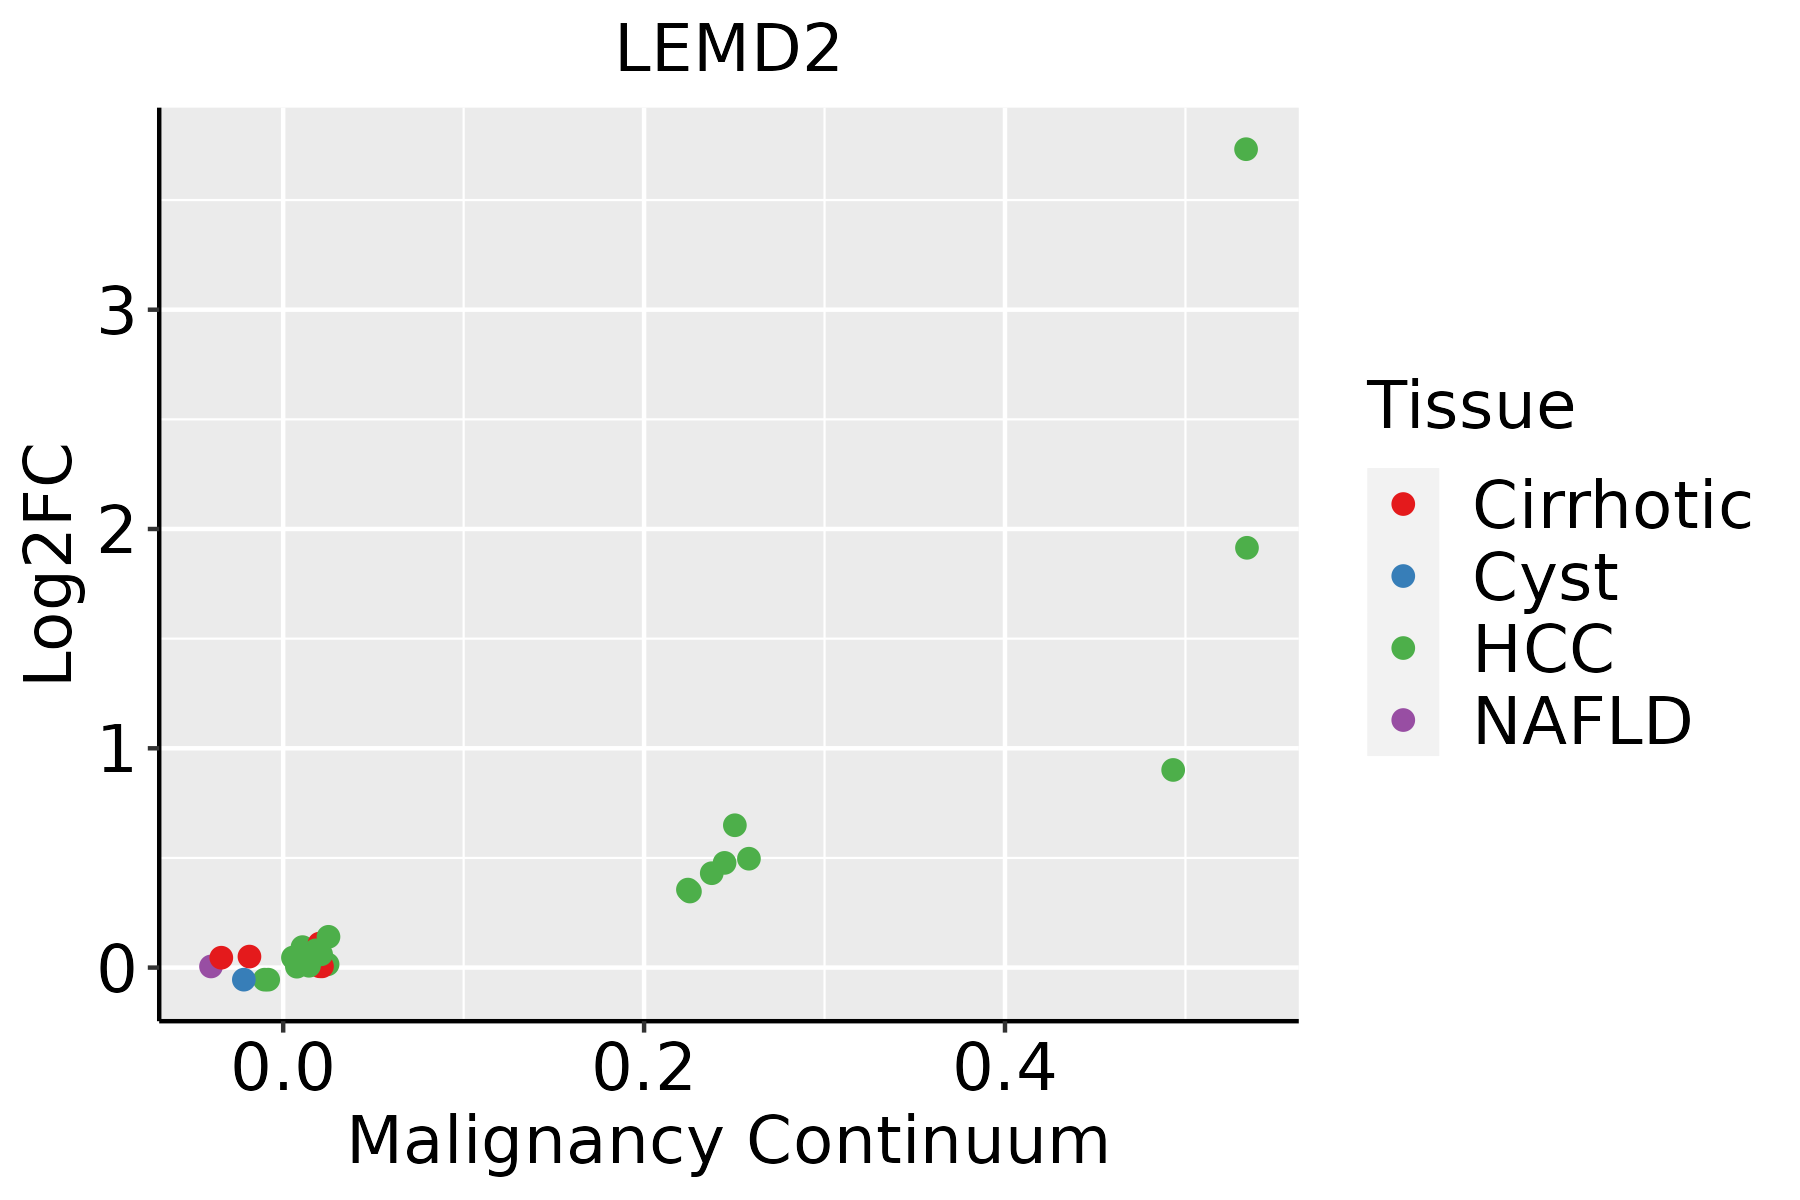
HCC: Hepatocellular carcinoma
NAFLD: Non-alcoholic fatty liver disease
Oral CavityThe image shows the transcriptomic changes along malignancy continuum.log2FC in expression of this searched gene in stem-like cells from each diseased tissue sample relative to stem-like cells in normal samples in each tissue plotted against the malignancy continuum. Samples are colored based on if they are from different disease stage.
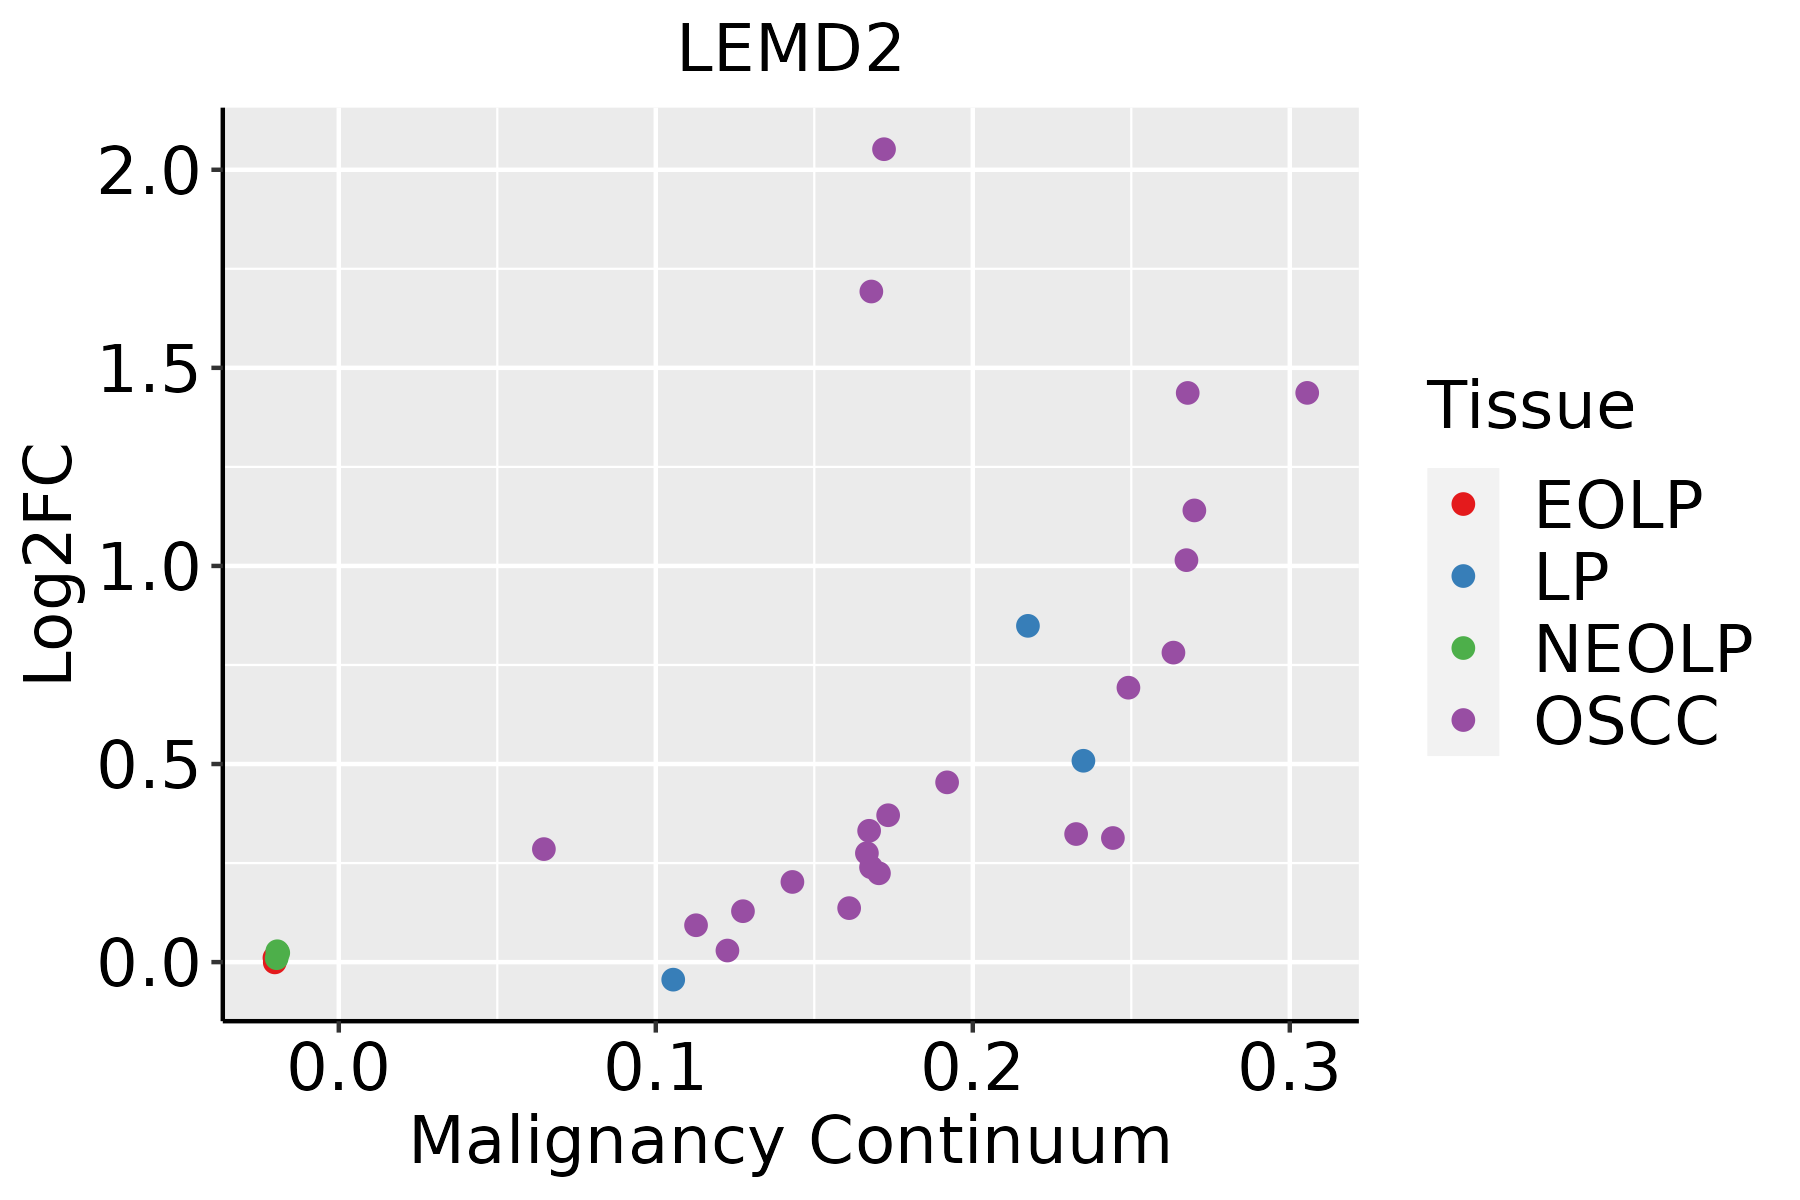
EOLP: Erosive Oral lichen planus
LP: leukoplakia
NEOLP: Non-erosive oral lichen planus
OSCC: Oral squamous cell carcinoma
SkinThe image shows the transcriptomic changes along malignancy continuum.log2FC in expression of this searched gene in stem-like cells from each diseased tissue sample relative to stem-like cells in normal samples in each tissue plotted against the malignancy continuum. Samples are colored based on if they are from different disease stage.
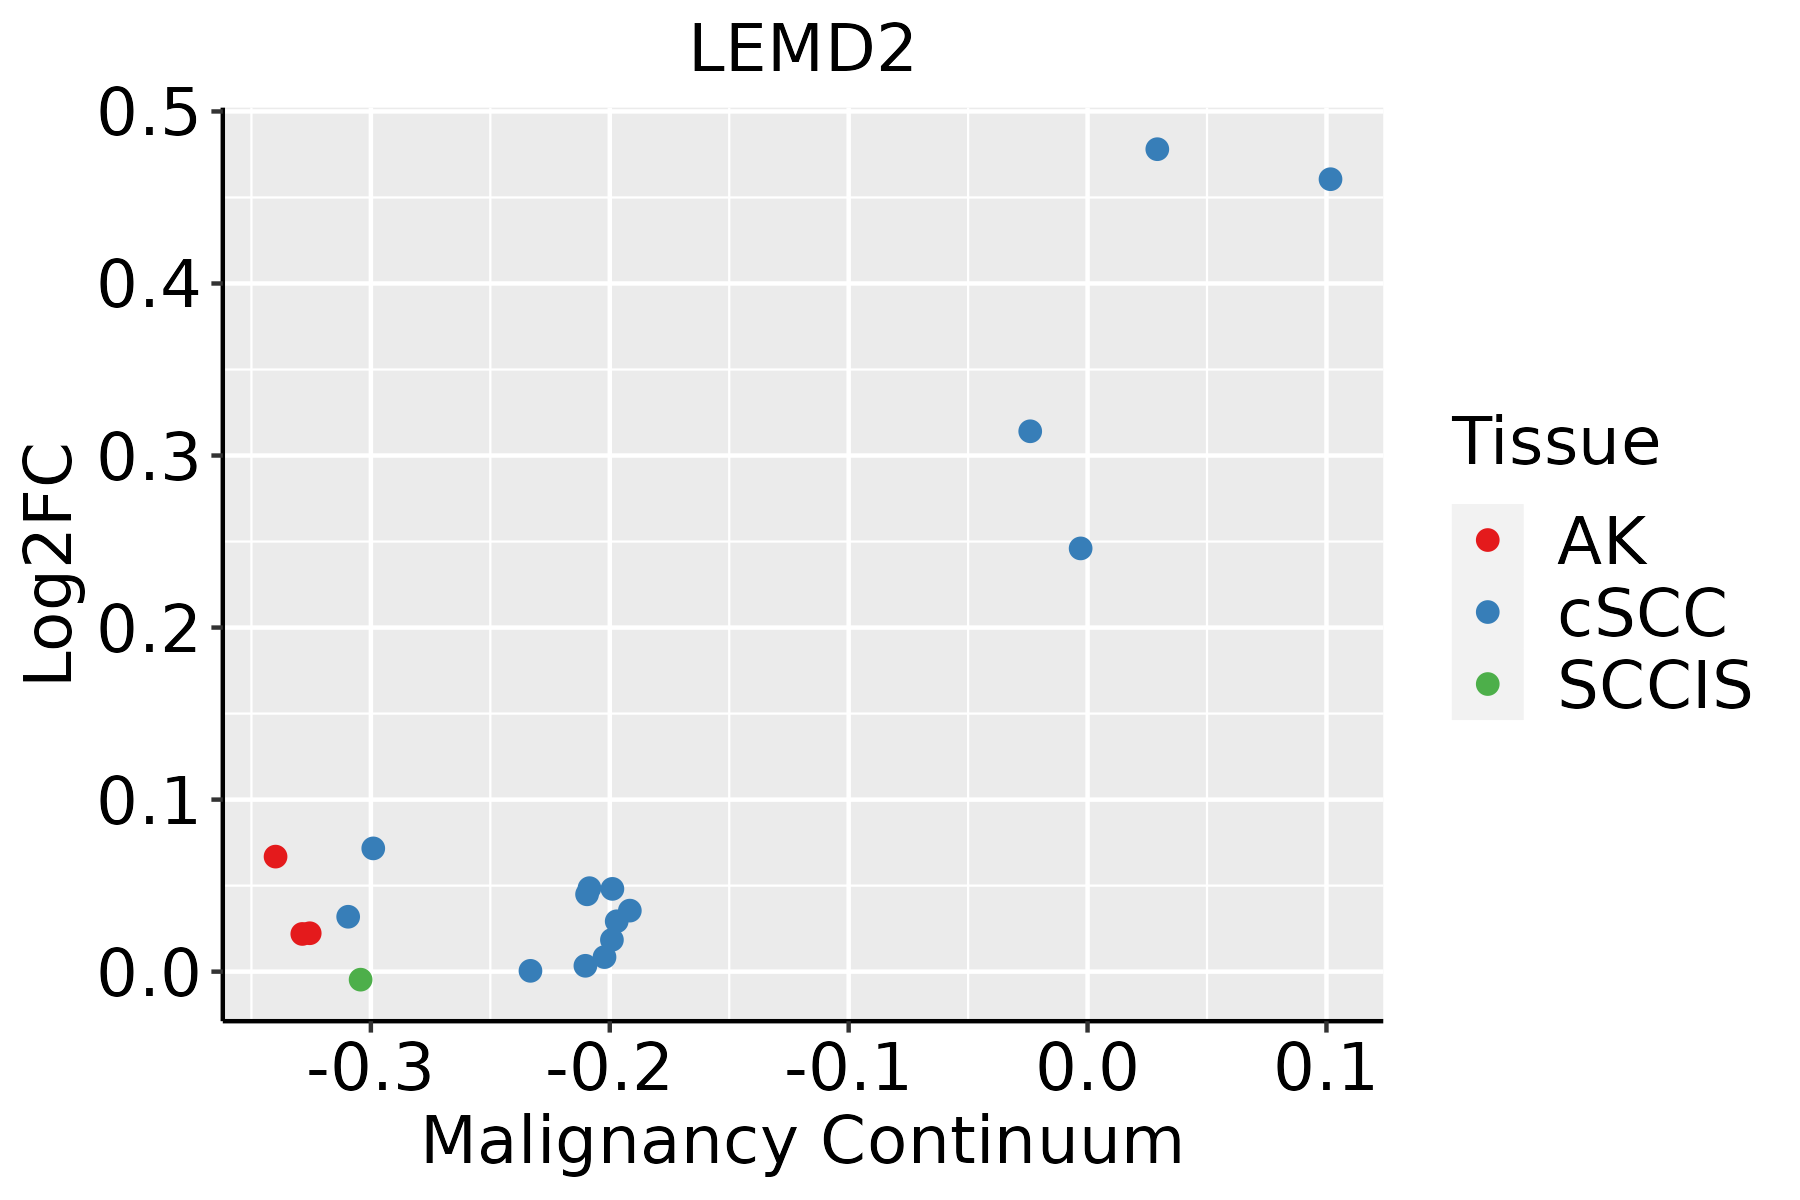
AK: Actinic keratosis
cSCC: Cutaneous squamous cell carcinoma
SCCIS:squamous cell carcinoma in situ
∗log2FC in expression of this searched gene in stem-like cells from each diseased tissue sample relative to stem-like cells in normal samples in each tissue plotted against the malignancy continuum. Samples are colored based on if they are from different disease stage.

Top

Malignant transformation related pathway analysis

check buttonFind out the enriched GO biological processes and KEGG pathways involved in transition from healthy to precancer to cancer
check button Figure of enriched GO biological processes.
TissueDisease StageEnriched GO biological Processes
ColorectumADGO analysis - Figure of enriched GO biological processes: Top 15 enriched GO BP terms are showed in the bar plot of each disease state in each tissue. Each row represents a significant GO biological process which is colored according to the -log10(p.adjust).
ColorectumSERGO analysis - Figure of enriched GO biological processes: Top 15 enriched GO BP terms are showed in the bar plot of each disease state in each tissue. Each row represents a significant GO biological process which is colored according to the -log10(p.adjust).
ColorectumMSSGO analysis - Figure of enriched GO biological processes: Top 15 enriched GO BP terms are showed in the bar plot of each disease state in each tissue. Each row represents a significant GO biological process which is colored according to the -log10(p.adjust).
ColorectumMSI-HGO analysis - Figure of enriched GO biological processes: Top 15 enriched GO BP terms are showed in the bar plot of each disease state in each tissue. Each row represents a significant GO biological process which is colored according to the -log10(p.adjust).
ColorectumFAPGO analysis - Figure of enriched GO biological processes: Top 15 enriched GO BP terms are showed in the bar plot of each disease state in each tissue. Each row represents a significant GO biological process which is colored according to the -log10(p.adjust).
∗Top 15 enriched GO BP terms are showed in the bar plot of each disease state in each tissue. Each row represents a significant GO biological process which is colored according to the -log10(p.adjust).
Page: 1 2 3 4 5 6 7 8 9 

check button Enriched GO biological processes.
GO IDTissueDisease StageDescriptionGene RatioBg Ratiopvaluep.adjustCount
GO:0043409ColorectumADnegative regulation of MAPK cascade57/3918180/187234.61e-045.14e-0357
GO:0007178ColorectumADtransmembrane receptor protein serine/threonine kinase signaling pathway99/3918355/187239.92e-049.28e-0399
GO:00434091ColorectumSERnegative regulation of MAPK cascade45/2897180/187235.81e-047.98e-0345
GO:00434092ColorectumMSSnegative regulation of MAPK cascade50/3467180/187231.45e-031.35e-0250
GO:00071781ColorectumMSStransmembrane receptor protein serine/threonine kinase signaling pathway86/3467355/187234.04e-032.95e-0286
GO:000699713EsophagusESCCnucleus organization96/8552133/187234.66e-101.21e-0896
GO:003450211EsophagusESCCprotein localization to chromosome70/855292/187232.54e-095.64e-0870
GO:000699811EsophagusESCCnuclear envelope organization39/855247/187231.48e-072.35e-0639
GO:000717810EsophagusESCCtransmembrane receptor protein serine/threonine kinase signaling pathway195/8552355/187232.58e-041.58e-03195
GO:0043409110EsophagusESCCnegative regulation of MAPK cascade105/8552180/187234.13e-042.35e-03105
GO:006053716EsophagusESCCmuscle tissue development211/8552403/187233.84e-031.56e-02211
GO:0071168EsophagusESCCprotein localization to chromatin21/855231/187231.10e-023.70e-0221
GO:001470615EsophagusESCCstriated muscle tissue development197/8552384/187231.46e-024.74e-02197
GO:00069971LiverHCCnucleus organization82/7958133/187236.32e-067.72e-0582
GO:0006998LiverHCCnuclear envelope organization34/795847/187233.27e-053.29e-0434
GO:00345021LiverHCCprotein localization to chromosome55/795892/187236.12e-043.82e-0355
GO:00434097LiverHCCnegative regulation of MAPK cascade98/7958180/187237.88e-044.74e-0398
GO:00069974Oral cavityOSCCnucleus organization85/7305133/187235.12e-091.12e-0785
GO:00069982Oral cavityOSCCnuclear envelope organization37/730547/187233.19e-086.12e-0737
GO:004340917Oral cavityOSCCnegative regulation of MAPK cascade105/7305180/187231.10e-071.87e-06105
Page: 1 2 

check button Enriched KEGG pathways.
Pathway IDTissueDisease StageDescriptionGene RatioBg Ratiopvaluep.adjustqvalueCount
Page: 1 

Top

Cell-cell communication analysis

check buttonIdentification of potential cell-cell interactions between two cell types and their ligand-receptor pairs for different disease states
LigandReceptorLRpairPathwayTissueDisease Stage
Page: 1 

Top

Single-cell gene regulatory network inference analysis

check buttonFind out the significant the regulons (TFs) and the target genes of each regulon across cell types for different disease states
TFCell TypeTissueDisease StageTarget GeneRSSRegulon Activity
∗The dot plots of a searched regulon are shown for all cell subpopulations in each disease state of each tissue based on the regulon specific score inferred using pySCENIC and by calculating the average expression.
Page: 1 

Top

Somatic mutation of malignant transformation related genes

check buttonAnnotation of somatic variants for genes involved in malignant transformation
Hugo SymbolVariant ClassVariant ClassificationdbSNP RSHGVScHGVSpHGVSp ShortSWISSPROTBIOTYPESIFTPolyPhenTumor Sample BarcodeTissueHistologySexAgeStageTherapy TypesDrugsOutcome
LEMD2SNVMissense_Mutationnovelc.1003G>Ap.Gly335Serp.G335SQ8NC56protein_codingdeleterious(0)probably_damaging(1)TCGA-A7-A4SE-01Breastbreast invasive carcinomaFemale<65I/IIChemotherapyadriamycinCR
LEMD2SNVMissense_Mutationc.1453G>Cp.Glu485Glnp.E485QQ8NC56protein_codingdeleterious(0.01)probably_damaging(0.996)TCGA-AC-A23H-01Breastbreast invasive carcinomaFemale>=65I/IIUnknownUnknownPD
LEMD2SNVMissense_Mutationc.815T>Cp.Leu272Prop.L272PQ8NC56protein_codingdeleterious(0)possibly_damaging(0.757)TCGA-E2-A14R-01Breastbreast invasive carcinomaFemale<65I/IIChemotherapydoxorubicinPD
LEMD2insertionIn_Frame_Insnovelc.1008_1009insATGTTGp.Ile336_Trp337insMetLeup.I336_W337insMLQ8NC56protein_codingTCGA-A2-A0CU-01Breastbreast invasive carcinomaFemale>=65I/IIHormone TherapytamoxiphenSD
LEMD2insertionIn_Frame_Insnovelc.1006_1007insAGAATGATGACACTCACCTTTp.Ile336delinsLysAsnAspAspThrHisLeuPhep.I336delinsKNDDTHLFQ8NC56protein_codingTCGA-A2-A0CU-01Breastbreast invasive carcinomaFemale>=65I/IIHormone TherapytamoxiphenSD
LEMD2insertionIn_Frame_Insnovelc.1182_1183insGAAATTAGAACAAGTGAAp.Leu394_Ile395insGluIleArgThrSerGlup.L394_I395insEIRTSEQ8NC56protein_codingTCGA-AN-A0FW-01Breastbreast invasive carcinomaFemale>=65III/IVUnknownUnknownSD
LEMD2SNVMissense_Mutationnovelc.1261N>Cp.Val421Leup.V421LQ8NC56protein_codingdeleterious(0.01)possibly_damaging(0.769)TCGA-C5-A1MH-01Cervixcervical & endocervical cancerFemale>=65III/IVChemotherapycisplatinPD
LEMD2SNVMissense_Mutationc.1057G>Ap.Val353Metp.V353MQ8NC56protein_codingdeleterious(0)possibly_damaging(0.867)TCGA-Q1-A73O-01Cervixcervical & endocervical cancerFemale<65I/IIChemotherapycisplatinCR
LEMD2SNVMissense_Mutationrs768891530c.1103N>Ap.Arg368Hisp.R368HQ8NC56protein_codingdeleterious(0)probably_damaging(0.999)TCGA-CK-6746-01Colorectumcolon adenocarcinomaFemale>=65I/IIUnknownUnknownSD
LEMD2SNVMissense_Mutationc.965N>Tp.Ala322Valp.A322VQ8NC56protein_codingtolerated(0.38)possibly_damaging(0.562)TCGA-AP-A0LP-01Endometriumuterine corpus endometrioid carcinomaFemale>=65I/IIHormone TherapymegaceSD
Page: 1 2 3 4 

Top

Related drugs of malignant transformation related genes

check buttonIdentification of chemicals and drugs interact with genes involved in malignant transfromation
(DGIdb 4.0)
Entrez IDSymbolCategoryInteraction TypesDrug Claim NameDrug NamePMIDs
Page: 1