
|
|||||
|
 | |
| |
| |
| |
| |
| |
|
Gene: LEFTY1 |
Gene summary for LEFTY1 |
| Gene information | Species | Human | Gene symbol | LEFTY1 | Gene ID | 10637 |
| Gene name | left-right determination factor 1 | |
| Gene Alias | LEFTB | |
| Cytomap | 1q42.12 | |
| Gene Type | protein-coding | GO ID | GO:0000122 | UniProtAcc | O75610 |
Top |
Malignant transformation analysis |
| Identification of the aberrant gene expression in precancerous and cancerous lesions by comparing the gene expression of stem-like cells in diseased tissues with normal stem cells |
| Entrez ID | Symbol | Replicates | Species | Organ | Tissue | Adj P-value | Log2FC | Malignancy |
| 10637 | LEFTY1 | HTA11_3410_2000001011 | Human | Colorectum | AD | 6.07e-25 | 9.42e-01 | 0.0155 |
| 10637 | LEFTY1 | HTA11_2951_2000001011 | Human | Colorectum | AD | 8.63e-06 | 9.69e-01 | 0.0216 |
| 10637 | LEFTY1 | HTA11_347_2000001011 | Human | Colorectum | AD | 2.23e-18 | 1.07e+00 | -0.1954 |
| 10637 | LEFTY1 | HTA11_696_2000001011 | Human | Colorectum | AD | 5.16e-06 | 6.17e-01 | -0.1464 |
| 10637 | LEFTY1 | HTA11_2992_2000001011 | Human | Colorectum | SER | 5.30e-06 | 1.10e+00 | -0.1706 |
| 10637 | LEFTY1 | HTA11_546_2000001011 | Human | Colorectum | AD | 4.68e-07 | 7.81e-01 | -0.0842 |
| 10637 | LEFTY1 | HTA11_7862_2000001011 | Human | Colorectum | AD | 1.25e-23 | 1.44e+00 | -0.0179 |
| 10637 | LEFTY1 | HTA11_866_3004761011 | Human | Colorectum | AD | 4.32e-37 | 1.29e+00 | 0.096 |
| 10637 | LEFTY1 | HTA11_4255_2000001011 | Human | Colorectum | SER | 4.00e-19 | 1.51e+00 | 0.0446 |
| 10637 | LEFTY1 | HTA11_9408_2000001011 | Human | Colorectum | AD | 9.38e-13 | 1.65e+00 | 0.0451 |
| 10637 | LEFTY1 | HTA11_8622_2000001021 | Human | Colorectum | SER | 1.13e-17 | 1.63e+00 | 0.0528 |
| 10637 | LEFTY1 | HTA11_7663_2000001011 | Human | Colorectum | SER | 1.87e-21 | 1.66e+00 | 0.0131 |
| 10637 | LEFTY1 | HTA11_10623_2000001011 | Human | Colorectum | AD | 1.54e-12 | 1.32e+00 | -0.0177 |
| 10637 | LEFTY1 | HTA11_6801_2000001011 | Human | Colorectum | SER | 3.33e-12 | 1.49e+00 | 0.0171 |
| 10637 | LEFTY1 | HTA11_10711_2000001011 | Human | Colorectum | AD | 4.11e-10 | 6.31e-01 | 0.0338 |
| 10637 | LEFTY1 | HTA11_7696_3000711011 | Human | Colorectum | AD | 6.96e-58 | 1.90e+00 | 0.0674 |
| 10637 | LEFTY1 | HTA11_6818_2000001011 | Human | Colorectum | AD | 3.16e-21 | 1.65e+00 | 0.0112 |
| 10637 | LEFTY1 | HTA11_7469_2000001011 | Human | Colorectum | AD | 3.04e-14 | 1.66e+00 | -0.0124 |
| 10637 | LEFTY1 | HTA11_11156_2000001011 | Human | Colorectum | AD | 1.08e-10 | 1.68e+00 | 0.0397 |
| 10637 | LEFTY1 | HTA11_6818_2000001021 | Human | Colorectum | AD | 3.55e-39 | 2.24e+00 | 0.0588 |
| Page: 1 2 3 |
| Tissue | Expression Dynamics | Abbreviation |
| Colorectum (GSE201348) |  | FAP: Familial adenomatous polyposis |
| CRC: Colorectal cancer | ||
| Colorectum (HTA11) |  | AD: Adenomas |
| SER: Sessile serrated lesions | ||
| MSI-H: Microsatellite-high colorectal cancer | ||
| MSS: Microsatellite stable colorectal cancer | ||
| Endometrium | 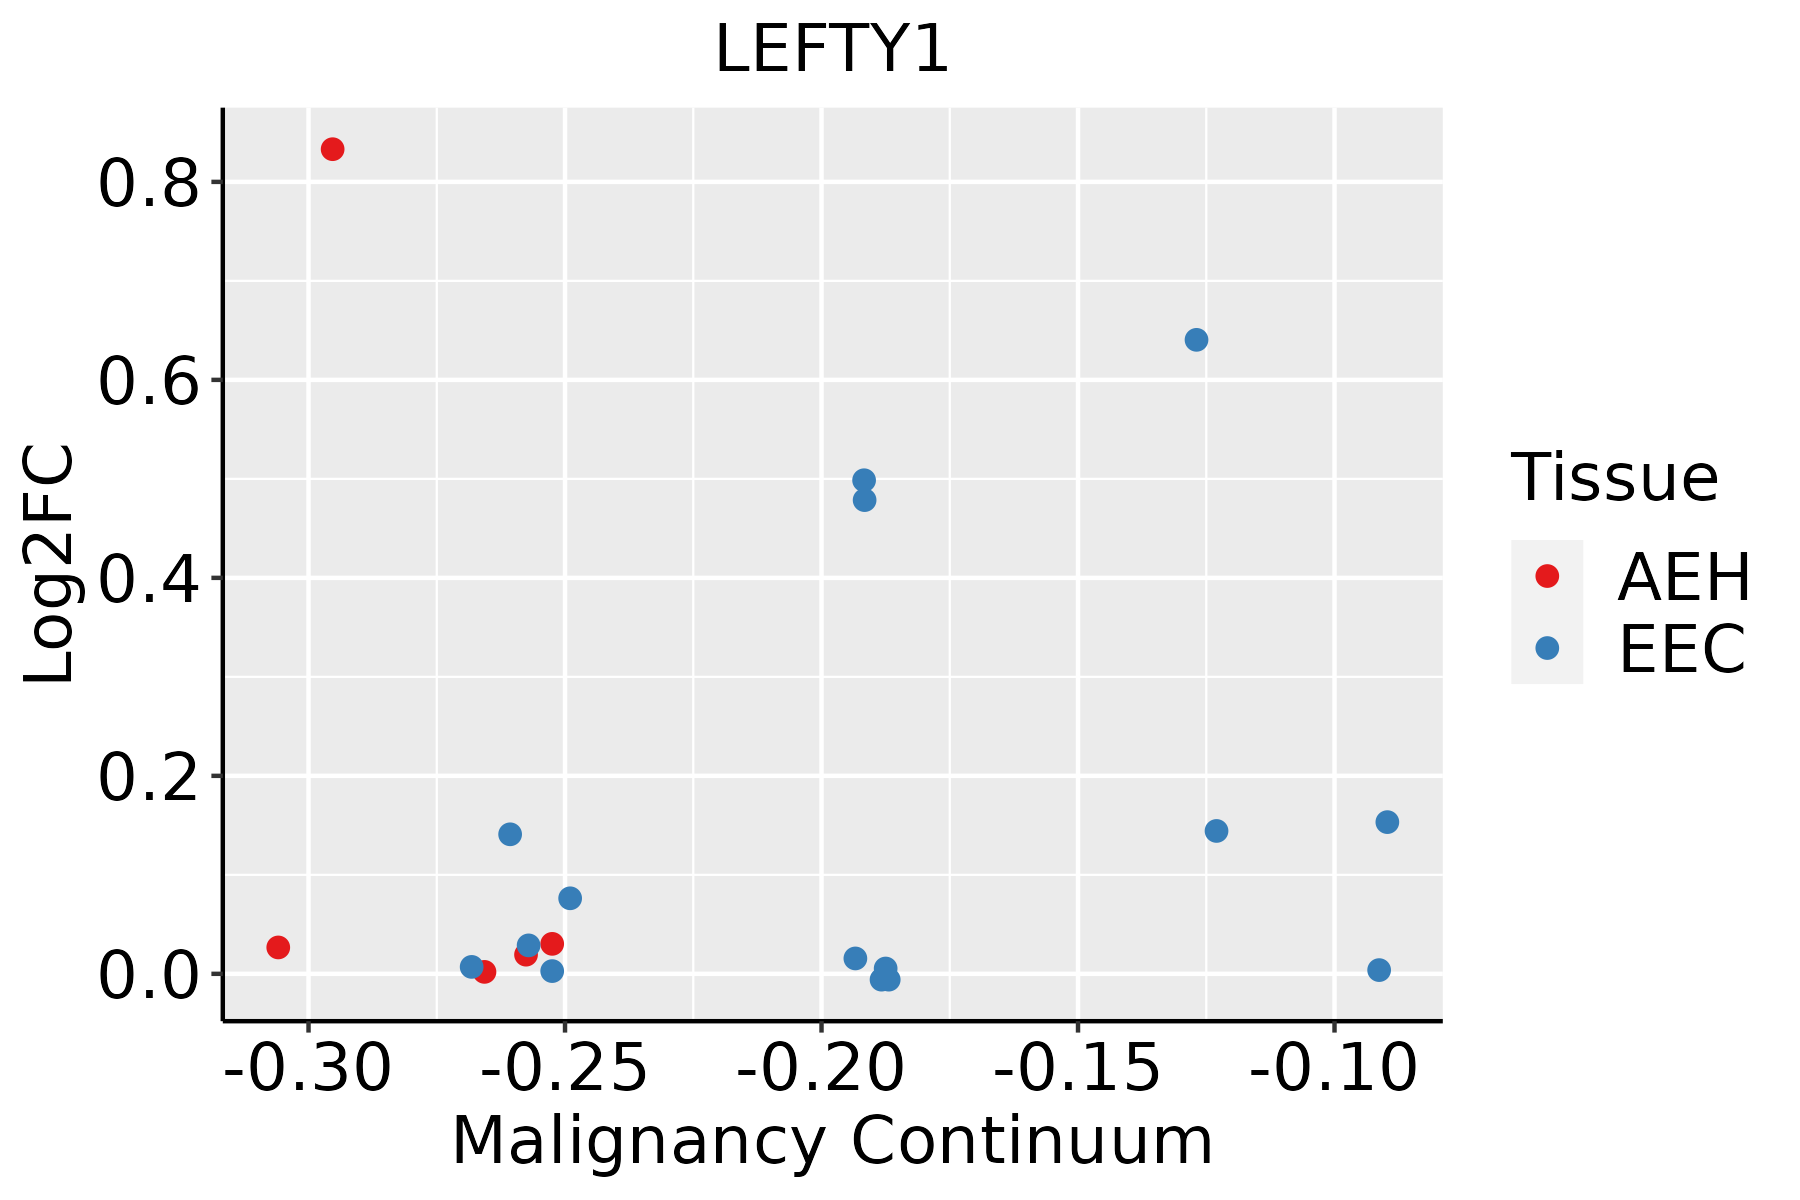 | AEH: Atypical endometrial hyperplasia |
| EEC: Endometrioid Cancer |
| ∗log2FC in expression of this searched gene in stem-like cells from each diseased tissue sample relative to stem-like cells in normal samples in each tissue plotted against the malignancy continuum. Samples are colored based on if they are from different disease stage. |
Top |
Malignant transformation related pathway analysis |
| Find out the enriched GO biological processes and KEGG pathways involved in transition from healthy to precancer to cancer |
| Tissue | Disease Stage | Enriched GO biological Processes |
| Colorectum | AD |  |
| Colorectum | SER |  |
| Colorectum | MSS |  |
| Colorectum | MSI-H |  |
| Colorectum | FAP |  |
| ∗Top 15 enriched GO BP terms are showed in the bar plot of each disease state in each tissue. Each row represents a significant GO biological process which is colored according to the -log10(p.adjust). |
| Page: 1 2 3 4 5 6 7 8 9 |
| GO ID | Tissue | Disease Stage | Description | Gene Ratio | Bg Ratio | pvalue | p.adjust | Count |
| GO:0007178 | Colorectum | AD | transmembrane receptor protein serine/threonine kinase signaling pathway | 99/3918 | 355/18723 | 9.92e-04 | 9.28e-03 | 99 |
| GO:0071559 | Colorectum | AD | response to transforming growth factor beta | 74/3918 | 256/18723 | 1.45e-03 | 1.23e-02 | 74 |
| GO:0071560 | Colorectum | AD | cellular response to transforming growth factor beta stimulus | 72/3918 | 250/18723 | 1.85e-03 | 1.52e-02 | 72 |
| GO:0007179 | Colorectum | AD | transforming growth factor beta receptor signaling pathway | 59/3918 | 198/18723 | 1.94e-03 | 1.58e-02 | 59 |
| GO:0060395 | Colorectum | AD | SMAD protein signal transduction | 28/3918 | 82/18723 | 3.73e-03 | 2.63e-02 | 28 |
| GO:00071781 | Colorectum | MSS | transmembrane receptor protein serine/threonine kinase signaling pathway | 86/3467 | 355/18723 | 4.04e-03 | 2.95e-02 | 86 |
| GO:00715591 | Colorectum | FAP | response to transforming growth factor beta | 63/2622 | 256/18723 | 3.82e-06 | 1.32e-04 | 63 |
| GO:00071782 | Colorectum | FAP | transmembrane receptor protein serine/threonine kinase signaling pathway | 81/2622 | 355/18723 | 4.28e-06 | 1.46e-04 | 81 |
| GO:00715601 | Colorectum | FAP | cellular response to transforming growth factor beta stimulus | 61/2622 | 250/18723 | 7.22e-06 | 2.19e-04 | 61 |
| GO:00071791 | Colorectum | FAP | transforming growth factor beta receptor signaling pathway | 50/2622 | 198/18723 | 1.75e-05 | 4.44e-04 | 50 |
| GO:00603951 | Colorectum | FAP | SMAD protein signal transduction | 24/2622 | 82/18723 | 2.55e-04 | 3.51e-03 | 24 |
| GO:0071772 | Colorectum | FAP | response to BMP | 37/2622 | 165/18723 | 2.20e-03 | 1.80e-02 | 37 |
| GO:0071773 | Colorectum | FAP | cellular response to BMP stimulus | 37/2622 | 165/18723 | 2.20e-03 | 1.80e-02 | 37 |
| GO:0060389 | Colorectum | FAP | pathway-restricted SMAD protein phosphorylation | 18/2622 | 65/18723 | 2.85e-03 | 2.19e-02 | 18 |
| GO:0090092 | Colorectum | FAP | regulation of transmembrane receptor protein serine/threonine kinase signaling pathway | 52/2622 | 256/18723 | 3.33e-03 | 2.44e-02 | 52 |
| GO:0030509 | Colorectum | FAP | BMP signaling pathway | 34/2622 | 152/18723 | 3.38e-03 | 2.47e-02 | 34 |
| GO:00071783 | Colorectum | CRC | transmembrane receptor protein serine/threonine kinase signaling pathway | 66/2078 | 355/18723 | 1.74e-05 | 5.28e-04 | 66 |
| GO:00715592 | Colorectum | CRC | response to transforming growth factor beta | 51/2078 | 256/18723 | 2.33e-05 | 6.65e-04 | 51 |
| GO:00715602 | Colorectum | CRC | cellular response to transforming growth factor beta stimulus | 49/2078 | 250/18723 | 5.17e-05 | 1.19e-03 | 49 |
| GO:00071792 | Colorectum | CRC | transforming growth factor beta receptor signaling pathway | 39/2078 | 198/18723 | 2.58e-04 | 4.19e-03 | 39 |
| Page: 1 2 3 |
| Pathway ID | Tissue | Disease Stage | Description | Gene Ratio | Bg Ratio | pvalue | p.adjust | qvalue | Count |
| hsa04350 | Colorectum | SER | TGF-beta signaling pathway | 31/1580 | 108/8465 | 7.00e-03 | 3.77e-02 | 2.74e-02 | 31 |
| hsa043501 | Colorectum | SER | TGF-beta signaling pathway | 31/1580 | 108/8465 | 7.00e-03 | 3.77e-02 | 2.74e-02 | 31 |
| hsa043504 | Endometrium | AEH | TGF-beta signaling pathway | 26/1197 | 108/8465 | 3.82e-03 | 2.18e-02 | 1.59e-02 | 26 |
| hsa0435011 | Endometrium | AEH | TGF-beta signaling pathway | 26/1197 | 108/8465 | 3.82e-03 | 2.18e-02 | 1.59e-02 | 26 |
| Page: 1 |
Top |
Cell-cell communication analysis |
| Identification of potential cell-cell interactions between two cell types and their ligand-receptor pairs for different disease states |
| Ligand | Receptor | LRpair | Pathway | Tissue | Disease Stage |
| Page: 1 |
Top |
Single-cell gene regulatory network inference analysis |
| Find out the significant the regulons (TFs) and the target genes of each regulon across cell types for different disease states |
| TF | Cell Type | Tissue | Disease Stage | Target Gene | RSS | Regulon Activity |
| ∗The dot plots of a searched regulon are shown for all cell subpopulations in each disease state of each tissue based on the regulon specific score inferred using pySCENIC and by calculating the average expression. |
| Page: 1 |
Top |
Somatic mutation of malignant transformation related genes |
| Annotation of somatic variants for genes involved in malignant transformation |
| Hugo Symbol | Variant Class | Variant Classification | dbSNP RS | HGVSc | HGVSp | HGVSp Short | SWISSPROT | BIOTYPE | SIFT | PolyPhen | Tumor Sample Barcode | Tissue | Histology | Sex | Age | Stage | Therapy Types | Drugs | Outcome |
| LEFTY1 | insertion | Frame_Shift_Ins | novel | c.777_778insCACTTTG | p.Gly260HisfsTer14 | p.G260Hfs*14 | O75610 | protein_coding | TCGA-A2-A0EO-01 | Breast | breast invasive carcinoma | Female | <65 | I/II | Hormone Therapy | tamoxiphen | SD | ||
| LEFTY1 | insertion | Frame_Shift_Ins | novel | c.826_827insGACAGAGTCTCACTCTGTCACCCAGGCGGGAGTGC | p.Lys276ArgfsTer63 | p.K276Rfs*63 | O75610 | protein_coding | TCGA-AO-A0J4-01 | Breast | breast invasive carcinoma | Female | <65 | I/II | Chemotherapy | doxorubicin | SD | ||
| LEFTY1 | SNV | Missense_Mutation | c.516N>C | p.Glu172Asp | p.E172D | O75610 | protein_coding | tolerated(0.11) | benign(0.19) | TCGA-DR-A0ZM-01 | Cervix | cervical & endocervical cancer | Female | <65 | III/IV | Unspecific | Cisplatin | SD | |
| LEFTY1 | SNV | Missense_Mutation | novel | c.751N>C | p.Cys251Arg | p.C251R | O75610 | protein_coding | deleterious(0) | probably_damaging(0.999) | TCGA-5M-AAT6-01 | Colorectum | colon adenocarcinoma | Female | <65 | III/IV | Unknown | Unknown | PD |
| LEFTY1 | SNV | Missense_Mutation | rs781305776 | c.221G>A | p.Arg74His | p.R74H | O75610 | protein_coding | deleterious(0) | probably_damaging(0.995) | TCGA-AZ-6601-01 | Colorectum | colon adenocarcinoma | Male | >=65 | I/II | Unknown | Unknown | PD |
| LEFTY1 | SNV | Missense_Mutation | c.842N>C | p.Trp281Ser | p.W281S | O75610 | protein_coding | deleterious(0) | probably_damaging(0.991) | TCGA-G4-6302-01 | Colorectum | colon adenocarcinoma | Female | >=65 | I/II | Unknown | Unknown | SD | |
| LEFTY1 | SNV | Missense_Mutation | c.685G>A | p.Gly229Arg | p.G229R | O75610 | protein_coding | tolerated(0.21) | benign(0.011) | TCGA-A5-A0GB-01 | Endometrium | uterine corpus endometrioid carcinoma | Female | >=65 | I/II | Unknown | Unknown | SD | |
| LEFTY1 | SNV | Missense_Mutation | rs150915411 | c.902N>T | p.Pro301Leu | p.P301L | O75610 | protein_coding | deleterious(0.01) | possibly_damaging(0.784) | TCGA-AJ-A2QN-01 | Endometrium | uterine corpus endometrioid carcinoma | Female | <65 | I/II | Unknown | Unknown | SD |
| LEFTY1 | SNV | Missense_Mutation | rs370122681 | c.952G>A | p.Ala318Thr | p.A318T | O75610 | protein_coding | deleterious(0.01) | benign(0.357) | TCGA-AP-A051-01 | Endometrium | uterine corpus endometrioid carcinoma | Female | >=65 | I/II | Unknown | Unknown | SD |
| LEFTY1 | SNV | Missense_Mutation | rs751385730 | c.941G>A | p.Arg314Gln | p.R314Q | O75610 | protein_coding | deleterious(0) | probably_damaging(0.946) | TCGA-AX-A2HG-01 | Endometrium | uterine corpus endometrioid carcinoma | Female | <65 | I/II | Unknown | Unknown | SD |
| Page: 1 2 3 4 |
Top |
Related drugs of malignant transformation related genes |
| Identification of chemicals and drugs interact with genes involved in malignant transfromation |
| (DGIdb 4.0) |
| Entrez ID | Symbol | Category | Interaction Types | Drug Claim Name | Drug Name | PMIDs |
| Page: 1 |

Copyright 2023-Present -The University of Texas Health Science Center at Houston |