
|
|||||
|
 | |
| |
| |
| |
| |
| |
|
Gene: LDOC1 |
Gene summary for LDOC1 |
| Gene information | Species | Human | Gene symbol | LDOC1 | Gene ID | 23641 |
| Gene name | LDOC1 regulator of NFKB signaling | |
| Gene Alias | BCUR1 | |
| Cytomap | Xq27.1 | |
| Gene Type | protein-coding | GO ID | GO:0002237 | UniProtAcc | O95751 |
Top |
Malignant transformation analysis |
| Identification of the aberrant gene expression in precancerous and cancerous lesions by comparing the gene expression of stem-like cells in diseased tissues with normal stem cells |
| Entrez ID | Symbol | Replicates | Species | Organ | Tissue | Adj P-value | Log2FC | Malignancy |
| 23641 | LDOC1 | LZE2T | Human | Esophagus | ESCC | 1.12e-02 | 4.81e-01 | 0.082 |
| 23641 | LDOC1 | P1T-E | Human | Esophagus | ESCC | 1.07e-17 | 1.02e+00 | 0.0875 |
| 23641 | LDOC1 | P2T-E | Human | Esophagus | ESCC | 2.43e-38 | 7.15e-01 | 0.1177 |
| 23641 | LDOC1 | P5T-E | Human | Esophagus | ESCC | 1.26e-22 | 3.66e-01 | 0.1327 |
| 23641 | LDOC1 | P8T-E | Human | Esophagus | ESCC | 1.21e-06 | -9.08e-02 | 0.0889 |
| 23641 | LDOC1 | P10T-E | Human | Esophagus | ESCC | 3.74e-60 | 1.12e+00 | 0.116 |
| 23641 | LDOC1 | P11T-E | Human | Esophagus | ESCC | 1.06e-10 | 3.26e-01 | 0.1426 |
| 23641 | LDOC1 | P12T-E | Human | Esophagus | ESCC | 3.43e-36 | 8.31e-01 | 0.1122 |
| 23641 | LDOC1 | P15T-E | Human | Esophagus | ESCC | 4.76e-06 | -4.60e-02 | 0.1149 |
| 23641 | LDOC1 | P16T-E | Human | Esophagus | ESCC | 9.36e-22 | 3.56e-01 | 0.1153 |
| 23641 | LDOC1 | P21T-E | Human | Esophagus | ESCC | 9.97e-03 | 7.76e-02 | 0.1617 |
| 23641 | LDOC1 | P22T-E | Human | Esophagus | ESCC | 9.45e-99 | 1.74e+00 | 0.1236 |
| 23641 | LDOC1 | P23T-E | Human | Esophagus | ESCC | 1.33e-07 | 2.86e-01 | 0.108 |
| 23641 | LDOC1 | P24T-E | Human | Esophagus | ESCC | 8.12e-05 | 1.21e-01 | 0.1287 |
| 23641 | LDOC1 | P27T-E | Human | Esophagus | ESCC | 2.11e-08 | 1.95e-02 | 0.1055 |
| 23641 | LDOC1 | P30T-E | Human | Esophagus | ESCC | 1.17e-23 | 6.83e-01 | 0.137 |
| 23641 | LDOC1 | P32T-E | Human | Esophagus | ESCC | 1.04e-09 | 1.94e-02 | 0.1666 |
| 23641 | LDOC1 | P36T-E | Human | Esophagus | ESCC | 8.82e-22 | 7.87e-01 | 0.1187 |
| 23641 | LDOC1 | P39T-E | Human | Esophagus | ESCC | 1.18e-28 | 7.43e-01 | 0.0894 |
| 23641 | LDOC1 | P40T-E | Human | Esophagus | ESCC | 1.08e-03 | 1.72e-01 | 0.109 |
| Page: 1 2 3 4 |
| Tissue | Expression Dynamics | Abbreviation |
| Esophagus |  | ESCC: Esophageal squamous cell carcinoma |
| HGIN: High-grade intraepithelial neoplasias | ||
| LGIN: Low-grade intraepithelial neoplasias | ||
| Liver | 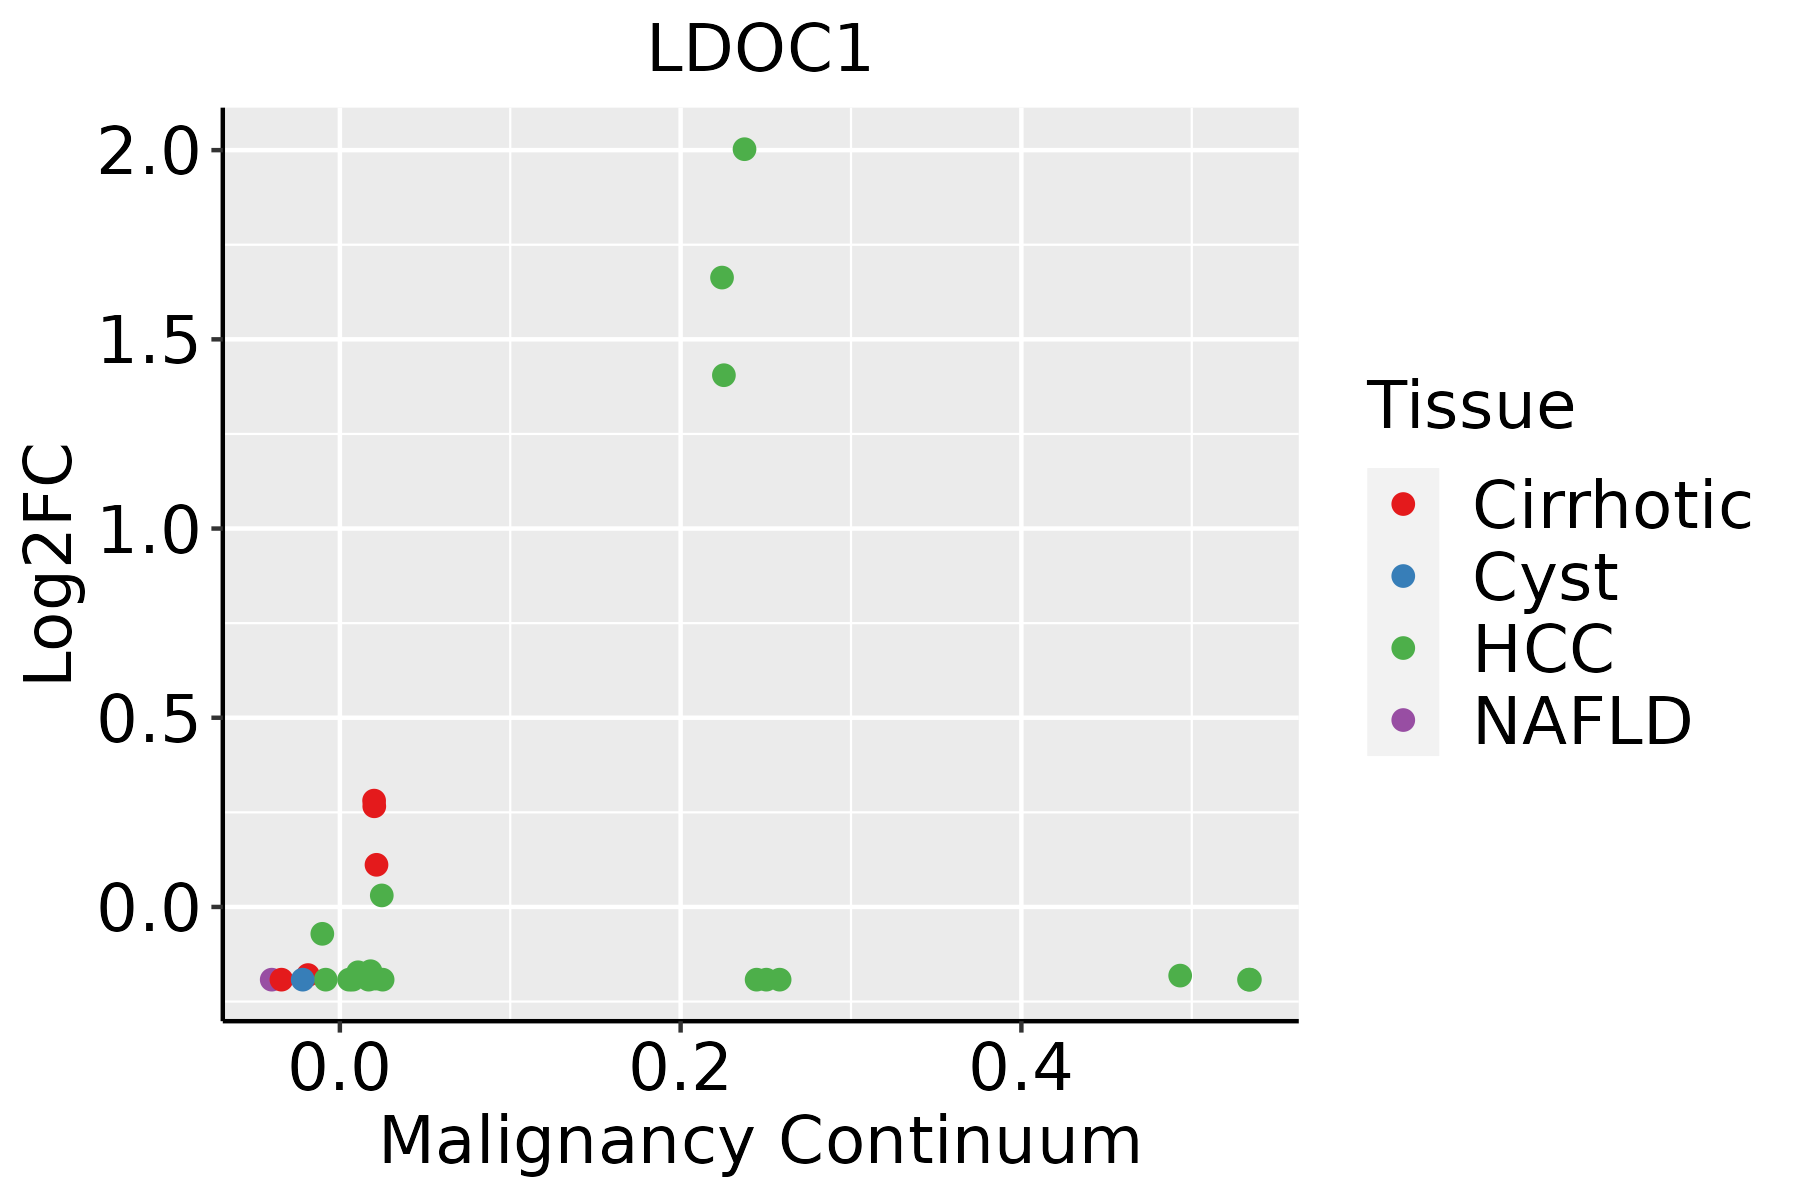 | HCC: Hepatocellular carcinoma |
| NAFLD: Non-alcoholic fatty liver disease | ||
| Oral Cavity | 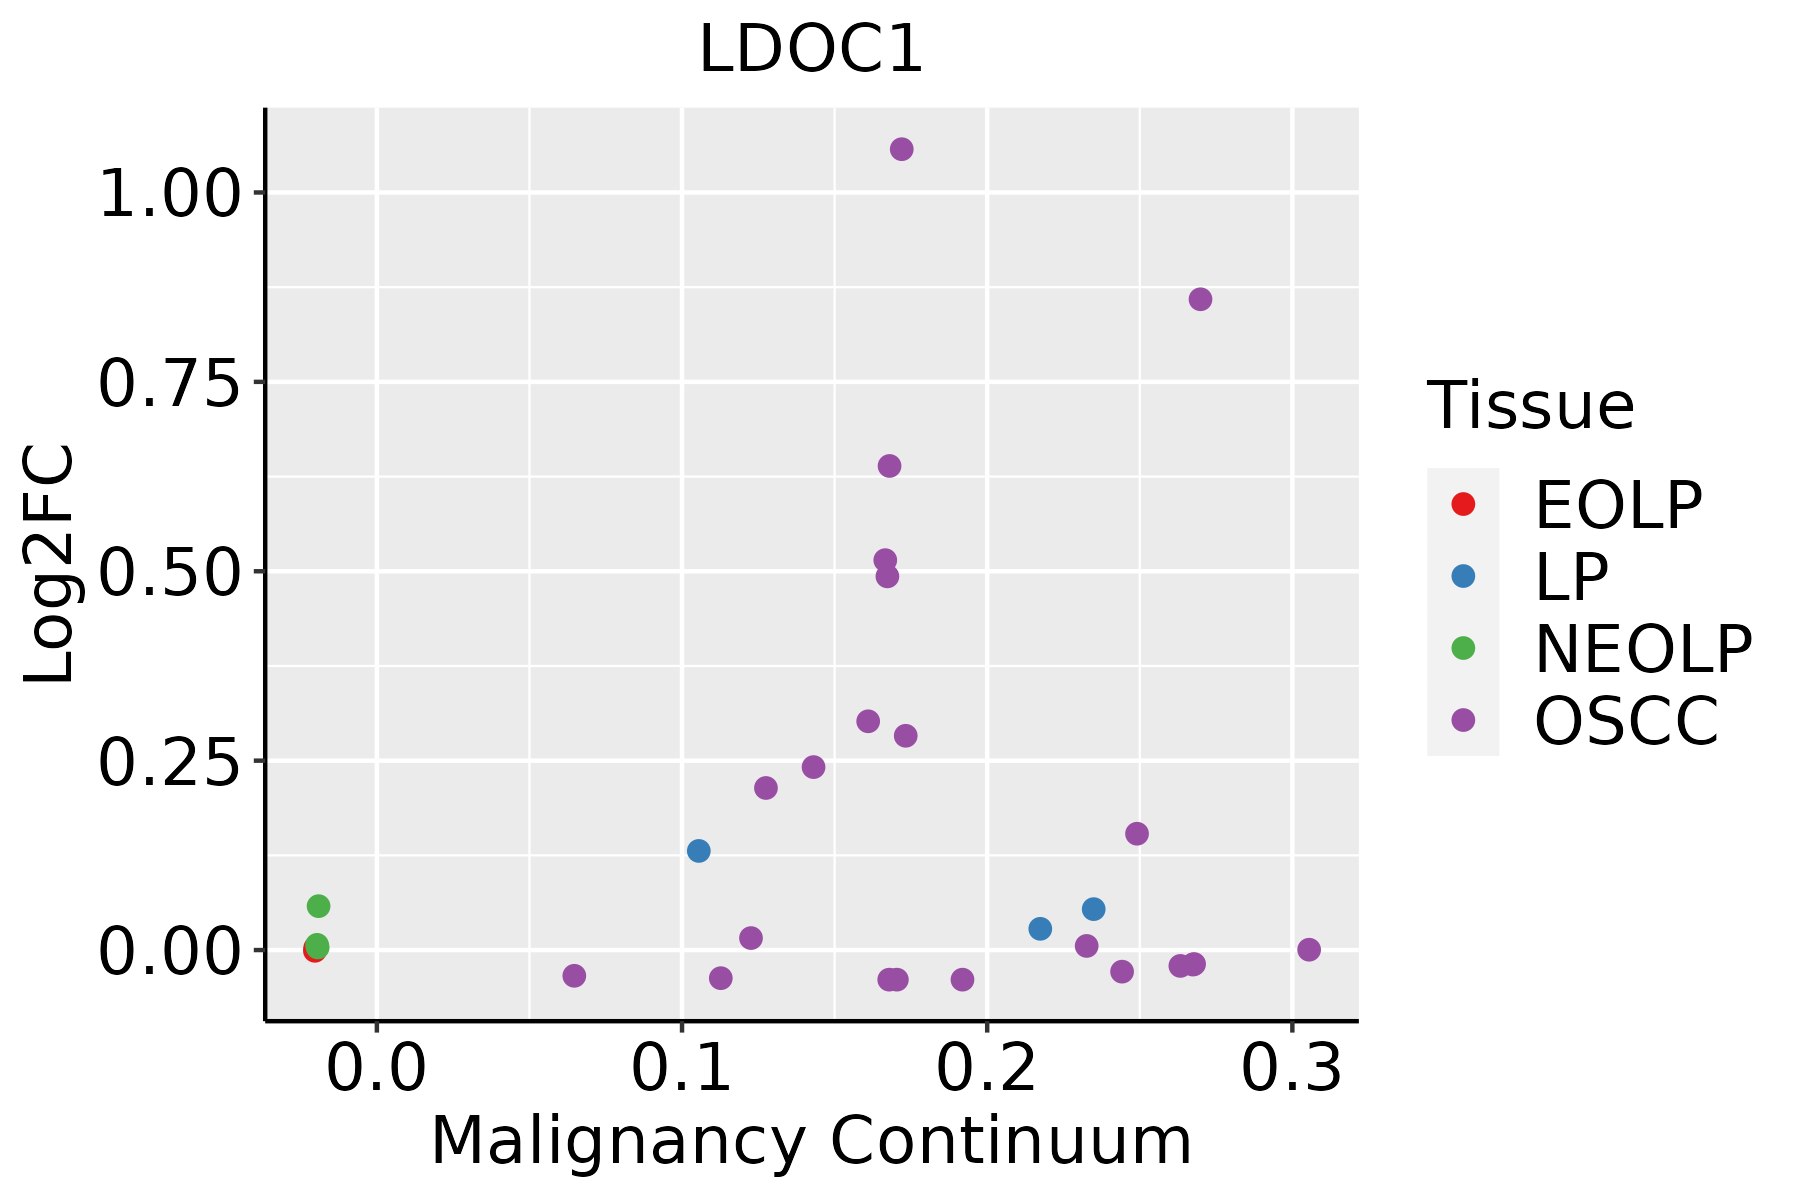 | EOLP: Erosive Oral lichen planus |
| LP: leukoplakia | ||
| NEOLP: Non-erosive oral lichen planus | ||
| OSCC: Oral squamous cell carcinoma | ||
| Thyroid |  | ATC: Anaplastic thyroid cancer |
| HT: Hashimoto's thyroiditis | ||
| PTC: Papillary thyroid cancer |
| ∗log2FC in expression of this searched gene in stem-like cells from each diseased tissue sample relative to stem-like cells in normal samples in each tissue plotted against the malignancy continuum. Samples are colored based on if they are from different disease stage. |
Top |
Malignant transformation related pathway analysis |
| Find out the enriched GO biological processes and KEGG pathways involved in transition from healthy to precancer to cancer |
| Tissue | Disease Stage | Enriched GO biological Processes |
| Colorectum | AD |  |
| Colorectum | SER |  |
| Colorectum | MSS |  |
| Colorectum | MSI-H |  |
| Colorectum | FAP |  |
| ∗Top 15 enriched GO BP terms are showed in the bar plot of each disease state in each tissue. Each row represents a significant GO biological process which is colored according to the -log10(p.adjust). |
| Page: 1 2 3 4 5 6 7 8 9 |
| GO ID | Tissue | Disease Stage | Description | Gene Ratio | Bg Ratio | pvalue | p.adjust | Count |
| GO:190165319 | Esophagus | ESCC | cellular response to peptide | 208/8552 | 359/18723 | 1.68e-06 | 2.01e-05 | 208 |
| GO:003249619 | Esophagus | ESCC | response to lipopolysaccharide | 191/8552 | 343/18723 | 1.11e-04 | 7.73e-04 | 191 |
| GO:000223719 | Esophagus | ESCC | response to molecule of bacterial origin | 194/8552 | 363/18723 | 1.64e-03 | 7.61e-03 | 194 |
| GO:007122215 | Esophagus | ESCC | cellular response to lipopolysaccharide | 113/8552 | 209/18723 | 8.79e-03 | 3.10e-02 | 113 |
| GO:007121617 | Esophagus | ESCC | cellular response to biotic stimulus | 131/8552 | 246/18723 | 9.85e-03 | 3.39e-02 | 131 |
| GO:190165311 | Liver | Cirrhotic | cellular response to peptide | 129/4634 | 359/18723 | 1.23e-06 | 2.49e-05 | 129 |
| GO:00324966 | Liver | Cirrhotic | response to lipopolysaccharide | 111/4634 | 343/18723 | 8.15e-04 | 5.95e-03 | 111 |
| GO:00022376 | Liver | Cirrhotic | response to molecule of bacterial origin | 113/4634 | 363/18723 | 3.23e-03 | 1.81e-02 | 113 |
| GO:190165321 | Liver | HCC | cellular response to peptide | 211/7958 | 359/18723 | 2.86e-10 | 9.63e-09 | 211 |
| GO:003249611 | Liver | HCC | response to lipopolysaccharide | 174/7958 | 343/18723 | 1.19e-03 | 6.62e-03 | 174 |
| GO:00712166 | Liver | HCC | cellular response to biotic stimulus | 128/7958 | 246/18723 | 1.53e-03 | 8.10e-03 | 128 |
| GO:00712226 | Liver | HCC | cellular response to lipopolysaccharide | 110/7958 | 209/18723 | 1.92e-03 | 9.77e-03 | 110 |
| GO:000223711 | Liver | HCC | response to molecule of bacterial origin | 181/7958 | 363/18723 | 2.58e-03 | 1.24e-02 | 181 |
| GO:00712196 | Liver | HCC | cellular response to molecule of bacterial origin | 113/7958 | 221/18723 | 5.73e-03 | 2.38e-02 | 113 |
| GO:190165316 | Oral cavity | OSCC | cellular response to peptide | 194/7305 | 359/18723 | 4.31e-09 | 9.57e-08 | 194 |
| GO:003249617 | Oral cavity | OSCC | response to lipopolysaccharide | 178/7305 | 343/18723 | 7.27e-07 | 1.03e-05 | 178 |
| GO:007121615 | Oral cavity | OSCC | cellular response to biotic stimulus | 129/7305 | 246/18723 | 1.20e-05 | 1.23e-04 | 129 |
| GO:000223717 | Oral cavity | OSCC | response to molecule of bacterial origin | 181/7305 | 363/18723 | 1.48e-05 | 1.49e-04 | 181 |
| GO:007122210 | Oral cavity | OSCC | cellular response to lipopolysaccharide | 110/7305 | 209/18723 | 4.15e-05 | 3.60e-04 | 110 |
| GO:007121910 | Oral cavity | OSCC | cellular response to molecule of bacterial origin | 112/7305 | 221/18723 | 2.64e-04 | 1.69e-03 | 112 |
| Page: 1 2 |
| Pathway ID | Tissue | Disease Stage | Description | Gene Ratio | Bg Ratio | pvalue | p.adjust | qvalue | Count |
| Page: 1 |
Top |
Cell-cell communication analysis |
| Identification of potential cell-cell interactions between two cell types and their ligand-receptor pairs for different disease states |
| Ligand | Receptor | LRpair | Pathway | Tissue | Disease Stage |
| Page: 1 |
Top |
Single-cell gene regulatory network inference analysis |
| Find out the significant the regulons (TFs) and the target genes of each regulon across cell types for different disease states |
| TF | Cell Type | Tissue | Disease Stage | Target Gene | RSS | Regulon Activity |
| ∗The dot plots of a searched regulon are shown for all cell subpopulations in each disease state of each tissue based on the regulon specific score inferred using pySCENIC and by calculating the average expression. |
| Page: 1 |
Top |
Somatic mutation of malignant transformation related genes |
| Annotation of somatic variants for genes involved in malignant transformation |
| Hugo Symbol | Variant Class | Variant Classification | dbSNP RS | HGVSc | HGVSp | HGVSp Short | SWISSPROT | BIOTYPE | SIFT | PolyPhen | Tumor Sample Barcode | Tissue | Histology | Sex | Age | Stage | Therapy Types | Drugs | Outcome |
| LDOC1 | SNV | Missense_Mutation | novel | c.23N>C | p.Leu8Pro | p.L8P | O95751 | protein_coding | deleterious(0.01) | probably_damaging(0.984) | TCGA-A8-A09E-01 | Breast | breast invasive carcinoma | Female | >=65 | III/IV | Hormone Therapy | anastrozole | SD |
| LDOC1 | SNV | Missense_Mutation | c.330G>A | p.Met110Ile | p.M110I | O95751 | protein_coding | tolerated(0.08) | benign(0.001) | TCGA-E9-A1R0-01 | Breast | breast invasive carcinoma | Female | <65 | I/II | Chemotherapy | cyclophosphamide | SD | |
| LDOC1 | SNV | Missense_Mutation | novel | c.421N>A | p.Glu141Lys | p.E141K | O95751 | protein_coding | deleterious_low_confidence(0) | benign(0.006) | TCGA-GM-A2D9-01 | Breast | breast invasive carcinoma | Female | >=65 | I/II | Hormone Therapy | arimidex | SD |
| LDOC1 | insertion | In_Frame_Ins | novel | c.24_25insGTCCCCTTACCTACCCGCGCCCGT | p.Leu8_Leu9insValProLeuProThrArgAlaArg | p.L8_L9insVPLPTRAR | O95751 | protein_coding | TCGA-A8-A09E-01 | Breast | breast invasive carcinoma | Female | >=65 | III/IV | Hormone Therapy | anastrozole | SD | ||
| LDOC1 | SNV | Missense_Mutation | novel | c.289N>G | p.Thr97Ala | p.T97A | O95751 | protein_coding | deleterious(0.03) | benign(0.269) | TCGA-2W-A8YY-01 | Cervix | cervical & endocervical cancer | Female | <65 | I/II | Chemotherapy | cisplatin | CR |
| LDOC1 | SNV | Missense_Mutation | c.37N>A | p.Leu13Met | p.L13M | O95751 | protein_coding | deleterious(0.04) | probably_damaging(0.914) | TCGA-A6-2679-01 | Colorectum | colon adenocarcinoma | Female | >=65 | I/II | Unknown | Unknown | SD | |
| LDOC1 | SNV | Missense_Mutation | c.349N>A | p.Asp117Asn | p.D117N | O95751 | protein_coding | tolerated(0.77) | benign(0.172) | TCGA-A6-2684-01 | Colorectum | colon adenocarcinoma | Female | >=65 | I/II | Unknown | Unknown | PD | |
| LDOC1 | SNV | Missense_Mutation | c.253N>A | p.Asp85Asn | p.D85N | O95751 | protein_coding | deleterious(0) | probably_damaging(0.999) | TCGA-AA-A00N-01 | Colorectum | colon adenocarcinoma | Male | >=65 | I/II | Unknown | Unknown | PD | |
| LDOC1 | SNV | Missense_Mutation | c.253N>A | p.Asp85Asn | p.D85N | O95751 | protein_coding | deleterious(0) | probably_damaging(0.999) | TCGA-CA-6718-01 | Colorectum | colon adenocarcinoma | Male | <65 | I/II | Unknown | Unknown | PD | |
| LDOC1 | SNV | Missense_Mutation | c.52N>A | p.Ala18Thr | p.A18T | O95751 | protein_coding | deleterious(0.01) | benign(0.01) | TCGA-CK-6746-01 | Colorectum | colon adenocarcinoma | Female | >=65 | I/II | Unknown | Unknown | SD |
| Page: 1 2 3 4 5 |
Top |
Related drugs of malignant transformation related genes |
| Identification of chemicals and drugs interact with genes involved in malignant transfromation |
| (DGIdb 4.0) |
| Entrez ID | Symbol | Category | Interaction Types | Drug Claim Name | Drug Name | PMIDs |
| Page: 1 |

Copyright 2023-Present -The University of Texas Health Science Center at Houston |