
|
|||||
|
 | |
| |
| |
| |
| |
| |
|
Gene: LDLRAP1 |
Gene summary for LDLRAP1 |
| Gene information | Species | Human | Gene symbol | LDLRAP1 | Gene ID | 26119 |
| Gene name | low density lipoprotein receptor adaptor protein 1 | |
| Gene Alias | ARH | |
| Cytomap | 1p36.11 | |
| Gene Type | protein-coding | GO ID | GO:0006066 | UniProtAcc | B3KR97 |
Top |
Malignant transformation analysis |
| Identification of the aberrant gene expression in precancerous and cancerous lesions by comparing the gene expression of stem-like cells in diseased tissues with normal stem cells |
| Entrez ID | Symbol | Replicates | Species | Organ | Tissue | Adj P-value | Log2FC | Malignancy |
| 26119 | LDLRAP1 | HTA11_3410_2000001011 | Human | Colorectum | AD | 9.37e-05 | 1.29e-01 | 0.0155 |
| 26119 | LDLRAP1 | HTA11_2487_2000001011 | Human | Colorectum | SER | 1.44e-02 | 3.53e-01 | -0.1808 |
| 26119 | LDLRAP1 | HTA11_1938_2000001011 | Human | Colorectum | AD | 3.97e-07 | 5.85e-01 | -0.0811 |
| 26119 | LDLRAP1 | HTA11_347_2000001011 | Human | Colorectum | AD | 6.63e-13 | 3.44e-01 | -0.1954 |
| 26119 | LDLRAP1 | HTA11_83_2000001011 | Human | Colorectum | SER | 1.54e-05 | 4.22e-01 | -0.1526 |
| 26119 | LDLRAP1 | HTA11_696_2000001011 | Human | Colorectum | AD | 8.03e-09 | 4.47e-01 | -0.1464 |
| 26119 | LDLRAP1 | HTA11_866_2000001011 | Human | Colorectum | AD | 3.92e-02 | 1.77e-01 | -0.1001 |
| 26119 | LDLRAP1 | HTA11_1391_2000001011 | Human | Colorectum | AD | 1.92e-09 | 4.89e-01 | -0.059 |
| 26119 | LDLRAP1 | HTA11_546_2000001011 | Human | Colorectum | AD | 3.77e-04 | 3.49e-01 | -0.0842 |
| 26119 | LDLRAP1 | HTA11_866_3004761011 | Human | Colorectum | AD | 2.08e-04 | 1.41e-01 | 0.096 |
| 26119 | LDLRAP1 | HTA11_7663_2000001011 | Human | Colorectum | SER | 4.22e-02 | 3.90e-01 | 0.0131 |
| 26119 | LDLRAP1 | HTA11_7696_3000711011 | Human | Colorectum | AD | 1.23e-06 | 3.55e-01 | 0.0674 |
| 26119 | LDLRAP1 | HTA11_99999971662_82457 | Human | Colorectum | MSS | 7.81e-03 | 2.71e-01 | 0.3859 |
| 26119 | LDLRAP1 | LZE5T | Human | Esophagus | ESCC | 7.53e-04 | 3.89e-01 | 0.0514 |
| 26119 | LDLRAP1 | LZE7T | Human | Esophagus | ESCC | 1.40e-02 | 2.05e-01 | 0.0667 |
| 26119 | LDLRAP1 | LZE8T | Human | Esophagus | ESCC | 2.51e-04 | 1.41e-01 | 0.067 |
| 26119 | LDLRAP1 | LZE20T | Human | Esophagus | ESCC | 1.63e-07 | 1.60e-01 | 0.0662 |
| 26119 | LDLRAP1 | LZE22T | Human | Esophagus | ESCC | 4.58e-02 | 1.66e-01 | 0.068 |
| 26119 | LDLRAP1 | LZE24T | Human | Esophagus | ESCC | 7.88e-27 | 5.66e-01 | 0.0596 |
| 26119 | LDLRAP1 | P1T-E | Human | Esophagus | ESCC | 2.18e-05 | 2.69e-01 | 0.0875 |
| Page: 1 2 3 4 5 |
| Tissue | Expression Dynamics | Abbreviation |
| Colorectum (GSE201348) |  | FAP: Familial adenomatous polyposis |
| CRC: Colorectal cancer | ||
| Colorectum (HTA11) |  | AD: Adenomas |
| SER: Sessile serrated lesions | ||
| MSI-H: Microsatellite-high colorectal cancer | ||
| MSS: Microsatellite stable colorectal cancer | ||
| Esophagus | 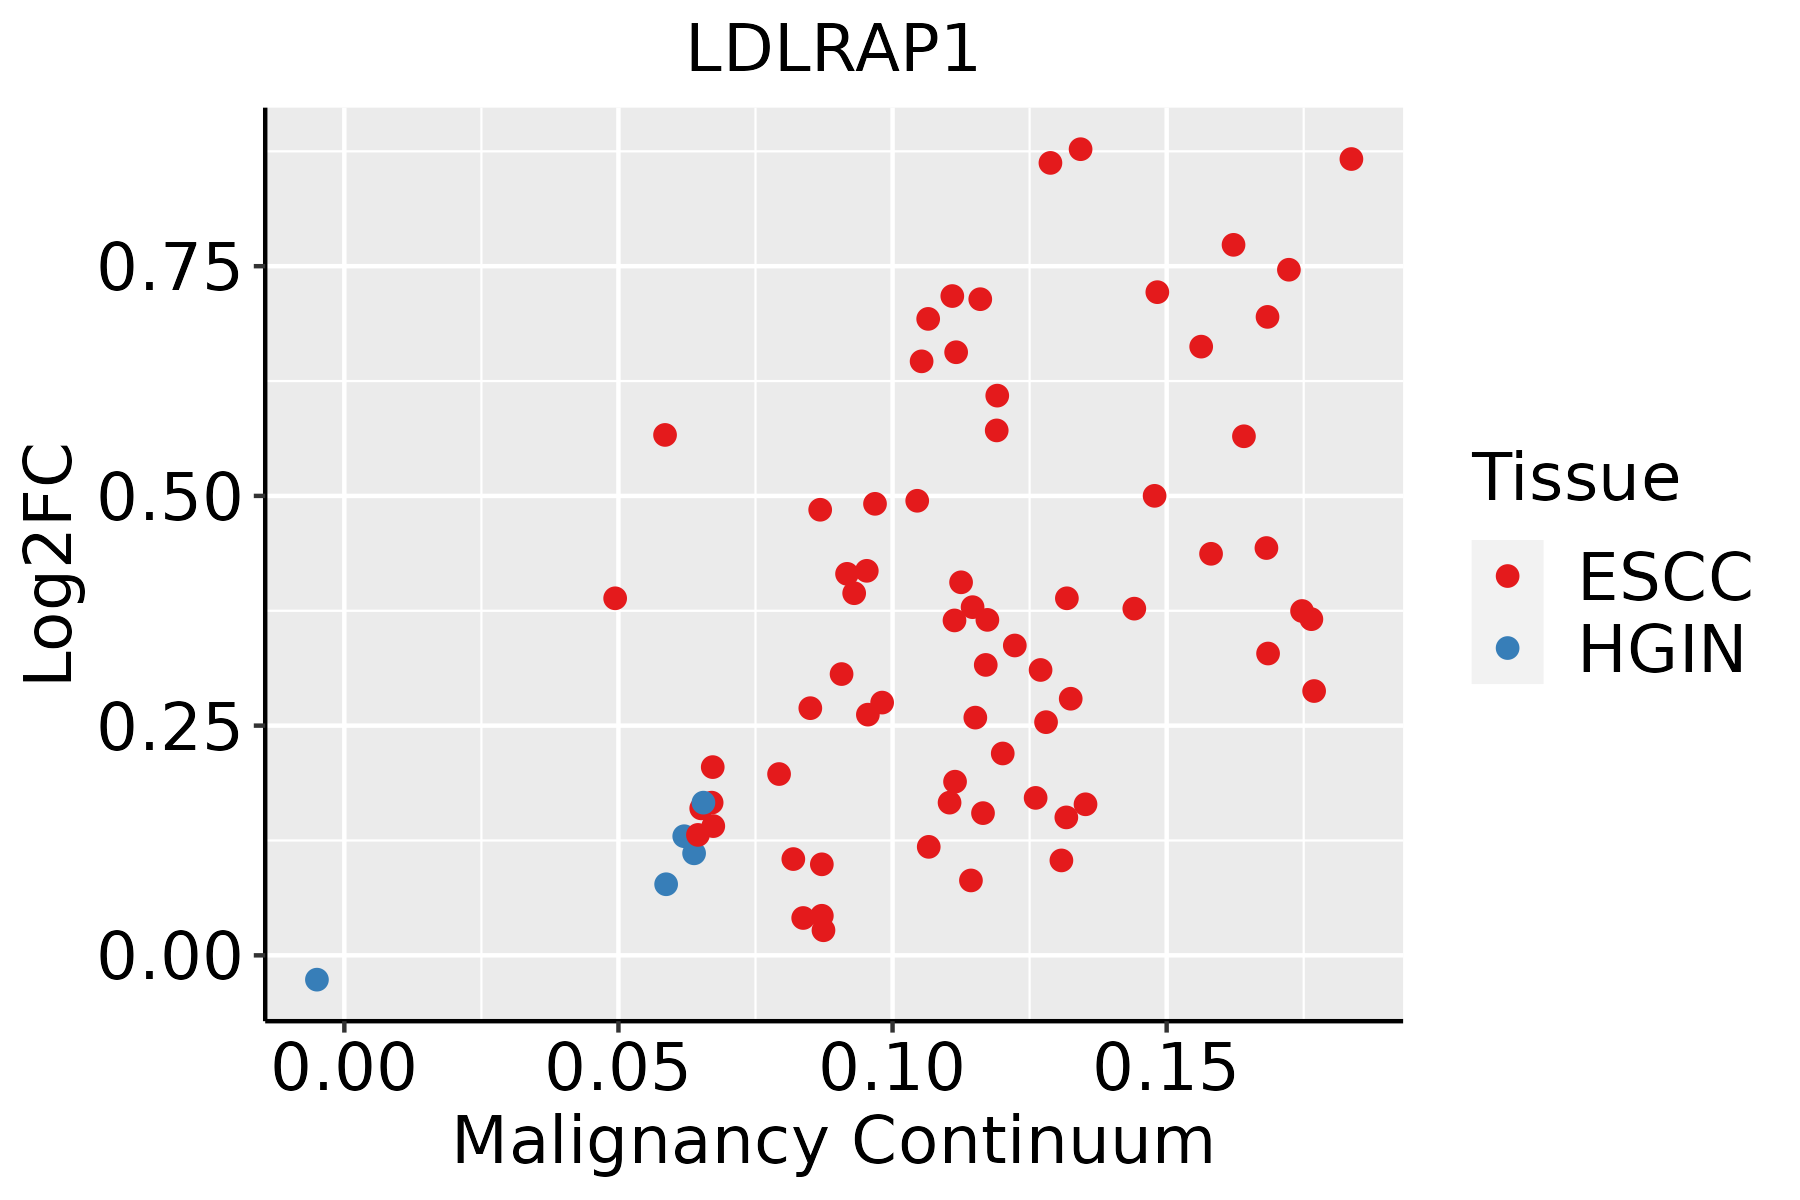 | ESCC: Esophageal squamous cell carcinoma |
| HGIN: High-grade intraepithelial neoplasias | ||
| LGIN: Low-grade intraepithelial neoplasias | ||
| Oral Cavity |  | EOLP: Erosive Oral lichen planus |
| LP: leukoplakia | ||
| NEOLP: Non-erosive oral lichen planus | ||
| OSCC: Oral squamous cell carcinoma | ||
| Skin | 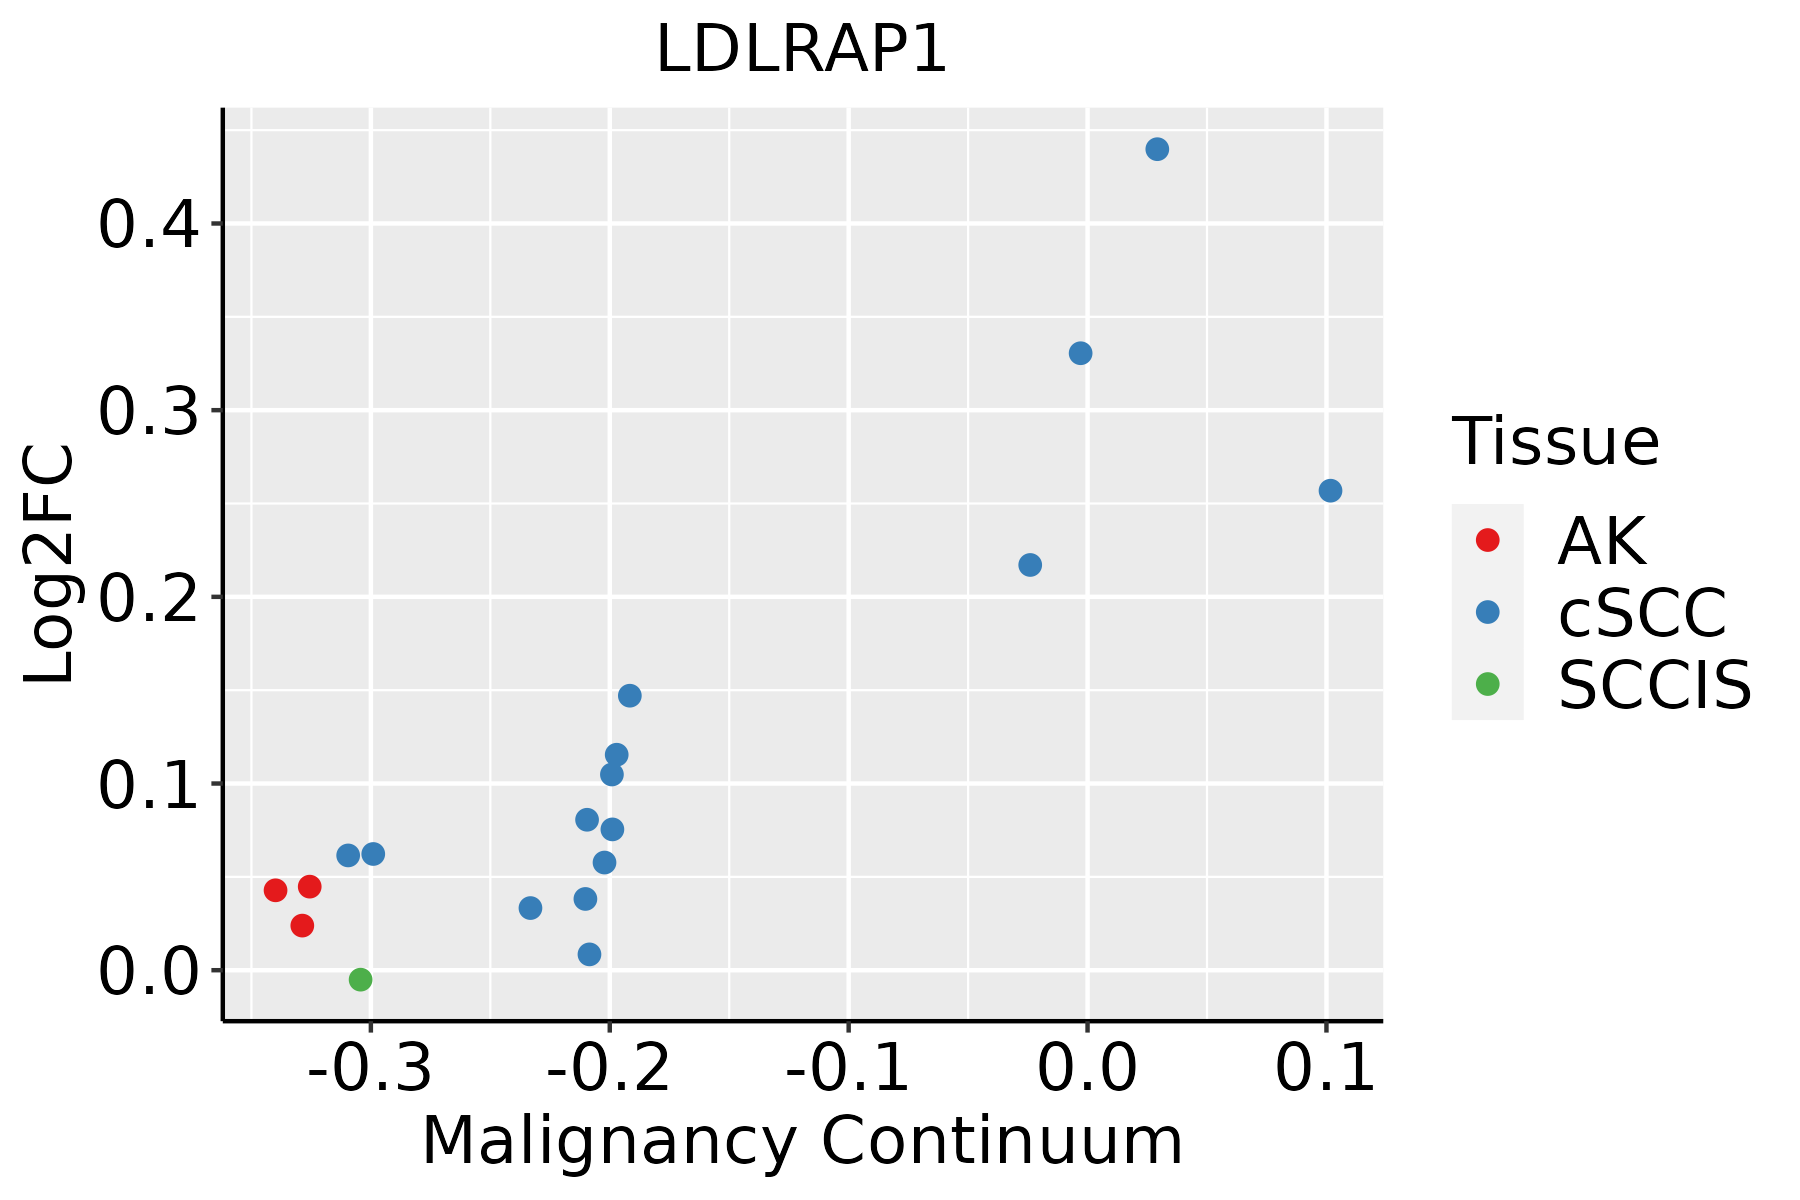 | AK: Actinic keratosis |
| cSCC: Cutaneous squamous cell carcinoma | ||
| SCCIS:squamous cell carcinoma in situ |
| ∗log2FC in expression of this searched gene in stem-like cells from each diseased tissue sample relative to stem-like cells in normal samples in each tissue plotted against the malignancy continuum. Samples are colored based on if they are from different disease stage. |
Top |
Malignant transformation related pathway analysis |
| Find out the enriched GO biological processes and KEGG pathways involved in transition from healthy to precancer to cancer |
| Tissue | Disease Stage | Enriched GO biological Processes |
| Colorectum | AD |  |
| Colorectum | SER |  |
| Colorectum | MSS |  |
| Colorectum | MSI-H |  |
| Colorectum | FAP |  |
| ∗Top 15 enriched GO BP terms are showed in the bar plot of each disease state in each tissue. Each row represents a significant GO biological process which is colored according to the -log10(p.adjust). |
| Page: 1 2 3 4 5 6 7 8 9 |
| GO ID | Tissue | Disease Stage | Description | Gene Ratio | Bg Ratio | pvalue | p.adjust | Count |
| GO:0072659 | Colorectum | AD | protein localization to plasma membrane | 122/3918 | 284/18723 | 2.86e-17 | 1.49e-14 | 122 |
| GO:1990778 | Colorectum | AD | protein localization to cell periphery | 129/3918 | 333/18723 | 5.51e-14 | 1.15e-11 | 129 |
| GO:1905475 | Colorectum | AD | regulation of protein localization to membrane | 73/3918 | 175/18723 | 3.37e-10 | 2.93e-08 | 73 |
| GO:0051098 | Colorectum | AD | regulation of binding | 126/3918 | 363/18723 | 6.01e-10 | 4.88e-08 | 126 |
| GO:1903076 | Colorectum | AD | regulation of protein localization to plasma membrane | 48/3918 | 104/18723 | 7.17e-09 | 4.36e-07 | 48 |
| GO:1904375 | Colorectum | AD | regulation of protein localization to cell periphery | 54/3918 | 125/18723 | 1.52e-08 | 9.00e-07 | 54 |
| GO:0032388 | Colorectum | AD | positive regulation of intracellular transport | 74/3918 | 202/18723 | 1.83e-07 | 7.80e-06 | 74 |
| GO:0032386 | Colorectum | AD | regulation of intracellular transport | 109/3918 | 337/18723 | 5.33e-07 | 1.95e-05 | 109 |
| GO:0043112 | Colorectum | AD | receptor metabolic process | 62/3918 | 166/18723 | 8.18e-07 | 2.85e-05 | 62 |
| GO:0043393 | Colorectum | AD | regulation of protein binding | 68/3918 | 196/18723 | 5.17e-06 | 1.34e-04 | 68 |
| GO:0006066 | Colorectum | AD | alcohol metabolic process | 106/3918 | 353/18723 | 3.02e-05 | 5.57e-04 | 106 |
| GO:0006898 | Colorectum | AD | receptor-mediated endocytosis | 76/3918 | 244/18723 | 1.07e-04 | 1.59e-03 | 76 |
| GO:0030100 | Colorectum | AD | regulation of endocytosis | 67/3918 | 211/18723 | 1.42e-04 | 2.01e-03 | 67 |
| GO:0045807 | Colorectum | AD | positive regulation of endocytosis | 35/3918 | 100/18723 | 7.78e-04 | 7.78e-03 | 35 |
| GO:0062012 | Colorectum | AD | regulation of small molecule metabolic process | 93/3918 | 334/18723 | 1.46e-03 | 1.24e-02 | 93 |
| GO:0010876 | Colorectum | AD | lipid localization | 120/3918 | 448/18723 | 1.59e-03 | 1.33e-02 | 120 |
| GO:0006869 | Colorectum | AD | lipid transport | 108/3918 | 398/18723 | 1.67e-03 | 1.39e-02 | 108 |
| GO:0048260 | Colorectum | AD | positive regulation of receptor-mediated endocytosis | 20/3918 | 52/18723 | 2.87e-03 | 2.14e-02 | 20 |
| GO:0048259 | Colorectum | AD | regulation of receptor-mediated endocytosis | 35/3918 | 110/18723 | 4.85e-03 | 3.27e-02 | 35 |
| GO:0031623 | Colorectum | AD | receptor internalization | 35/3918 | 113/18723 | 7.72e-03 | 4.66e-02 | 35 |
| Page: 1 2 3 4 5 6 7 8 |
| Pathway ID | Tissue | Disease Stage | Description | Gene Ratio | Bg Ratio | pvalue | p.adjust | qvalue | Count |
| hsa04144 | Colorectum | AD | Endocytosis | 111/2092 | 251/8465 | 5.95e-12 | 1.42e-10 | 9.08e-11 | 111 |
| hsa041441 | Colorectum | AD | Endocytosis | 111/2092 | 251/8465 | 5.95e-12 | 1.42e-10 | 9.08e-11 | 111 |
| hsa041442 | Colorectum | SER | Endocytosis | 81/1580 | 251/8465 | 1.14e-07 | 2.36e-06 | 1.71e-06 | 81 |
| hsa041443 | Colorectum | SER | Endocytosis | 81/1580 | 251/8465 | 1.14e-07 | 2.36e-06 | 1.71e-06 | 81 |
| hsa041444 | Colorectum | MSS | Endocytosis | 102/1875 | 251/8465 | 1.85e-11 | 4.43e-10 | 2.71e-10 | 102 |
| hsa041445 | Colorectum | MSS | Endocytosis | 102/1875 | 251/8465 | 1.85e-11 | 4.43e-10 | 2.71e-10 | 102 |
| hsa04144210 | Esophagus | ESCC | Endocytosis | 186/4205 | 251/8465 | 9.74e-16 | 4.66e-14 | 2.39e-14 | 186 |
| hsa0414437 | Esophagus | ESCC | Endocytosis | 186/4205 | 251/8465 | 9.74e-16 | 4.66e-14 | 2.39e-14 | 186 |
| hsa0414427 | Oral cavity | OSCC | Endocytosis | 174/3704 | 251/8465 | 9.42e-17 | 4.51e-15 | 2.29e-15 | 174 |
| hsa04144112 | Oral cavity | OSCC | Endocytosis | 174/3704 | 251/8465 | 9.42e-17 | 4.51e-15 | 2.29e-15 | 174 |
| hsa0414428 | Oral cavity | LP | Endocytosis | 121/2418 | 251/8465 | 1.89e-11 | 3.70e-10 | 2.38e-10 | 121 |
| hsa0414436 | Oral cavity | LP | Endocytosis | 121/2418 | 251/8465 | 1.89e-11 | 3.70e-10 | 2.38e-10 | 121 |
| Page: 1 |
Top |
Cell-cell communication analysis |
| Identification of potential cell-cell interactions between two cell types and their ligand-receptor pairs for different disease states |
| Ligand | Receptor | LRpair | Pathway | Tissue | Disease Stage |
| Page: 1 |
Top |
Single-cell gene regulatory network inference analysis |
| Find out the significant the regulons (TFs) and the target genes of each regulon across cell types for different disease states |
| TF | Cell Type | Tissue | Disease Stage | Target Gene | RSS | Regulon Activity |
| ∗The dot plots of a searched regulon are shown for all cell subpopulations in each disease state of each tissue based on the regulon specific score inferred using pySCENIC and by calculating the average expression. |
| Page: 1 |
Top |
Somatic mutation of malignant transformation related genes |
| Annotation of somatic variants for genes involved in malignant transformation |
| Hugo Symbol | Variant Class | Variant Classification | dbSNP RS | HGVSc | HGVSp | HGVSp Short | SWISSPROT | BIOTYPE | SIFT | PolyPhen | Tumor Sample Barcode | Tissue | Histology | Sex | Age | Stage | Therapy Types | Drugs | Outcome |
| LDLRAP1 | SNV | Missense_Mutation | rs867337699 | c.200C>T | p.Ser67Leu | p.S67L | Q5SW96 | protein_coding | deleterious(0) | possibly_damaging(0.642) | TCGA-AN-A046-01 | Breast | breast invasive carcinoma | Female | >=65 | I/II | Unknown | Unknown | SD |
| LDLRAP1 | SNV | Missense_Mutation | novel | c.757G>A | p.Asp253Asn | p.D253N | Q5SW96 | protein_coding | deleterious(0) | probably_damaging(0.992) | TCGA-EA-A3HU-01 | Cervix | cervical & endocervical cancer | Female | <65 | I/II | Unknown | Unknown | SD |
| LDLRAP1 | SNV | Missense_Mutation | novel | c.101N>G | p.Asn34Ser | p.N34S | Q5SW96 | protein_coding | tolerated(0.06) | possibly_damaging(0.527) | TCGA-AZ-6598-01 | Colorectum | colon adenocarcinoma | Female | >=65 | I/II | Unknown | Unknown | SD |
| LDLRAP1 | SNV | Missense_Mutation | rs529005321 | c.397G>A | p.Ala133Thr | p.A133T | Q5SW96 | protein_coding | deleterious(0.05) | benign(0.299) | TCGA-CK-5913-01 | Colorectum | colon adenocarcinoma | Female | <65 | I/II | Unknown | Unknown | SD |
| LDLRAP1 | SNV | Missense_Mutation | c.775N>C | p.Phe259Leu | p.F259L | Q5SW96 | protein_coding | deleterious(0) | probably_damaging(0.998) | TCGA-G4-6588-01 | Colorectum | colon adenocarcinoma | Female | <65 | I/II | Unknown | Unknown | SD | |
| LDLRAP1 | SNV | Missense_Mutation | rs752849346 | c.167N>T | p.Thr56Met | p.T56M | Q5SW96 | protein_coding | deleterious(0.04) | probably_damaging(0.999) | TCGA-QG-A5Z2-01 | Colorectum | colon adenocarcinoma | Male | <65 | I/II | Unknown | Unknown | SD |
| LDLRAP1 | SNV | Missense_Mutation | novel | c.513T>G | p.Phe171Leu | p.F171L | Q5SW96 | protein_coding | tolerated(0.99) | benign(0.001) | TCGA-AG-A002-01 | Colorectum | rectum adenocarcinoma | Male | <65 | I/II | Unknown | Unknown | SD |
| LDLRAP1 | SNV | Missense_Mutation | novel | c.438C>A | p.Phe146Leu | p.F146L | Q5SW96 | protein_coding | deleterious(0) | possibly_damaging(0.895) | TCGA-A5-A1OF-01 | Endometrium | uterine corpus endometrioid carcinoma | Female | <65 | I/II | Unknown | Unknown | SD |
| LDLRAP1 | SNV | Missense_Mutation | novel | c.878N>G | p.Asp293Gly | p.D293G | Q5SW96 | protein_coding | deleterious_low_confidence(0.03) | benign(0.171) | TCGA-AJ-A3EL-01 | Endometrium | uterine corpus endometrioid carcinoma | Female | <65 | I/II | Unknown | Unknown | SD |
| LDLRAP1 | SNV | Missense_Mutation | novel | c.574N>A | p.Val192Ile | p.V192I | Q5SW96 | protein_coding | tolerated(0.22) | benign(0) | TCGA-AJ-A3OK-01 | Endometrium | uterine corpus endometrioid carcinoma | Female | >=65 | I/II | Chemotherapy | carboplatin | CR |
| Page: 1 2 3 |
Top |
Related drugs of malignant transformation related genes |
| Identification of chemicals and drugs interact with genes involved in malignant transfromation |
| (DGIdb 4.0) |
| Entrez ID | Symbol | Category | Interaction Types | Drug Claim Name | Drug Name | PMIDs |
| Page: 1 |

Copyright 2023-Present -The University of Texas Health Science Center at Houston |