| Tissue | Expression Dynamics | Abbreviation |
| Cervix | 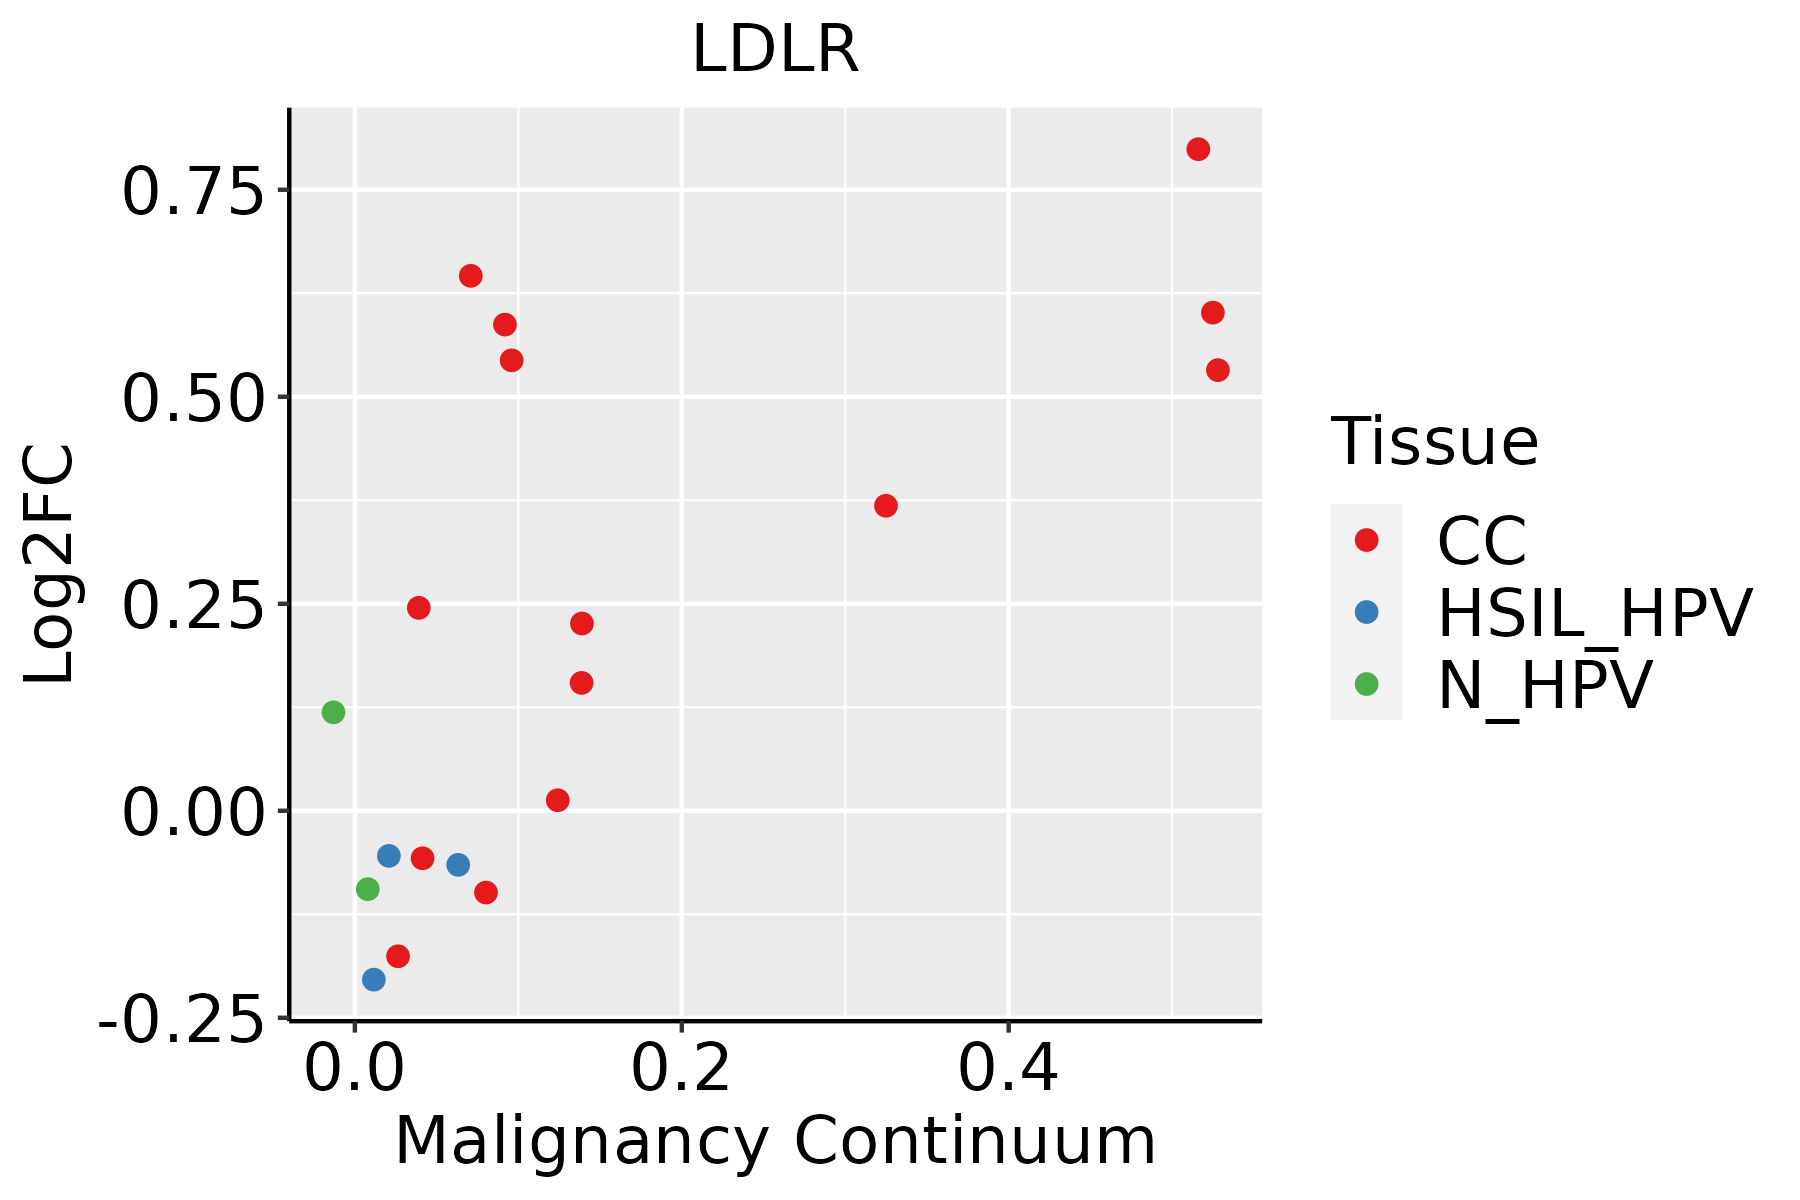 | CC: Cervix cancer |
| HSIL_HPV: HPV-infected high-grade squamous intraepithelial lesions |
| N_HPV: HPV-infected normal cervix |
| Colorectum (GSE201348) |  | FAP: Familial adenomatous polyposis |
| CRC: Colorectal cancer |
| Colorectum (HTA11) |  | AD: Adenomas |
| SER: Sessile serrated lesions |
| MSI-H: Microsatellite-high colorectal cancer |
| MSS: Microsatellite stable colorectal cancer |
| Endometrium | 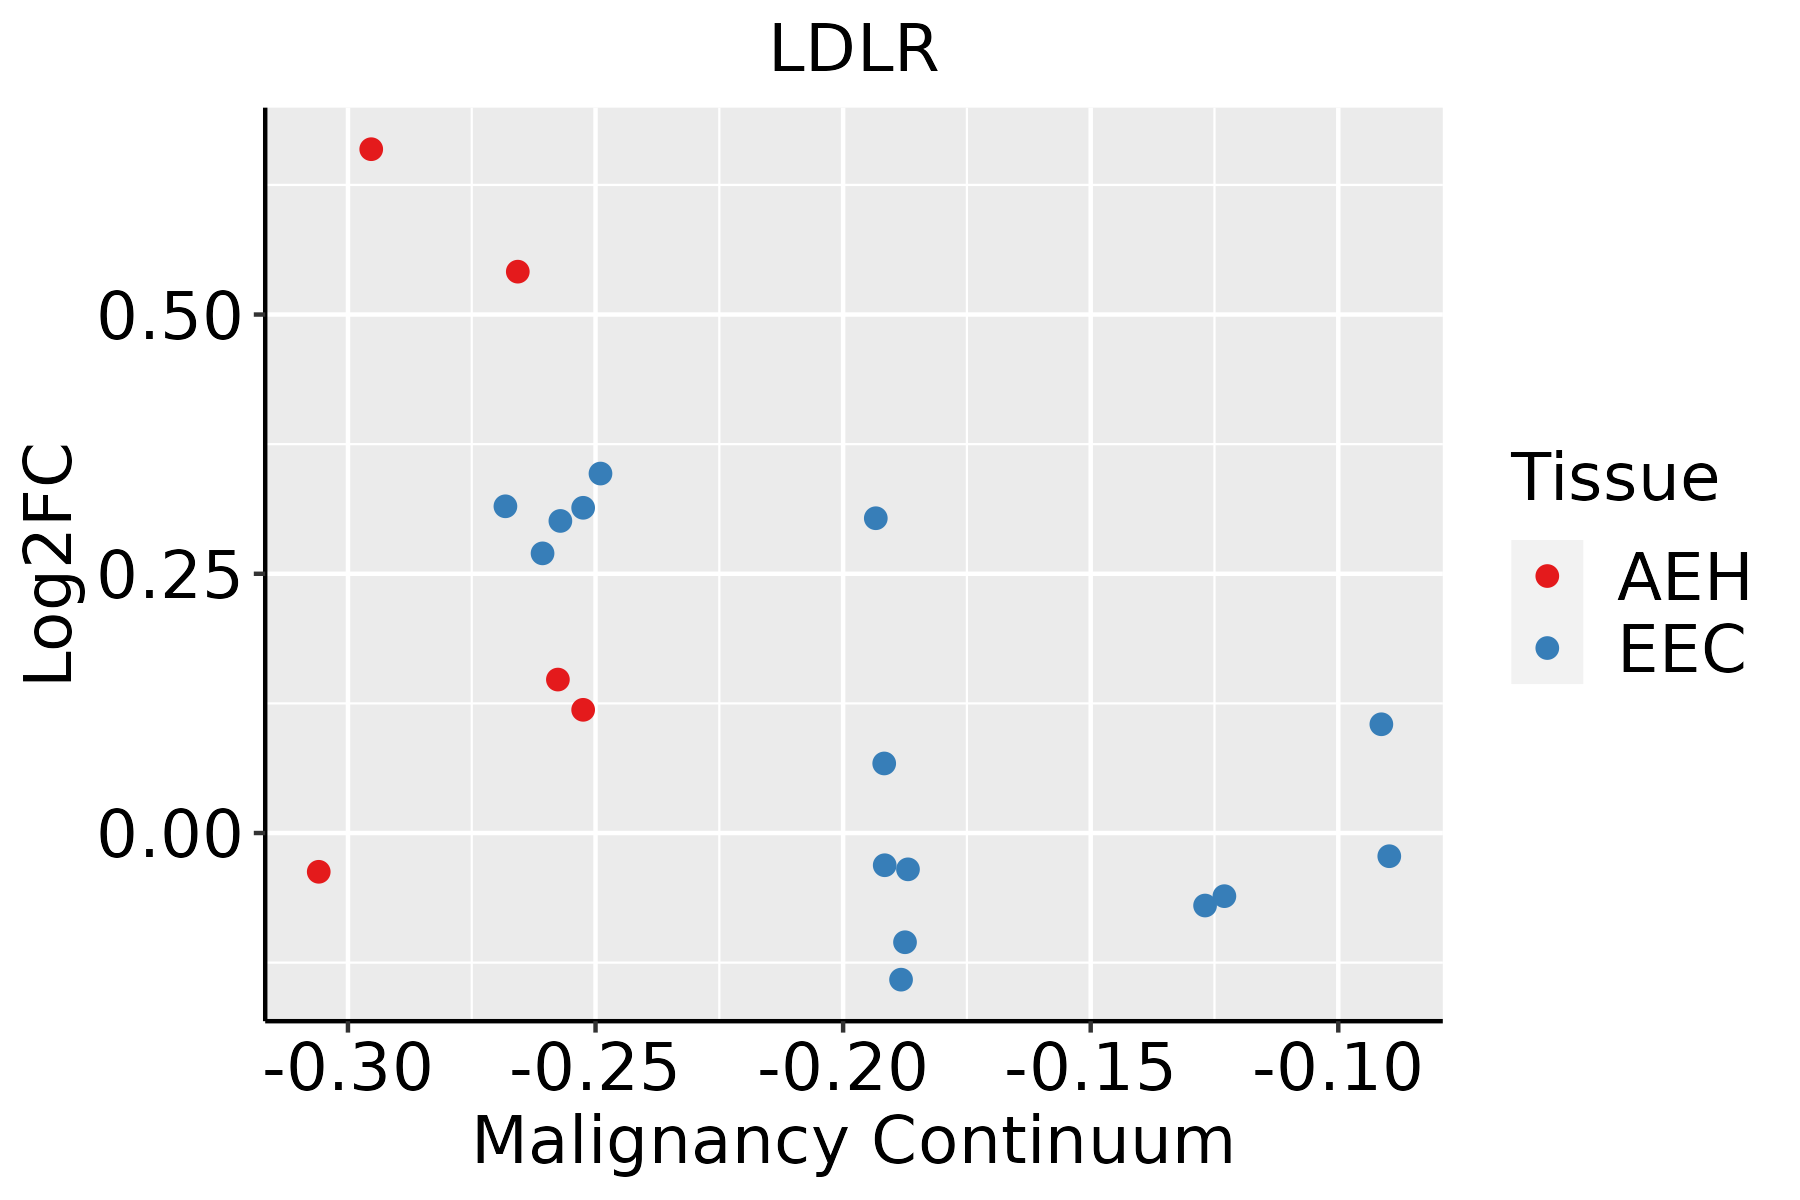 | AEH: Atypical endometrial hyperplasia |
| EEC: Endometrioid Cancer |
| Esophagus | 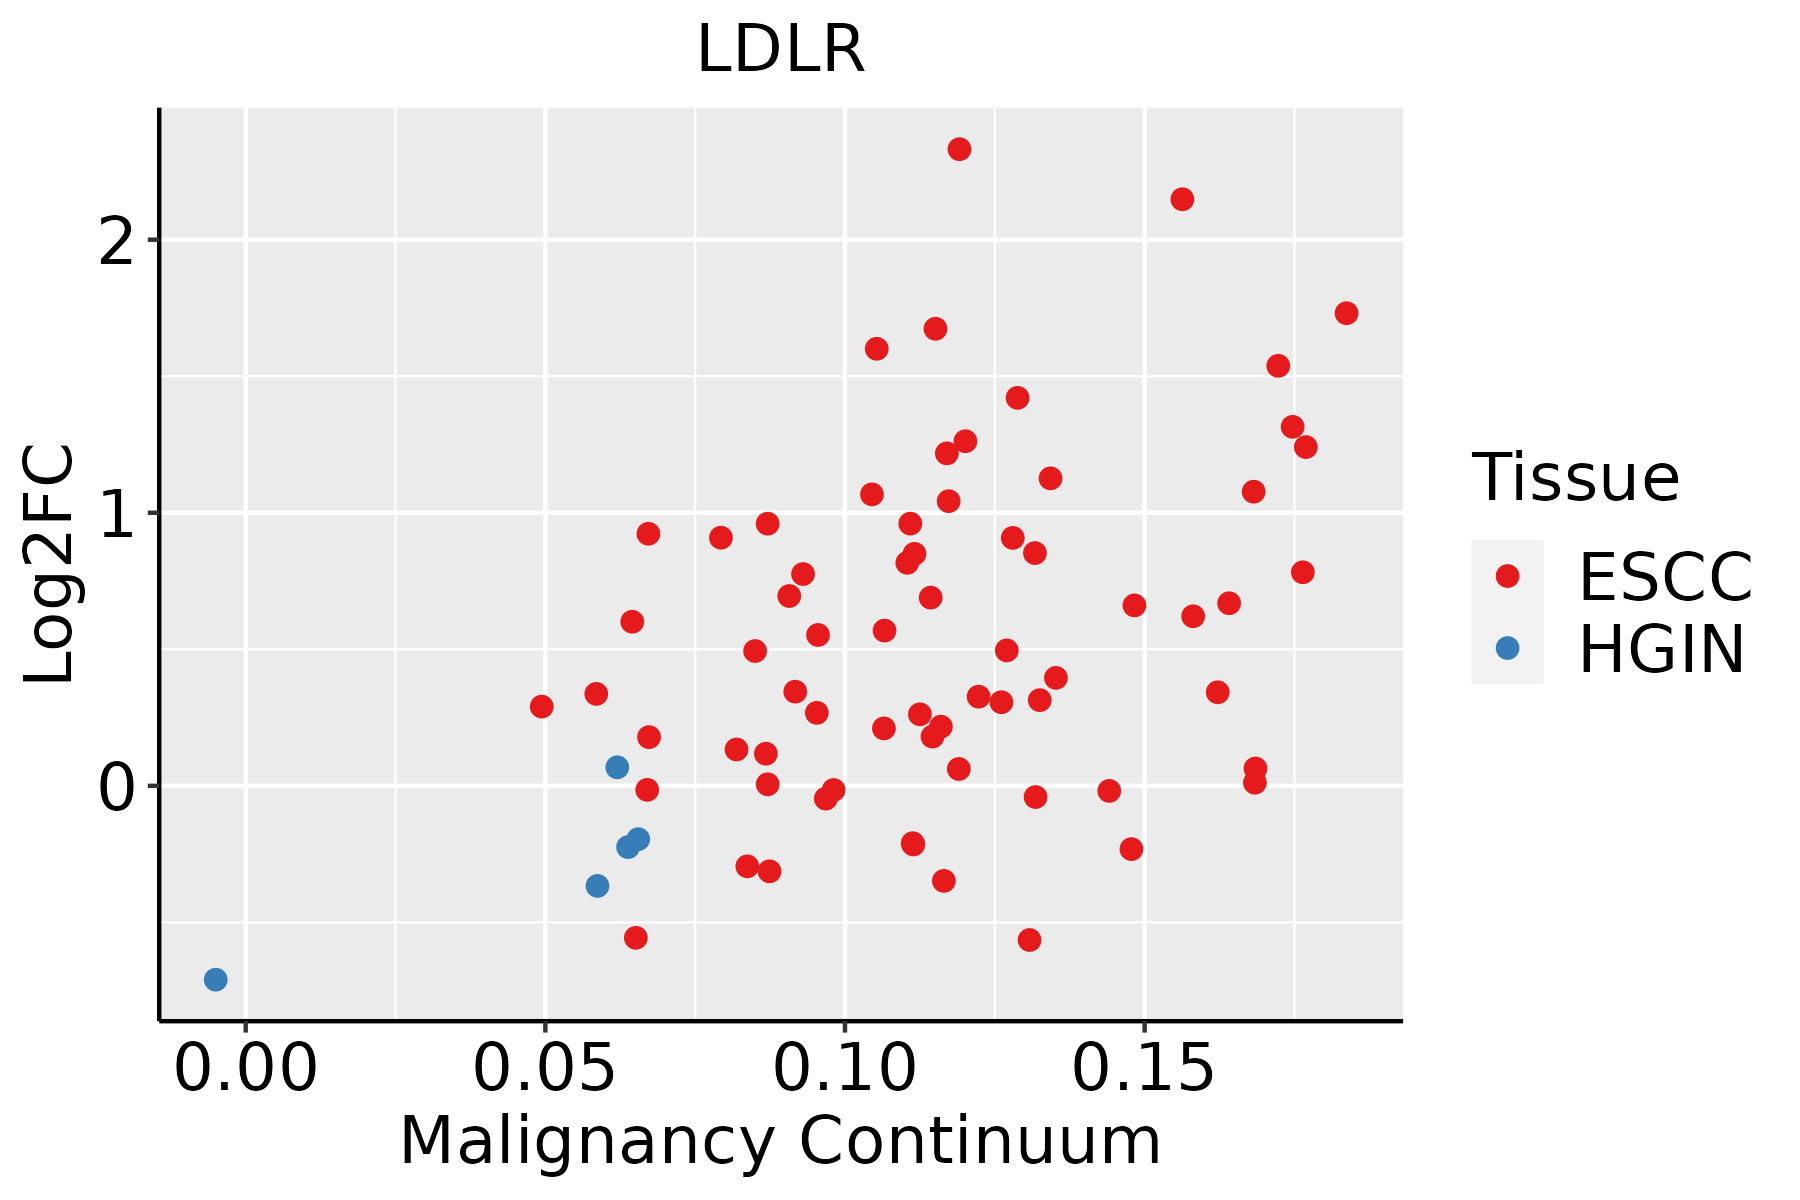 | ESCC: Esophageal squamous cell carcinoma |
| HGIN: High-grade intraepithelial neoplasias |
| LGIN: Low-grade intraepithelial neoplasias |
| GC |  | CAG: Chronic atrophic gastritis |
| CAG with IM: Chronic atrophic gastritis with intestinal metaplasia |
| CSG: Chronic superficial gastritis |
| GC: Gastric cancer |
| SIM: Severe intestinal metaplasia |
| WIM: Wild intestinal metaplasia |
| Liver | 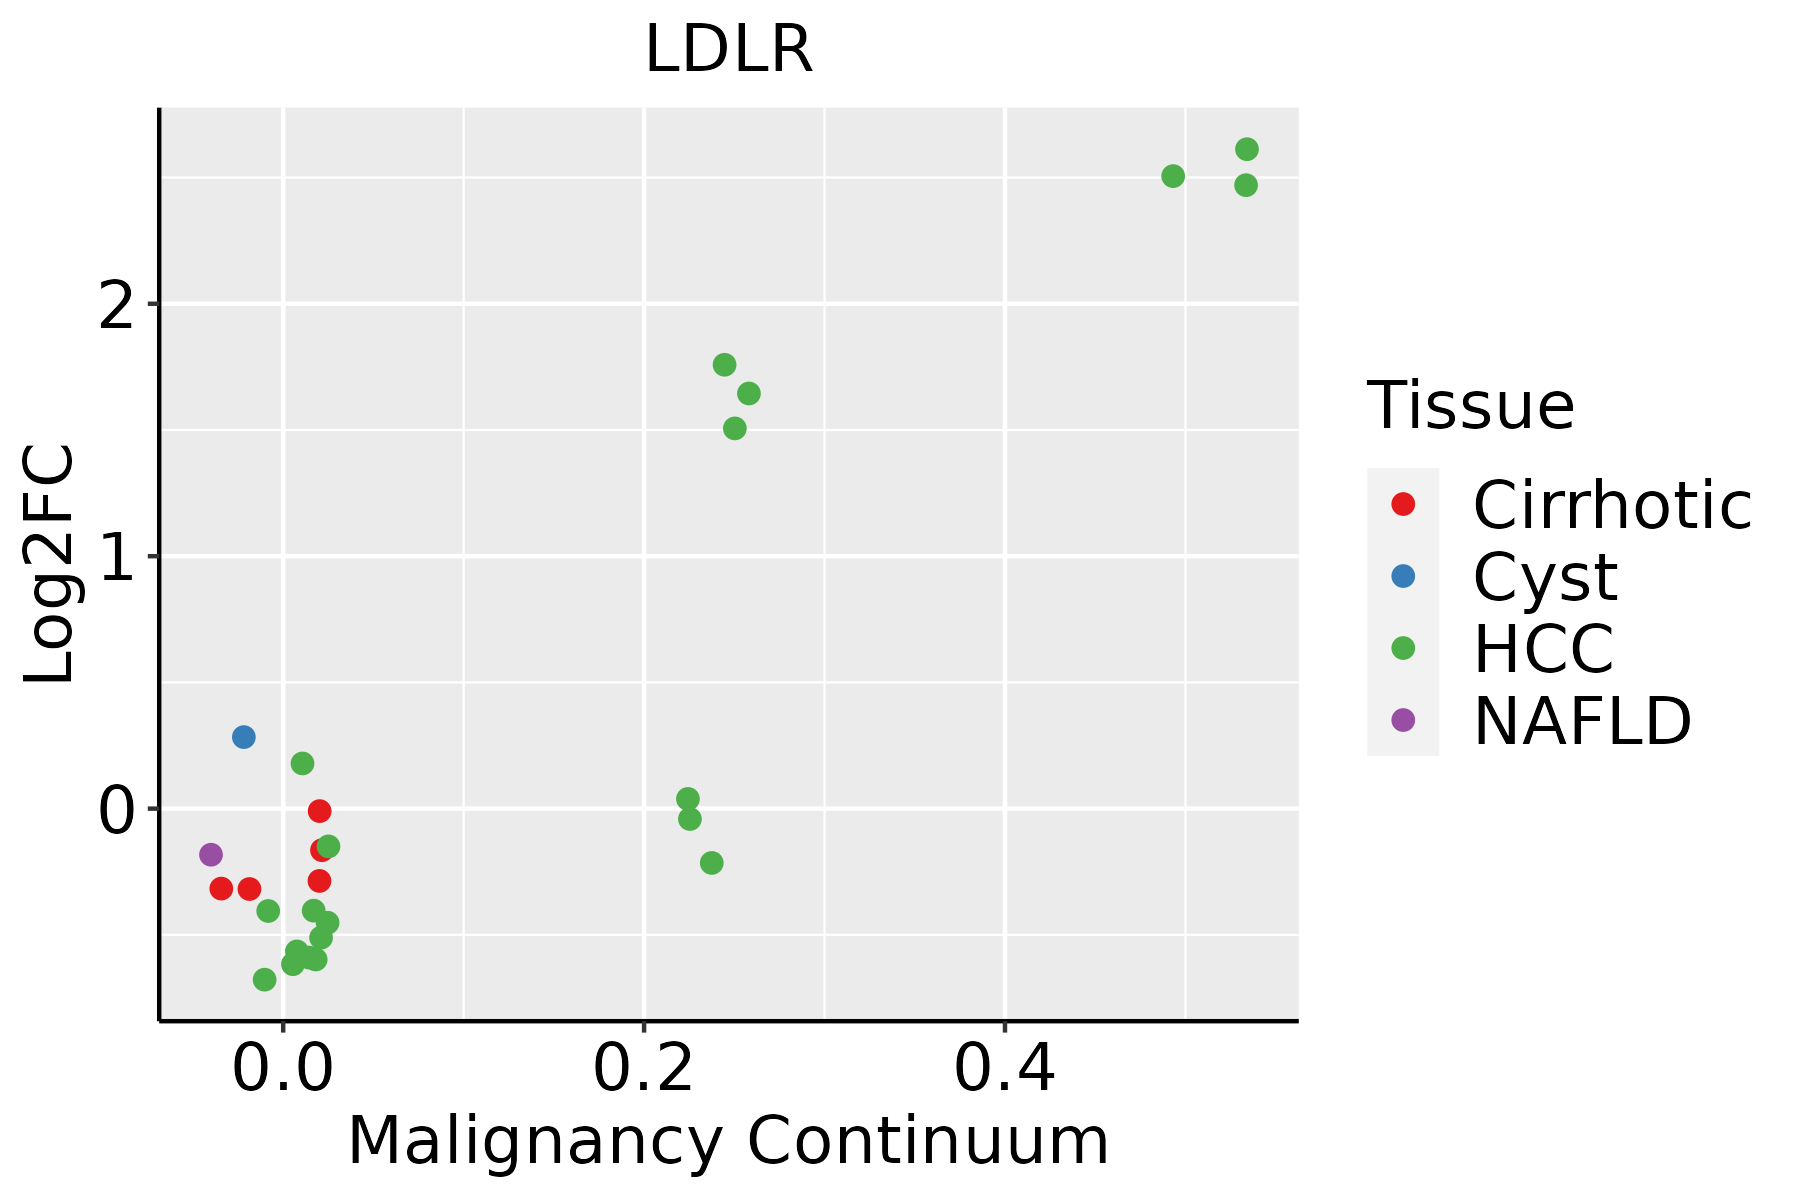 | HCC: Hepatocellular carcinoma |
| NAFLD: Non-alcoholic fatty liver disease |
| Lung |  | AAH: Atypical adenomatous hyperplasia |
| AIS: Adenocarcinoma in situ |
| IAC: Invasive lung adenocarcinoma |
| MIA: Minimally invasive adenocarcinoma |
| Oral Cavity | 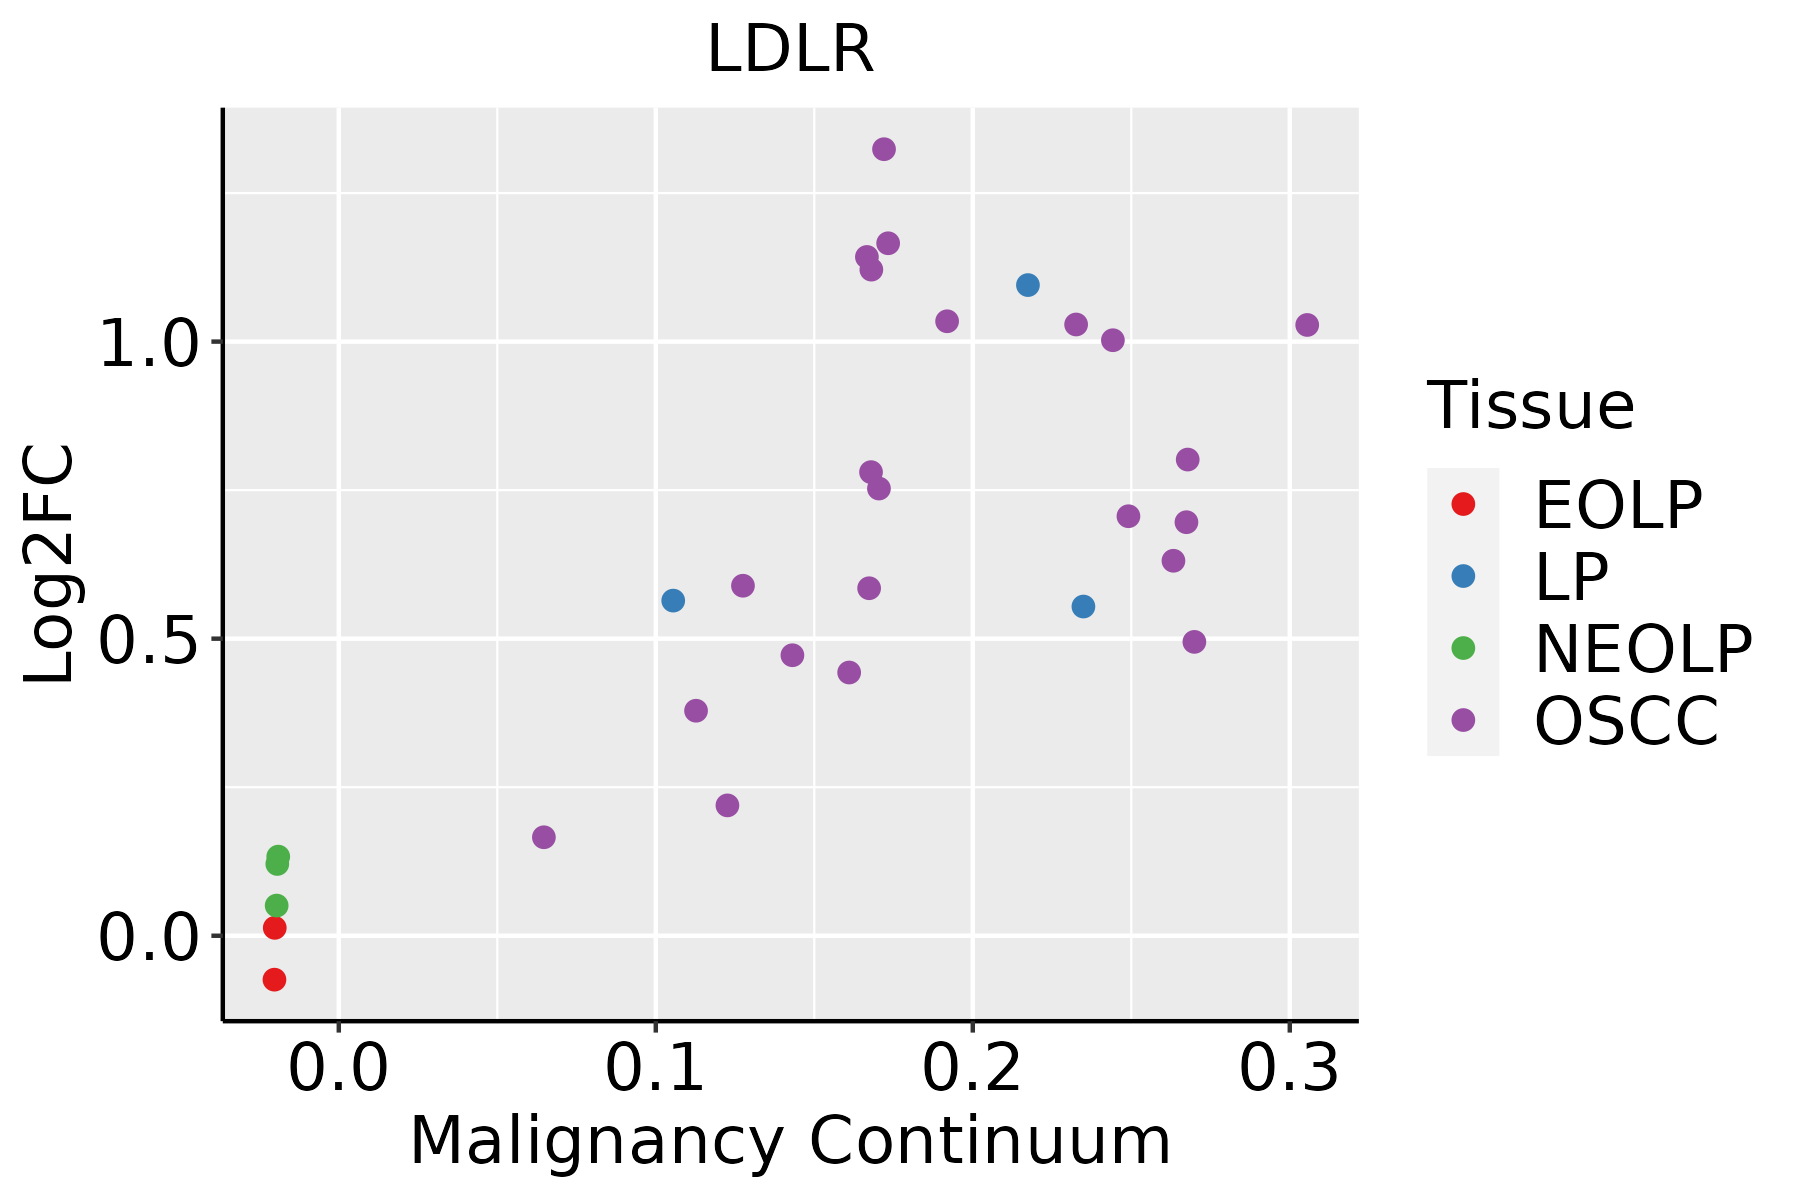 | EOLP: Erosive Oral lichen planus |
| LP: leukoplakia |
| NEOLP: Non-erosive oral lichen planus |
| OSCC: Oral squamous cell carcinoma |
| Prostate | 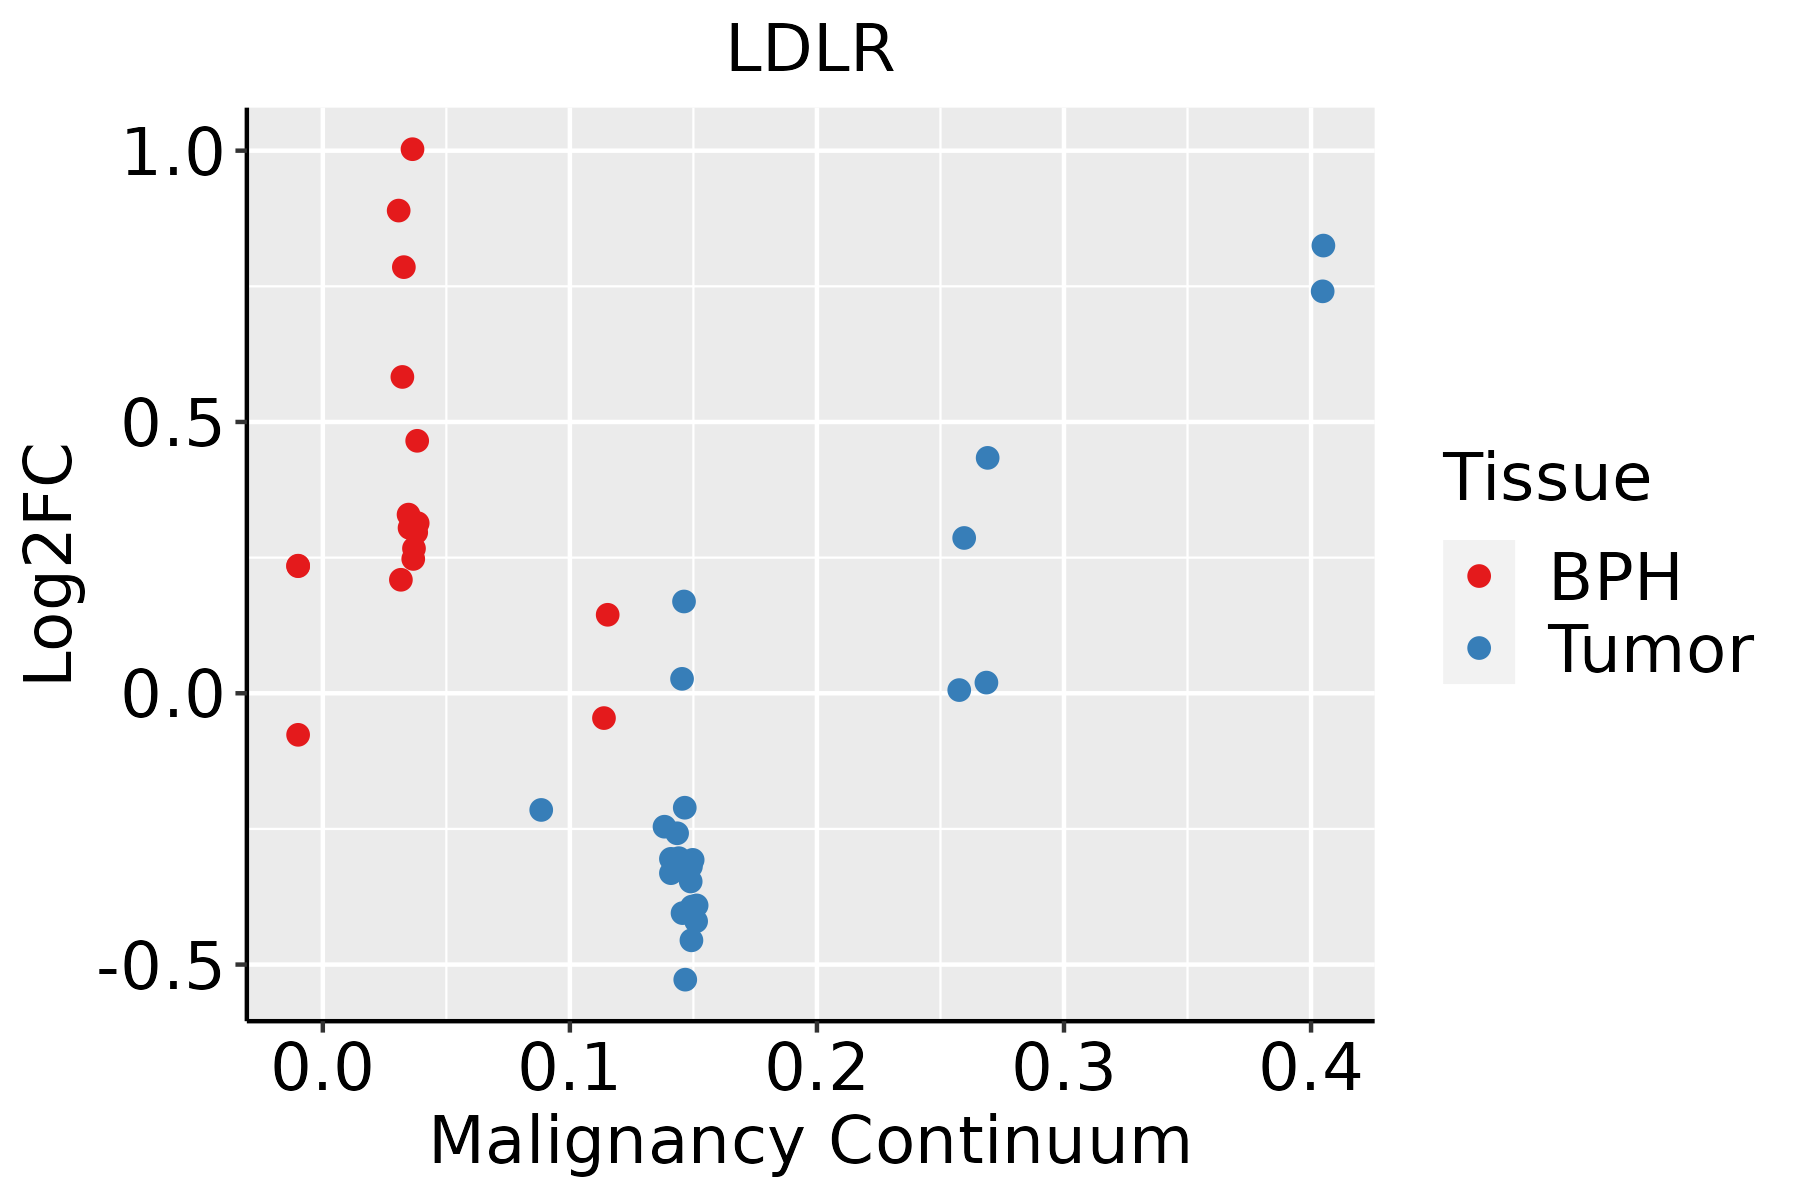 | BPH: Benign Prostatic Hyperplasia |
| Skin | 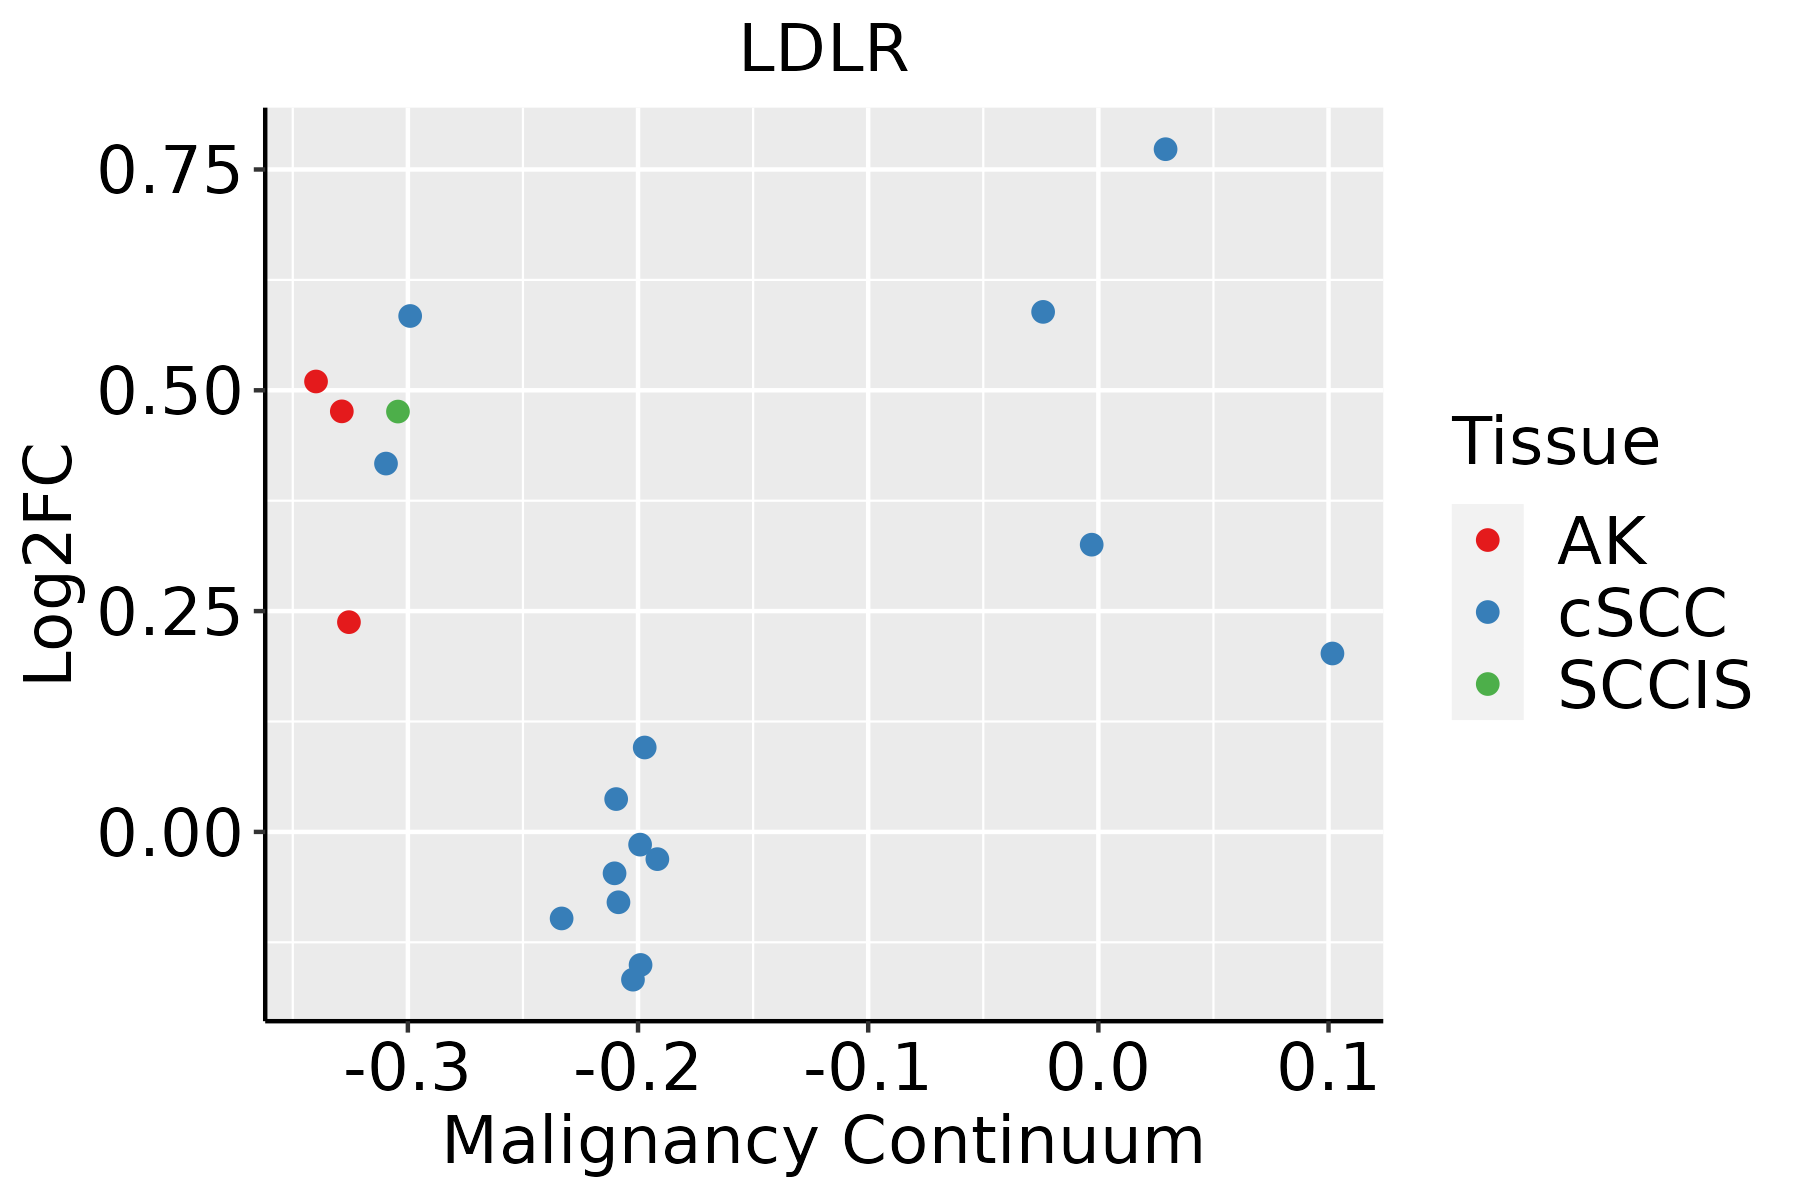 | AK: Actinic keratosis |
| cSCC: Cutaneous squamous cell carcinoma |
| SCCIS:squamous cell carcinoma in situ |
| Thyroid |  | ATC: Anaplastic thyroid cancer |
| HT: Hashimoto's thyroiditis |
| PTC: Papillary thyroid cancer |
| GO ID | Tissue | Disease Stage | Description | Gene Ratio | Bg Ratio | pvalue | p.adjust | Count |
| GO:004325414 | Breast | IDC | regulation of protein-containing complex assembly | 61/1434 | 428/18723 | 1.77e-06 | 7.31e-05 | 61 |
| GO:00512712 | Breast | IDC | negative regulation of cellular component movement | 48/1434 | 367/18723 | 1.88e-04 | 3.12e-03 | 48 |
| GO:20001462 | Breast | IDC | negative regulation of cell motility | 46/1434 | 359/18723 | 4.01e-04 | 5.60e-03 | 46 |
| GO:00459369 | Breast | IDC | negative regulation of phosphate metabolic process | 53/1434 | 441/18723 | 7.21e-04 | 8.79e-03 | 53 |
| GO:00105639 | Breast | IDC | negative regulation of phosphorus metabolic process | 53/1434 | 442/18723 | 7.60e-04 | 9.25e-03 | 53 |
| GO:00303362 | Breast | IDC | negative regulation of cell migration | 43/1434 | 344/18723 | 1.01e-03 | 1.13e-02 | 43 |
| GO:003133313 | Breast | IDC | negative regulation of protein-containing complex assembly | 22/1434 | 141/18723 | 1.07e-03 | 1.17e-02 | 22 |
| GO:00400132 | Breast | IDC | negative regulation of locomotion | 47/1434 | 391/18723 | 1.39e-03 | 1.43e-02 | 47 |
| GO:000183711 | Breast | IDC | epithelial to mesenchymal transition | 23/1434 | 157/18723 | 1.97e-03 | 1.88e-02 | 23 |
| GO:004325424 | Breast | DCIS | regulation of protein-containing complex assembly | 61/1390 | 428/18723 | 6.32e-07 | 2.71e-05 | 61 |
| GO:005127111 | Breast | DCIS | negative regulation of cellular component movement | 48/1390 | 367/18723 | 8.97e-05 | 1.69e-03 | 48 |
| GO:200014611 | Breast | DCIS | negative regulation of cell motility | 46/1390 | 359/18723 | 2.01e-04 | 3.23e-03 | 46 |
| GO:004593614 | Breast | DCIS | negative regulation of phosphate metabolic process | 53/1390 | 441/18723 | 3.48e-04 | 4.96e-03 | 53 |
| GO:001056314 | Breast | DCIS | negative regulation of phosphorus metabolic process | 53/1390 | 442/18723 | 3.68e-04 | 5.18e-03 | 53 |
| GO:003033611 | Breast | DCIS | negative regulation of cell migration | 43/1390 | 344/18723 | 5.41e-04 | 6.96e-03 | 43 |
| GO:003133322 | Breast | DCIS | negative regulation of protein-containing complex assembly | 22/1390 | 141/18723 | 7.08e-04 | 8.51e-03 | 22 |
| GO:004001311 | Breast | DCIS | negative regulation of locomotion | 47/1390 | 391/18723 | 7.30e-04 | 8.69e-03 | 47 |
| GO:000183721 | Breast | DCIS | epithelial to mesenchymal transition | 22/1390 | 157/18723 | 2.92e-03 | 2.50e-02 | 22 |
| GO:00423269 | Breast | DCIS | negative regulation of phosphorylation | 43/1390 | 385/18723 | 4.78e-03 | 3.62e-02 | 43 |
| GO:00019339 | Breast | DCIS | negative regulation of protein phosphorylation | 39/1390 | 342/18723 | 4.94e-03 | 3.71e-02 | 39 |
| Hugo Symbol | Variant Class | Variant Classification | dbSNP RS | HGVSc | HGVSp | HGVSp Short | SWISSPROT | BIOTYPE | SIFT | PolyPhen | Tumor Sample Barcode | Tissue | Histology | Sex | Age | Stage | Therapy Types | Drugs | Outcome |
| LDLR | SNV | Missense_Mutation | | c.617N>T | p.Ser206Ile | p.S206I | P01130 | protein_coding | deleterious(0) | probably_damaging(0.998) | TCGA-A7-A0DA-01 | Breast | breast invasive carcinoma | Female | <65 | I/II | Chemotherapy | adriamycin | SD |
| LDLR | SNV | Missense_Mutation | rs376459828 | c.590N>A | p.Cys197Tyr | p.C197Y | P01130 | protein_coding | deleterious(0) | probably_damaging(0.994) | TCGA-AR-A2LE-01 | Breast | breast invasive carcinoma | Female | >=65 | I/II | Hormone Therapy | tamoxiphen | PD |
| LDLR | insertion | Frame_Shift_Ins | | c.241_242insA | p.Arg81GlnfsTer49 | p.R81Qfs*49 | P01130 | protein_coding | | | TCGA-A8-A08H-01 | Breast | breast invasive carcinoma | Female | >=65 | I/II | Unknown | Unknown | SD |
| LDLR | insertion | Frame_Shift_Ins | novel | c.242_243insTCTCACT | p.Cys82LeufsTer50 | p.C82Lfs*50 | P01130 | protein_coding | | | TCGA-A8-A08H-01 | Breast | breast invasive carcinoma | Female | >=65 | I/II | Unknown | Unknown | SD |
| LDLR | insertion | Frame_Shift_Ins | novel | c.866_867insGAAGTTGGCTGCGTTAATGGTGAGCGCTGGCCATCTGGTTTTC | p.Cys289TrpfsTer26 | p.C289Wfs*26 | P01130 | protein_coding | | | TCGA-BH-A0BD-01 | Breast | breast invasive carcinoma | Female | <65 | I/II | Chemotherapy | doxorubicin | SD |
| LDLR | insertion | Frame_Shift_Ins | novel | c.2350_2351insG | p.Pro784ArgfsTer3 | p.P784Rfs*3 | P01130 | protein_coding | | | TCGA-BH-A0BR-01 | Breast | breast invasive carcinoma | Female | <65 | I/II | Unknown | Unknown | SD |
| LDLR | insertion | Frame_Shift_Ins | novel | c.2352_2353insCACCGCCACGGCTGGCTAATTTTTGTATTTTT | p.Ser785HisfsTer14 | p.S785Hfs*14 | P01130 | protein_coding | | | TCGA-BH-A0BR-01 | Breast | breast invasive carcinoma | Female | <65 | I/II | Unknown | Unknown | SD |
| LDLR | deletion | Frame_Shift_Del | novel | c.1931delN | p.Asn645ThrfsTer20 | p.N645Tfs*20 | P01130 | protein_coding | | | TCGA-EW-A2FV-01 | Breast | breast invasive carcinoma | Female | <65 | III/IV | Chemotherapy | docetaxel | SD |
| LDLR | SNV | Missense_Mutation | rs121908029 | c.682N>A | p.Glu228Lys | p.E228K | P01130 | protein_coding | deleterious(0) | probably_damaging(0.997) | TCGA-FU-A40J-01 | Cervix | cervical & endocervical cancer | Female | <65 | III/IV | Chemotherapy | carboplatin | CR |
| LDLR | SNV | Missense_Mutation | rs750126678 | c.323N>T | p.Thr108Met | p.T108M | P01130 | protein_coding | deleterious(0.01) | possibly_damaging(0.807) | TCGA-A6-5661-01 | Colorectum | colon adenocarcinoma | Female | >=65 | I/II | Unknown | Unknown | SD |
| Entrez ID | Symbol | Category | Interaction Types | Drug Claim Name | Drug Name | PMIDs |
| 3949 | LDLR | ENZYME, CLINICALLY ACTIONABLE, EXTERNAL SIDE OF PLASMA MEMBRANE, CELL SURFACE, DRUGGABLE GENOME | | Porfimer Sodium | | |
| 3949 | LDLR | ENZYME, CLINICALLY ACTIONABLE, EXTERNAL SIDE OF PLASMA MEMBRANE, CELL SURFACE, DRUGGABLE GENOME | | GEMFIBROZIL | GEMFIBROZIL | 9409246 |
| 3949 | LDLR | ENZYME, CLINICALLY ACTIONABLE, EXTERNAL SIDE OF PLASMA MEMBRANE, CELL SURFACE, DRUGGABLE GENOME | | evolocumab | EVOLOCUMAB | |
| 3949 | LDLR | ENZYME, CLINICALLY ACTIONABLE, EXTERNAL SIDE OF PLASMA MEMBRANE, CELL SURFACE, DRUGGABLE GENOME | | ANTIVIRAL | | 8211145 |
| 3949 | LDLR | ENZYME, CLINICALLY ACTIONABLE, EXTERNAL SIDE OF PLASMA MEMBRANE, CELL SURFACE, DRUGGABLE GENOME | | lovastatin | LOVASTATIN | 16103896 |
| 3949 | LDLR | ENZYME, CLINICALLY ACTIONABLE, EXTERNAL SIDE OF PLASMA MEMBRANE, CELL SURFACE, DRUGGABLE GENOME | | HEPARIN CALCIUM | | 17322644 |
| 3949 | LDLR | ENZYME, CLINICALLY ACTIONABLE, EXTERNAL SIDE OF PLASMA MEMBRANE, CELL SURFACE, DRUGGABLE GENOME | | RETINOL | RETINOL | 2920014 |
| 3949 | LDLR | ENZYME, CLINICALLY ACTIONABLE, EXTERNAL SIDE OF PLASMA MEMBRANE, CELL SURFACE, DRUGGABLE GENOME | | ANTIBIOTICS | | 9470171 |
| 3949 | LDLR | ENZYME, CLINICALLY ACTIONABLE, EXTERNAL SIDE OF PLASMA MEMBRANE, CELL SURFACE, DRUGGABLE GENOME | | PF-429242 | CHEMBL233611 | 17583500 |
| 3949 | LDLR | ENZYME, CLINICALLY ACTIONABLE, EXTERNAL SIDE OF PLASMA MEMBRANE, CELL SURFACE, DRUGGABLE GENOME | | mipomersen | MIPOMERSEN | |


