
|
|||||
|
 | |
| |
| |
| |
| |
| |
|
Gene: LDHB |
Gene summary for LDHB |
| Gene information | Species | Human | Gene symbol | LDHB | Gene ID | 3945 |
| Gene name | lactate dehydrogenase B | |
| Gene Alias | HEL-S-281 | |
| Cytomap | 12p12.1 | |
| Gene Type | protein-coding | GO ID | GO:0005975 | UniProtAcc | P07195 |
Top |
Malignant transformation analysis |
| Identification of the aberrant gene expression in precancerous and cancerous lesions by comparing the gene expression of stem-like cells in diseased tissues with normal stem cells |
| Entrez ID | Symbol | Replicates | Species | Organ | Tissue | Adj P-value | Log2FC | Malignancy |
| 3945 | LDHB | GSM4909282 | Human | Breast | IDC | 8.86e-05 | 2.64e-01 | -0.0288 |
| 3945 | LDHB | GSM4909285 | Human | Breast | IDC | 1.22e-11 | 4.03e-01 | 0.21 |
| 3945 | LDHB | GSM4909287 | Human | Breast | IDC | 1.92e-08 | 2.31e-01 | 0.2057 |
| 3945 | LDHB | GSM4909288 | Human | Breast | IDC | 2.12e-04 | -4.08e-02 | 0.0988 |
| 3945 | LDHB | GSM4909291 | Human | Breast | IDC | 3.69e-30 | -8.53e-01 | 0.1753 |
| 3945 | LDHB | GSM4909292 | Human | Breast | IDC | 3.05e-04 | -7.98e-01 | 0.1236 |
| 3945 | LDHB | GSM4909294 | Human | Breast | IDC | 5.73e-26 | -6.25e-01 | 0.2022 |
| 3945 | LDHB | GSM4909296 | Human | Breast | IDC | 5.55e-43 | -8.36e-01 | 0.1524 |
| 3945 | LDHB | GSM4909297 | Human | Breast | IDC | 2.07e-29 | -3.46e-01 | 0.1517 |
| 3945 | LDHB | GSM4909298 | Human | Breast | IDC | 1.54e-17 | -5.92e-01 | 0.1551 |
| 3945 | LDHB | GSM4909301 | Human | Breast | IDC | 6.68e-35 | -7.83e-01 | 0.1577 |
| 3945 | LDHB | GSM4909302 | Human | Breast | IDC | 3.87e-36 | -7.79e-01 | 0.1545 |
| 3945 | LDHB | GSM4909304 | Human | Breast | IDC | 5.59e-34 | -7.40e-01 | 0.1636 |
| 3945 | LDHB | GSM4909306 | Human | Breast | IDC | 3.71e-12 | -5.16e-01 | 0.1564 |
| 3945 | LDHB | GSM4909307 | Human | Breast | IDC | 1.20e-20 | -6.22e-01 | 0.1569 |
| 3945 | LDHB | GSM4909308 | Human | Breast | IDC | 5.47e-25 | -7.31e-01 | 0.158 |
| 3945 | LDHB | GSM4909309 | Human | Breast | IDC | 2.54e-03 | -3.56e-01 | 0.0483 |
| 3945 | LDHB | GSM4909311 | Human | Breast | IDC | 3.41e-51 | -8.37e-01 | 0.1534 |
| 3945 | LDHB | GSM4909312 | Human | Breast | IDC | 2.28e-44 | -8.19e-01 | 0.1552 |
| 3945 | LDHB | GSM4909313 | Human | Breast | IDC | 5.11e-11 | -5.56e-01 | 0.0391 |
| Page: 1 2 3 4 5 6 7 8 9 10 11 12 13 14 15 16 |
| Tissue | Expression Dynamics | Abbreviation |
| Breast | 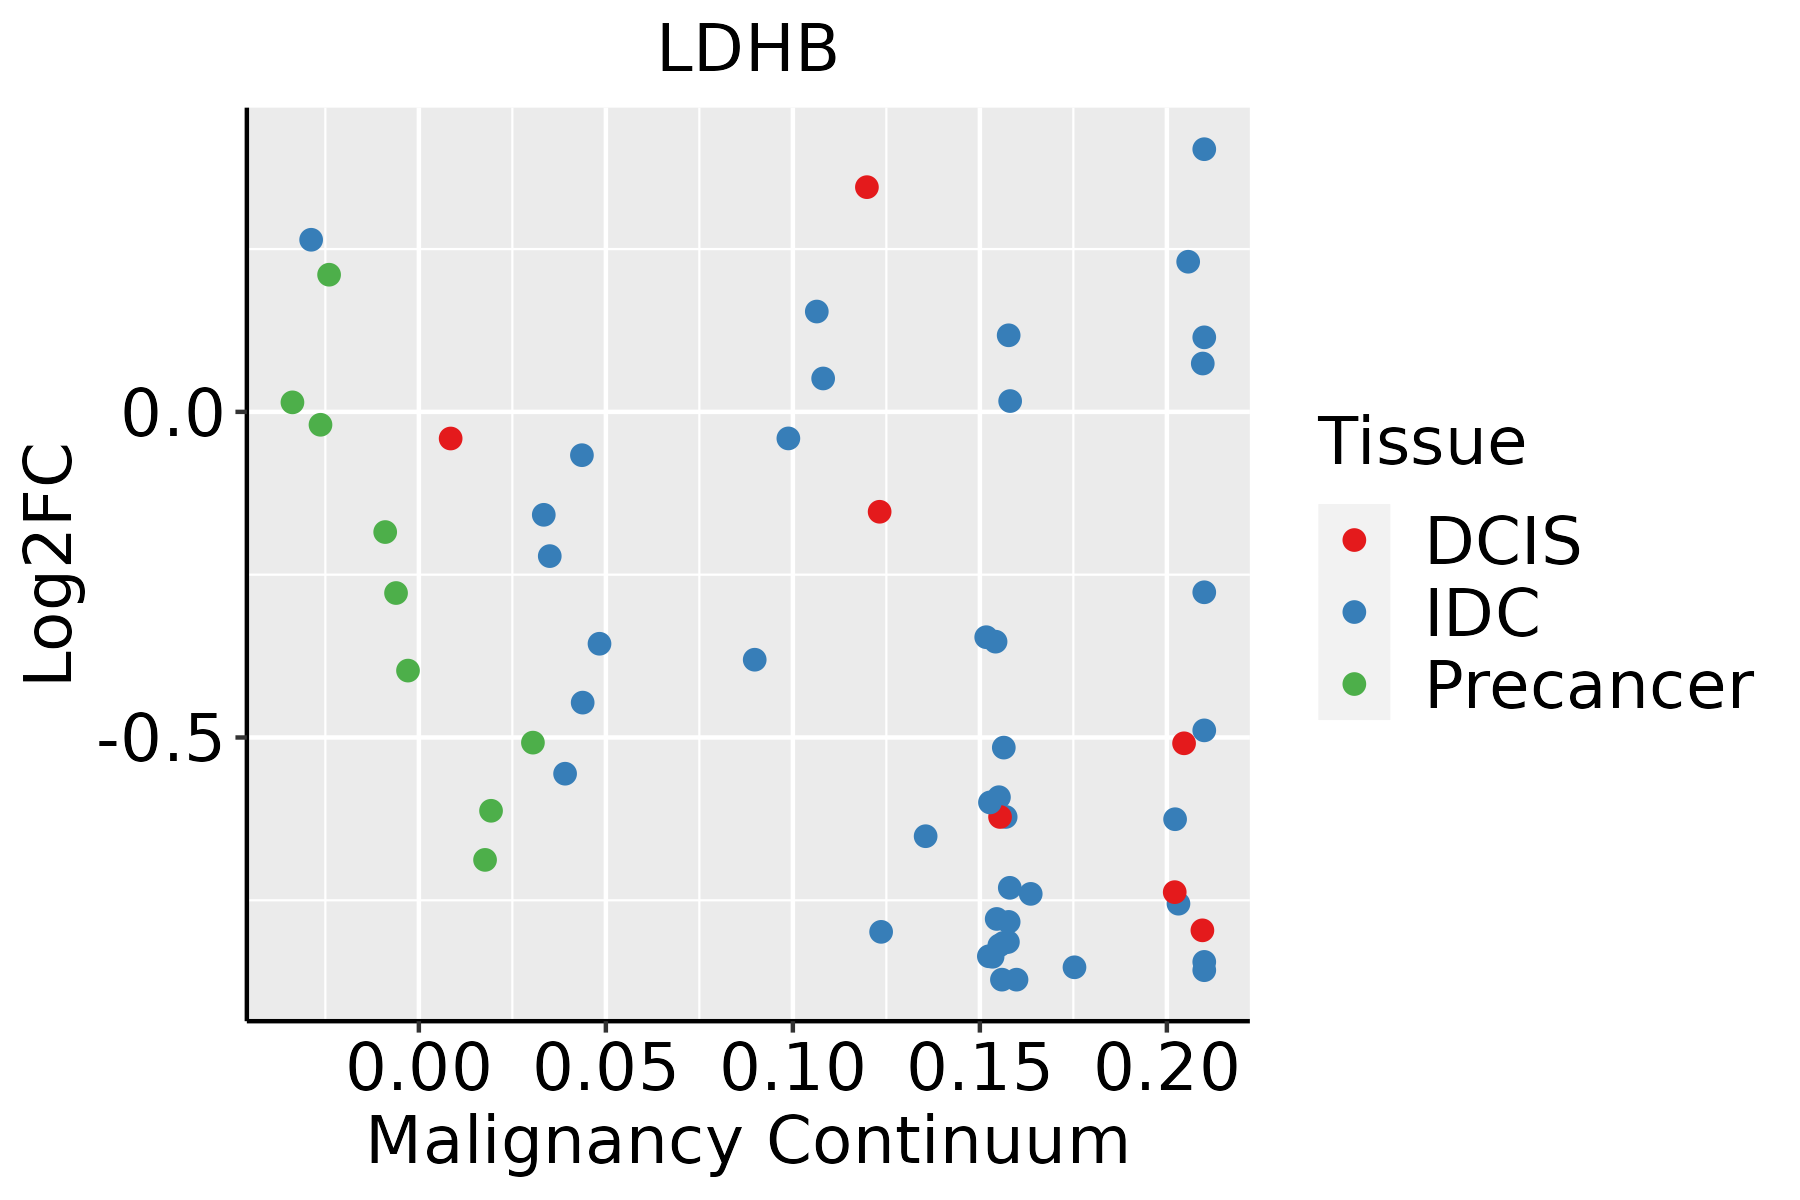 | IDC: Invasive ductal carcinoma |
| DCIS: Ductal carcinoma in situ | ||
| Precancer(BRCA1-mut): Precancerous lesion from BRCA1 mutation carriers | ||
| Cervix | 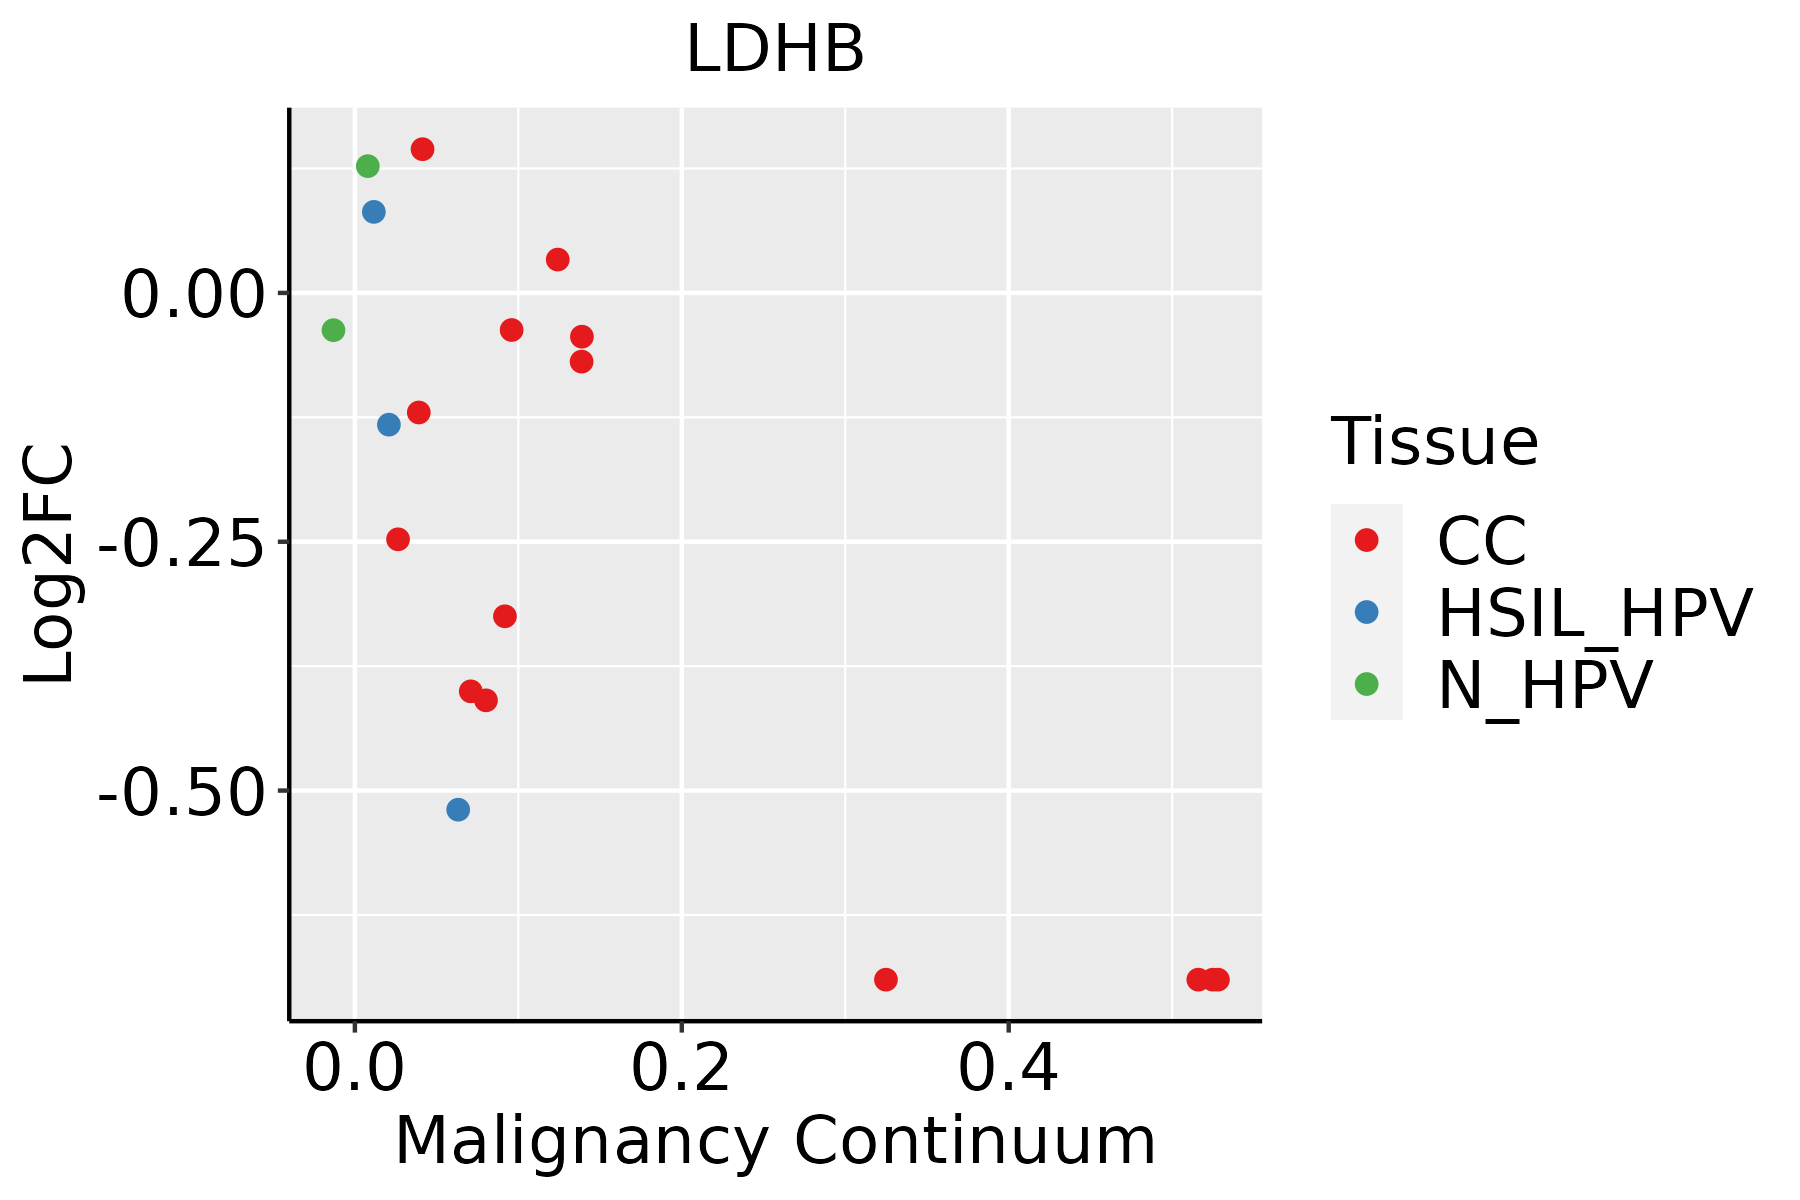 | CC: Cervix cancer |
| HSIL_HPV: HPV-infected high-grade squamous intraepithelial lesions | ||
| N_HPV: HPV-infected normal cervix | ||
| Colorectum (GSE201348) |  | FAP: Familial adenomatous polyposis |
| CRC: Colorectal cancer | ||
| Colorectum (HTA11) |  | AD: Adenomas |
| SER: Sessile serrated lesions | ||
| MSI-H: Microsatellite-high colorectal cancer | ||
| MSS: Microsatellite stable colorectal cancer | ||
| Endometrium | 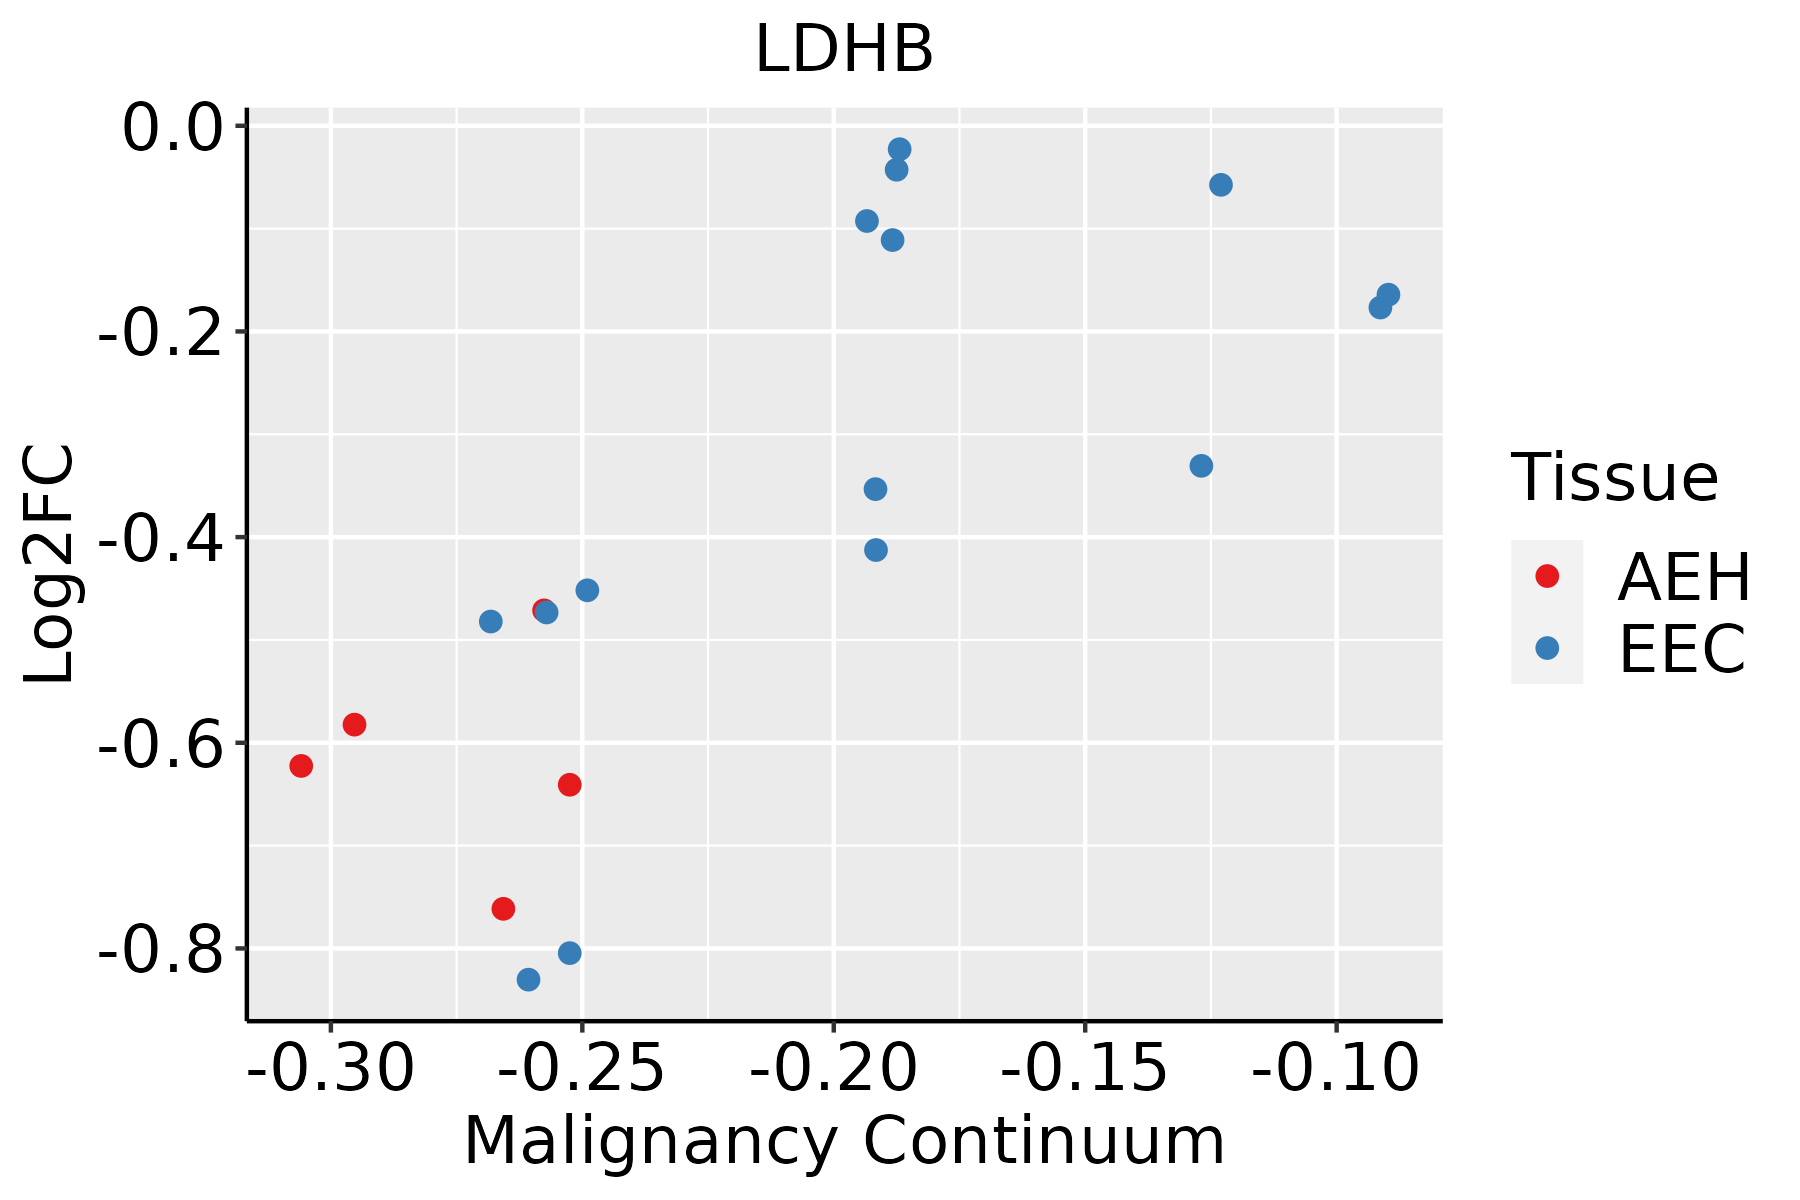 | AEH: Atypical endometrial hyperplasia |
| EEC: Endometrioid Cancer | ||
| Esophagus | 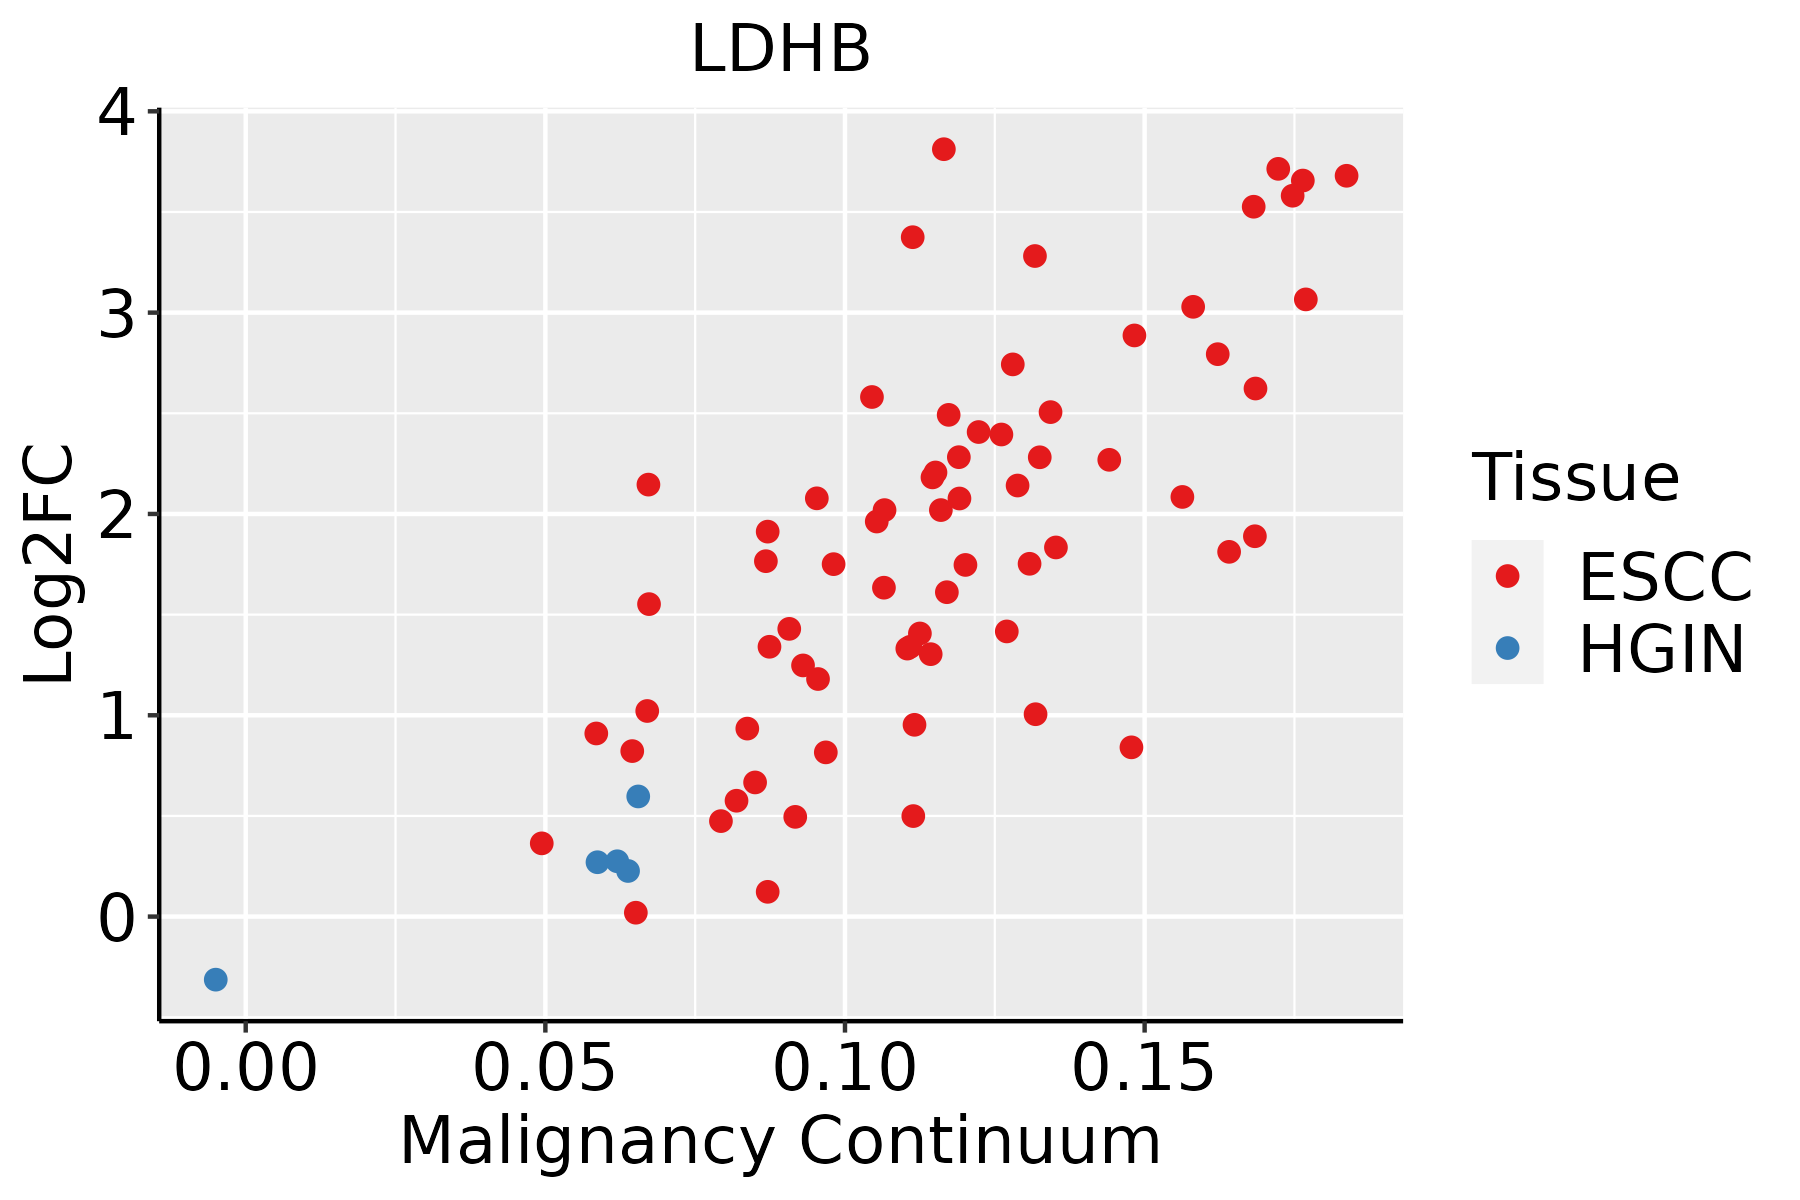 | ESCC: Esophageal squamous cell carcinoma |
| HGIN: High-grade intraepithelial neoplasias | ||
| LGIN: Low-grade intraepithelial neoplasias | ||
| GC | 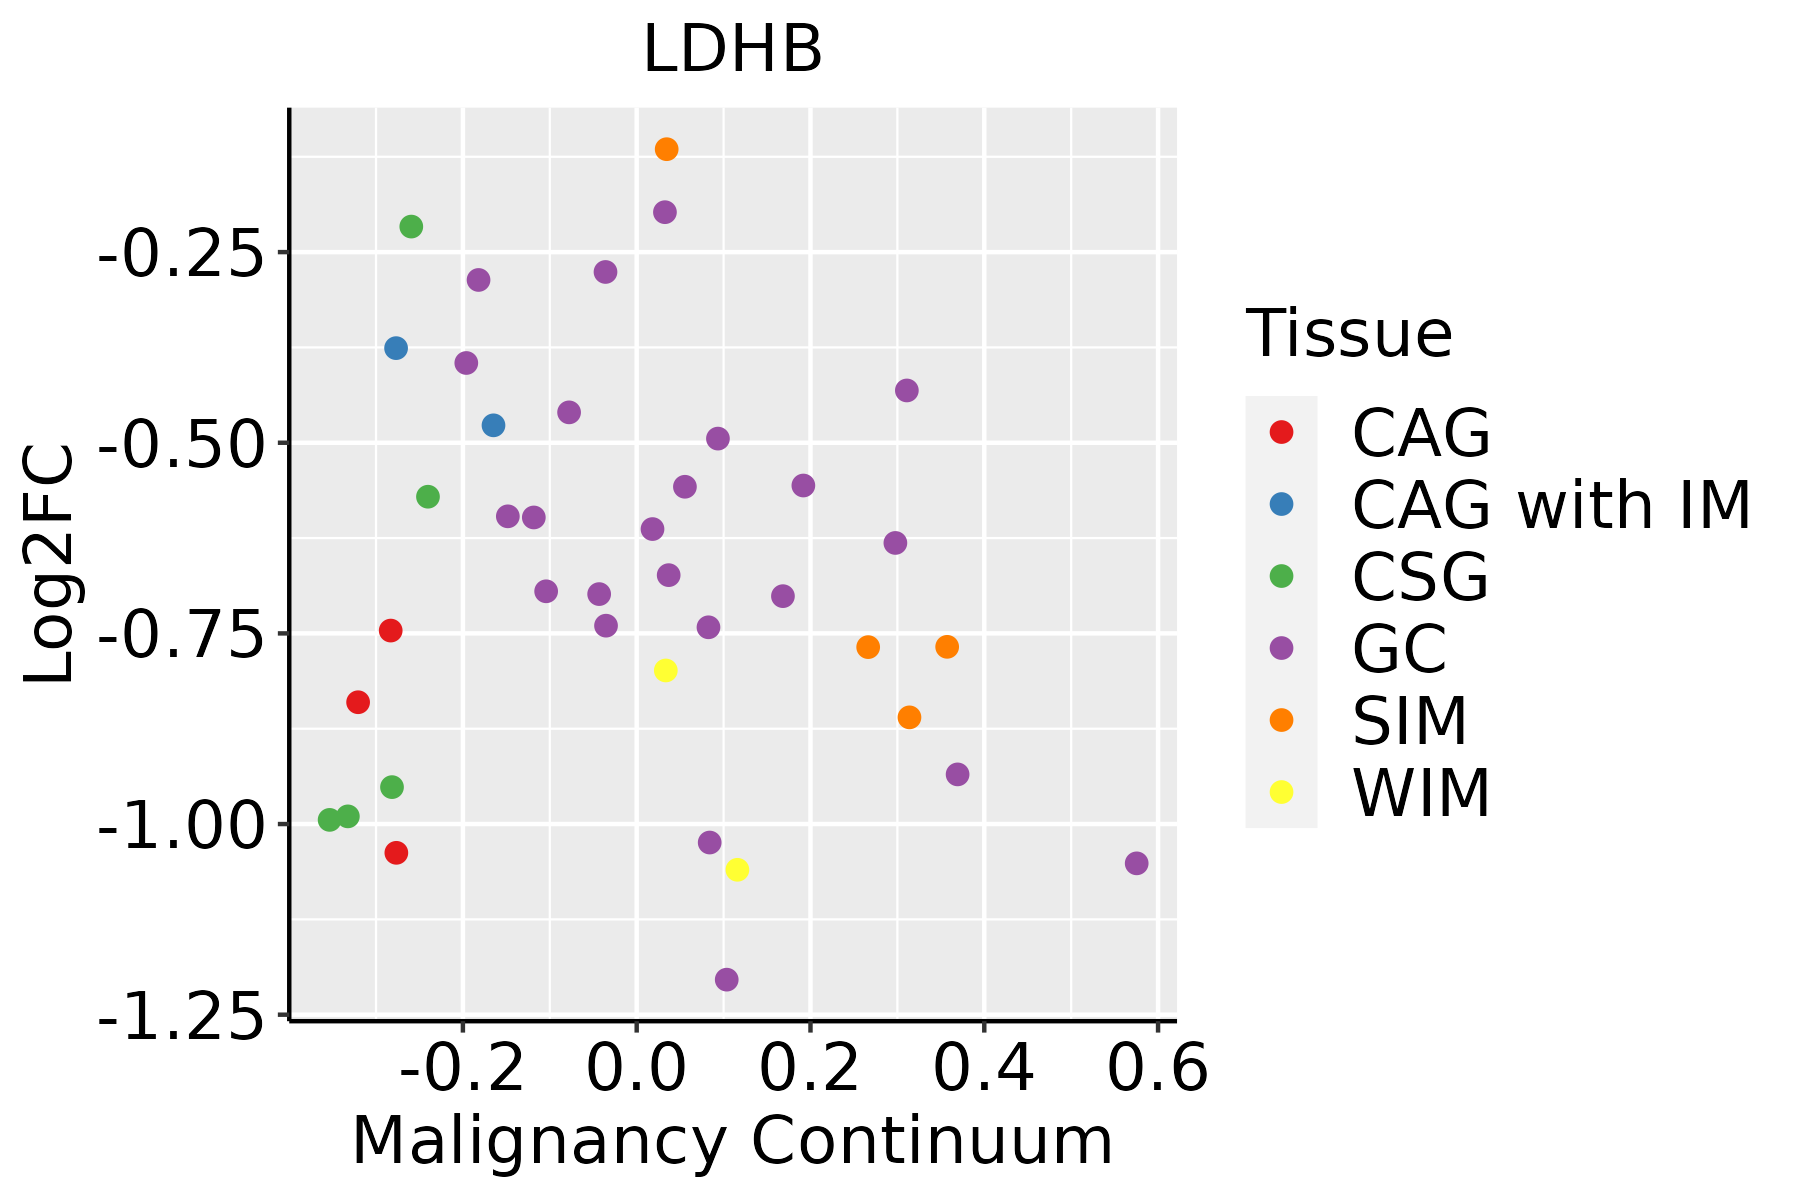 | CAG: Chronic atrophic gastritis |
| CAG with IM: Chronic atrophic gastritis with intestinal metaplasia | ||
| CSG: Chronic superficial gastritis | ||
| GC: Gastric cancer | ||
| SIM: Severe intestinal metaplasia | ||
| WIM: Wild intestinal metaplasia | ||
| Liver | 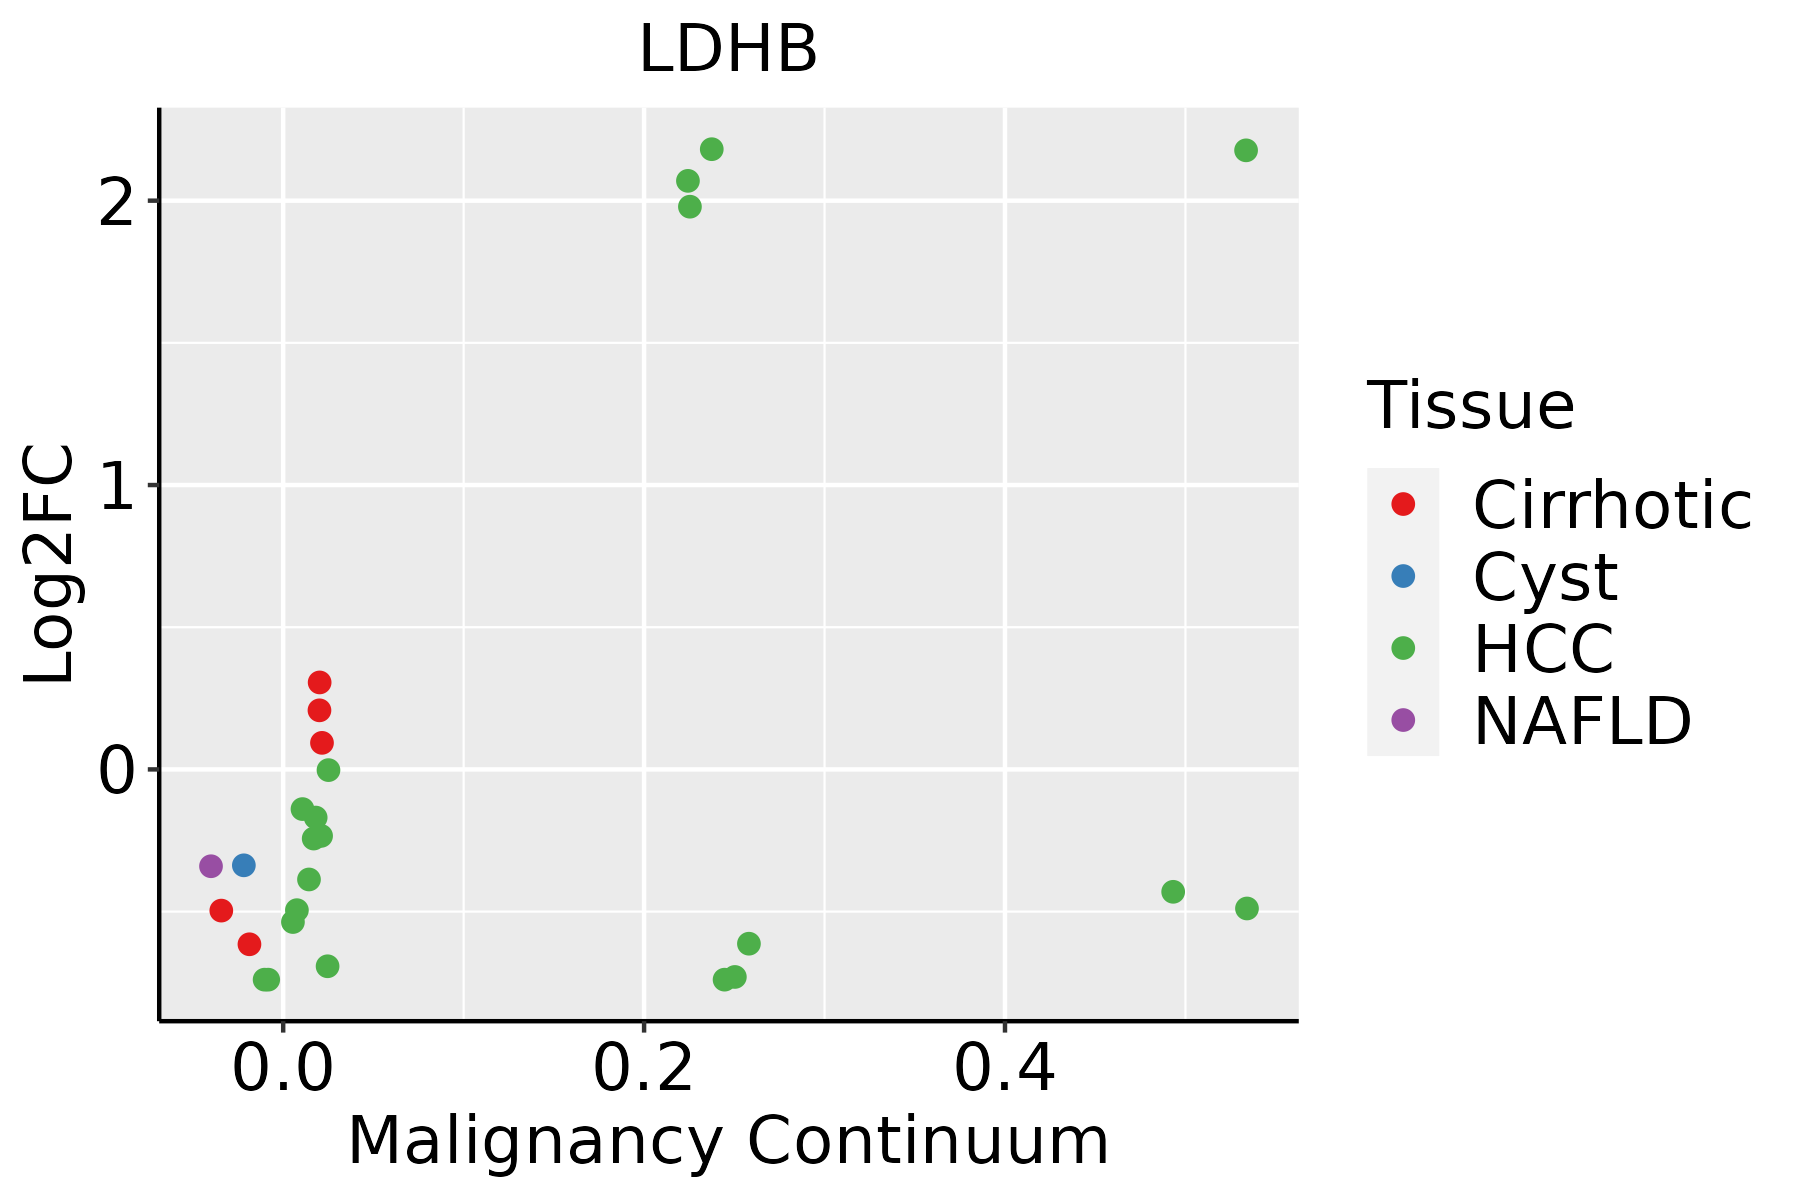 | HCC: Hepatocellular carcinoma |
| NAFLD: Non-alcoholic fatty liver disease | ||
| Lung |  | AAH: Atypical adenomatous hyperplasia |
| AIS: Adenocarcinoma in situ | ||
| IAC: Invasive lung adenocarcinoma | ||
| MIA: Minimally invasive adenocarcinoma | ||
| Oral Cavity | 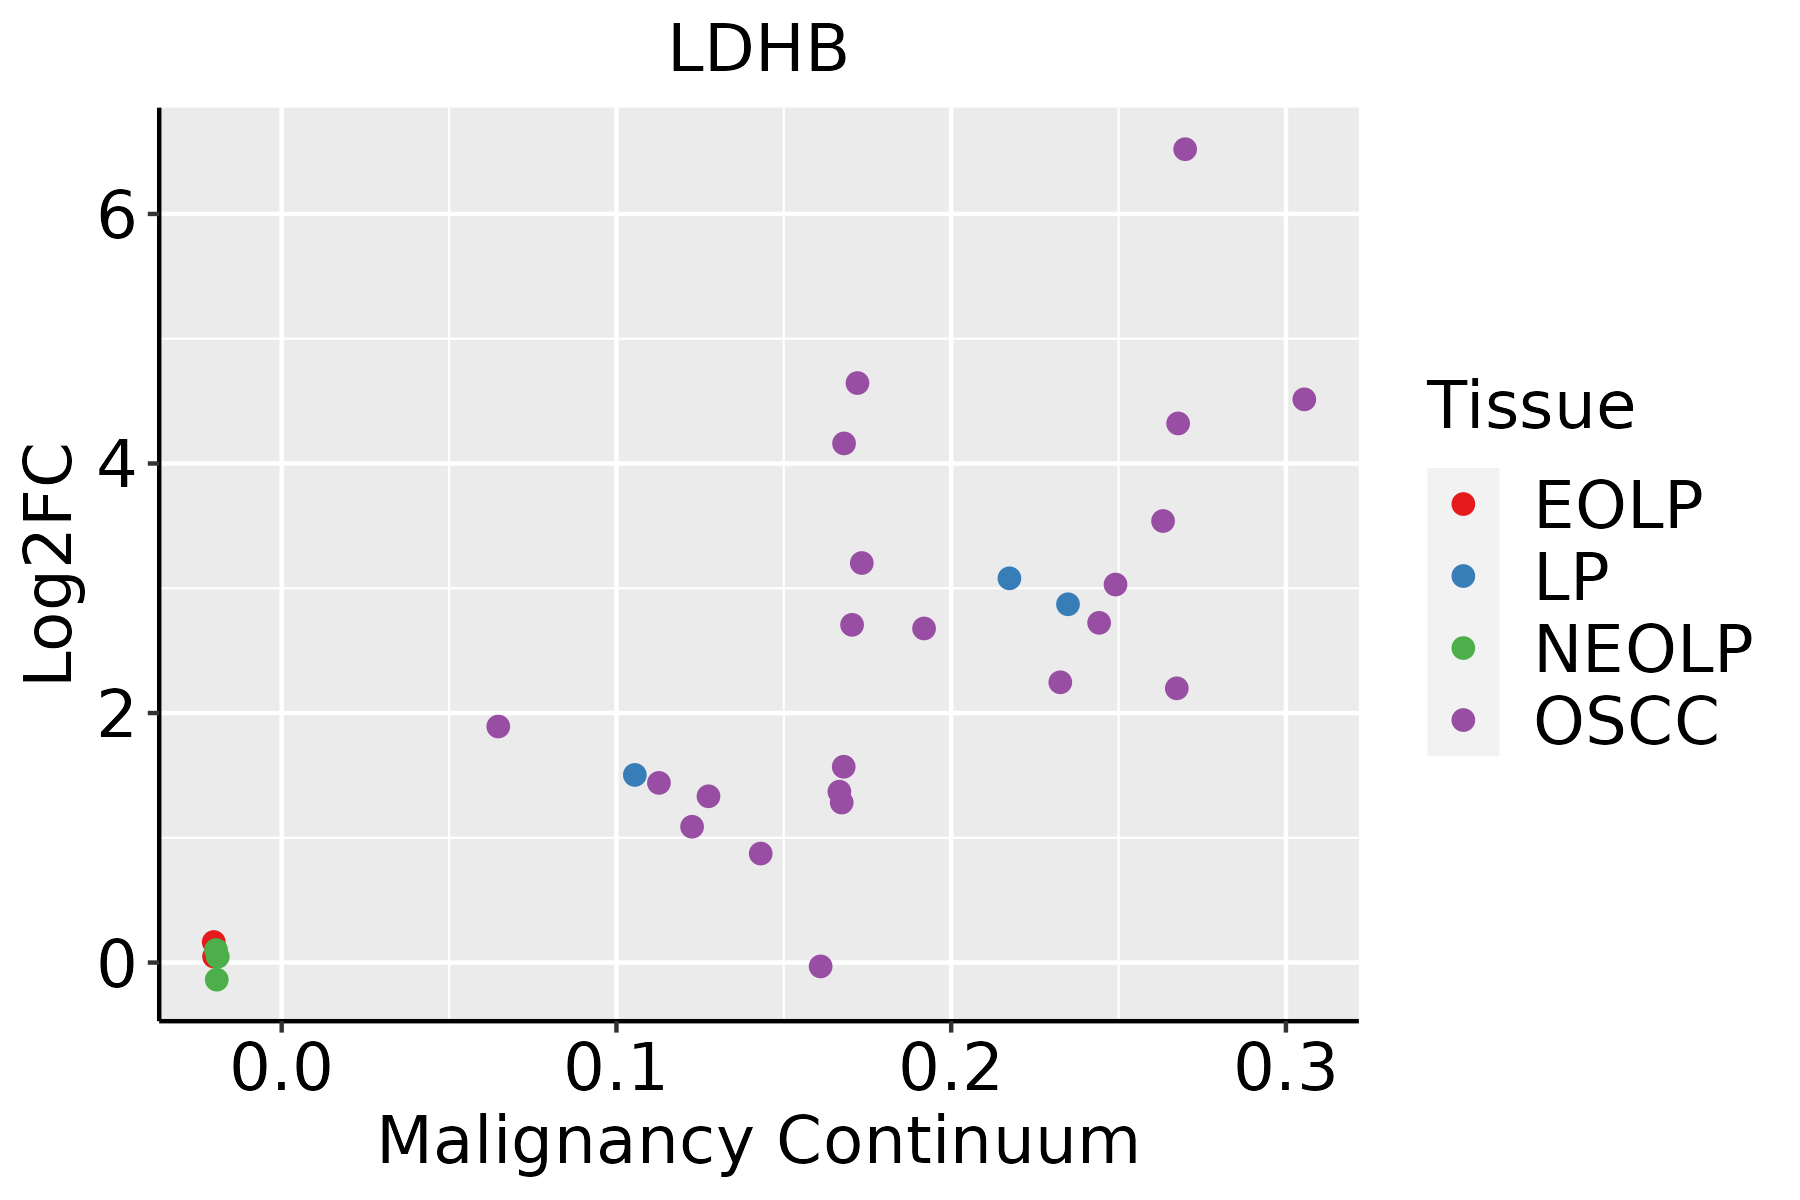 | EOLP: Erosive Oral lichen planus |
| LP: leukoplakia | ||
| NEOLP: Non-erosive oral lichen planus | ||
| OSCC: Oral squamous cell carcinoma | ||
| Prostate |  | BPH: Benign Prostatic Hyperplasia |
| Skin | 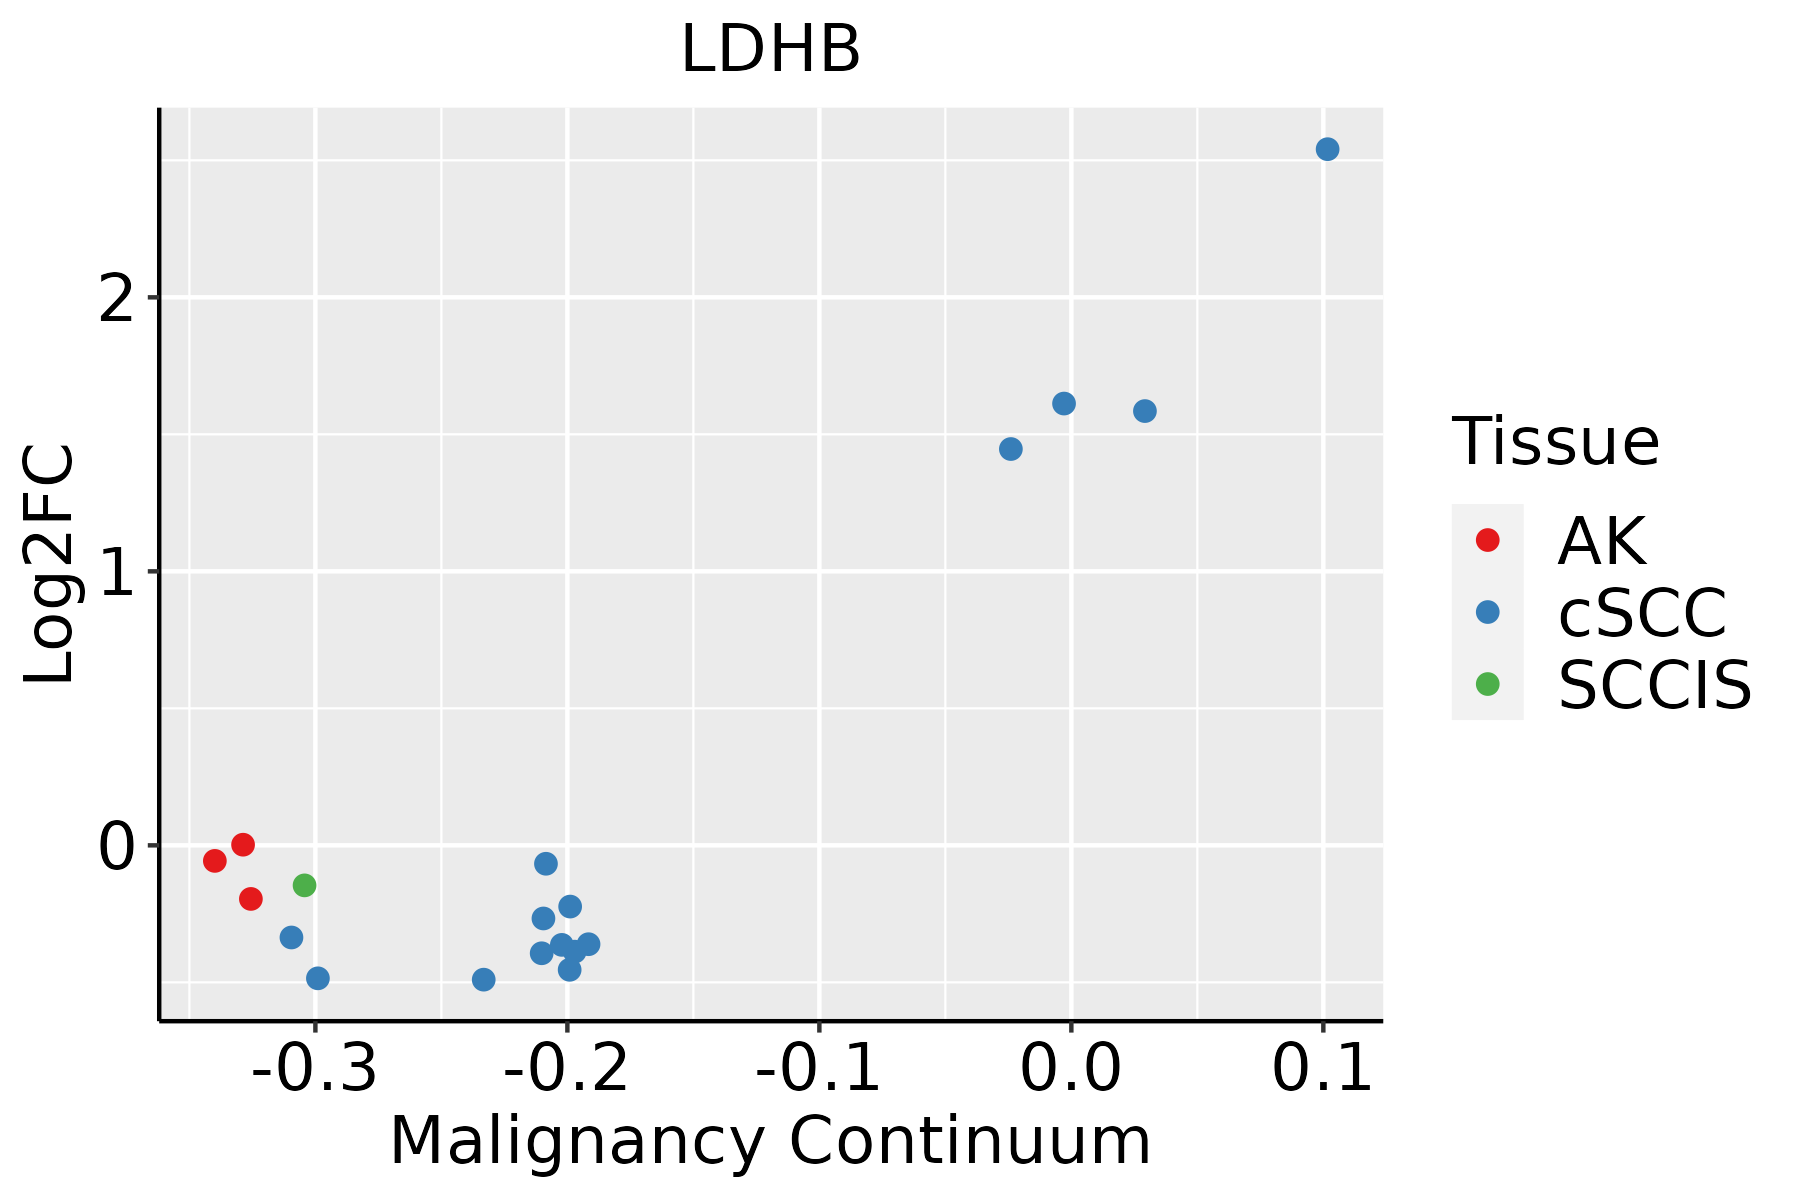 | AK: Actinic keratosis |
| cSCC: Cutaneous squamous cell carcinoma | ||
| SCCIS:squamous cell carcinoma in situ | ||
| Thyroid |  | ATC: Anaplastic thyroid cancer |
| HT: Hashimoto's thyroiditis | ||
| PTC: Papillary thyroid cancer |
| ∗log2FC in expression of this searched gene in stem-like cells from each diseased tissue sample relative to stem-like cells in normal samples in each tissue plotted against the malignancy continuum. Samples are colored based on if they are from different disease stage. |
Top |
Malignant transformation related pathway analysis |
| Find out the enriched GO biological processes and KEGG pathways involved in transition from healthy to precancer to cancer |
| Tissue | Disease Stage | Enriched GO biological Processes |
| Colorectum | AD |  |
| Colorectum | SER |  |
| Colorectum | MSS |  |
| Colorectum | MSI-H |  |
| Colorectum | FAP |  |
| ∗Top 15 enriched GO BP terms are showed in the bar plot of each disease state in each tissue. Each row represents a significant GO biological process which is colored according to the -log10(p.adjust). |
| Page: 1 2 3 4 5 6 7 8 9 |
| GO ID | Tissue | Disease Stage | Description | Gene Ratio | Bg Ratio | pvalue | p.adjust | Count |
| Page: 1 |
| Pathway ID | Tissue | Disease Stage | Description | Gene Ratio | Bg Ratio | pvalue | p.adjust | qvalue | Count |
| hsa0406616 | Breast | Precancer | HIF-1 signaling pathway | 23/684 | 109/8465 | 1.51e-05 | 1.59e-04 | 1.22e-04 | 23 |
| hsa052309 | Breast | Precancer | Central carbon metabolism in cancer | 13/684 | 70/8465 | 3.57e-03 | 2.17e-02 | 1.66e-02 | 13 |
| hsa0406617 | Breast | Precancer | HIF-1 signaling pathway | 23/684 | 109/8465 | 1.51e-05 | 1.59e-04 | 1.22e-04 | 23 |
| hsa0523012 | Breast | Precancer | Central carbon metabolism in cancer | 13/684 | 70/8465 | 3.57e-03 | 2.17e-02 | 1.66e-02 | 13 |
| hsa0406623 | Breast | IDC | HIF-1 signaling pathway | 22/867 | 109/8465 | 1.36e-03 | 1.00e-02 | 7.50e-03 | 22 |
| hsa0406633 | Breast | IDC | HIF-1 signaling pathway | 22/867 | 109/8465 | 1.36e-03 | 1.00e-02 | 7.50e-03 | 22 |
| hsa0406642 | Breast | DCIS | HIF-1 signaling pathway | 22/846 | 109/8465 | 9.83e-04 | 7.05e-03 | 5.20e-03 | 22 |
| hsa0406652 | Breast | DCIS | HIF-1 signaling pathway | 22/846 | 109/8465 | 9.83e-04 | 7.05e-03 | 5.20e-03 | 22 |
| hsa0406618 | Cervix | CC | HIF-1 signaling pathway | 27/1267 | 109/8465 | 4.72e-03 | 1.64e-02 | 9.72e-03 | 27 |
| hsa0523010 | Cervix | CC | Central carbon metabolism in cancer | 18/1267 | 70/8465 | 1.29e-02 | 3.87e-02 | 2.29e-02 | 18 |
| hsa0406619 | Cervix | CC | HIF-1 signaling pathway | 27/1267 | 109/8465 | 4.72e-03 | 1.64e-02 | 9.72e-03 | 27 |
| hsa0523013 | Cervix | CC | Central carbon metabolism in cancer | 18/1267 | 70/8465 | 1.29e-02 | 3.87e-02 | 2.29e-02 | 18 |
| hsa00620 | Colorectum | AD | Pyruvate metabolism | 28/2092 | 47/8465 | 3.71e-07 | 5.41e-06 | 3.45e-06 | 28 |
| hsa00010 | Colorectum | AD | Glycolysis / Gluconeogenesis | 34/2092 | 67/8465 | 3.63e-06 | 4.34e-05 | 2.77e-05 | 34 |
| hsa04066 | Colorectum | AD | HIF-1 signaling pathway | 48/2092 | 109/8465 | 7.25e-06 | 7.84e-05 | 5.00e-05 | 48 |
| hsa05230 | Colorectum | AD | Central carbon metabolism in cancer | 33/2092 | 70/8465 | 3.61e-05 | 3.19e-04 | 2.03e-04 | 33 |
| hsa00640 | Colorectum | AD | Propanoate metabolism | 18/2092 | 32/8465 | 1.33e-04 | 1.11e-03 | 7.08e-04 | 18 |
| hsa04922 | Colorectum | AD | Glucagon signaling pathway | 41/2092 | 107/8465 | 1.18e-03 | 7.75e-03 | 4.94e-03 | 41 |
| hsa006201 | Colorectum | AD | Pyruvate metabolism | 28/2092 | 47/8465 | 3.71e-07 | 5.41e-06 | 3.45e-06 | 28 |
| hsa000101 | Colorectum | AD | Glycolysis / Gluconeogenesis | 34/2092 | 67/8465 | 3.63e-06 | 4.34e-05 | 2.77e-05 | 34 |
| Page: 1 2 3 4 5 6 7 |
Top |
Cell-cell communication analysis |
| Identification of potential cell-cell interactions between two cell types and their ligand-receptor pairs for different disease states |
| Ligand | Receptor | LRpair | Pathway | Tissue | Disease Stage |
| Page: 1 |
Top |
Single-cell gene regulatory network inference analysis |
| Find out the significant the regulons (TFs) and the target genes of each regulon across cell types for different disease states |
| TF | Cell Type | Tissue | Disease Stage | Target Gene | RSS | Regulon Activity |
| ∗The dot plots of a searched regulon are shown for all cell subpopulations in each disease state of each tissue based on the regulon specific score inferred using pySCENIC and by calculating the average expression. |
| Page: 1 |
Top |
Somatic mutation of malignant transformation related genes |
| Annotation of somatic variants for genes involved in malignant transformation |
| Hugo Symbol | Variant Class | Variant Classification | dbSNP RS | HGVSc | HGVSp | HGVSp Short | SWISSPROT | BIOTYPE | SIFT | PolyPhen | Tumor Sample Barcode | Tissue | Histology | Sex | Age | Stage | Therapy Types | Drugs | Outcome |
| LDHB | SNV | Missense_Mutation | novel | c.750N>A | p.Asn250Lys | p.N250K | P07195 | protein_coding | deleterious(0.04) | probably_damaging(0.955) | TCGA-OL-A66P-01 | Breast | breast invasive carcinoma | Female | >=65 | I/II | Chemotherapy | cytoxan | CR |
| LDHB | SNV | Missense_Mutation | c.425N>G | p.Asp142Gly | p.D142G | P07195 | protein_coding | deleterious(0.04) | probably_damaging(0.995) | TCGA-2W-A8YY-01 | Cervix | cervical & endocervical cancer | Female | <65 | I/II | Chemotherapy | cisplatin | CR | |
| LDHB | SNV | Missense_Mutation | novel | c.182N>A | p.Gly61Glu | p.G61E | P07195 | protein_coding | deleterious(0.01) | probably_damaging(0.969) | TCGA-AA-3984-01 | Colorectum | colon adenocarcinoma | Female | <65 | I/II | Unknown | Unknown | SD |
| LDHB | SNV | Missense_Mutation | novel | c.610N>T | p.Gly204Cys | p.G204C | P07195 | protein_coding | deleterious(0.01) | probably_damaging(0.999) | TCGA-AD-A5EJ-01 | Colorectum | colon adenocarcinoma | Female | >=65 | I/II | Unknown | Unknown | SD |
| LDHB | SNV | Missense_Mutation | rs200163319 | c.473G>A | p.Arg158His | p.R158H | P07195 | protein_coding | tolerated(0.12) | benign(0.318) | TCGA-G4-6628-01 | Colorectum | colon adenocarcinoma | Male | >=65 | I/II | Unknown | Unknown | SD |
| LDHB | SNV | Missense_Mutation | novel | c.503N>A | p.Ser168Tyr | p.S168Y | P07195 | protein_coding | deleterious(0) | probably_damaging(0.988) | TCGA-AG-A002-01 | Colorectum | rectum adenocarcinoma | Male | <65 | I/II | Unknown | Unknown | SD |
| LDHB | SNV | Missense_Mutation | c.832G>T | p.Val278Leu | p.V278L | P07195 | protein_coding | tolerated(0.08) | benign(0.175) | TCGA-G5-6233-01 | Colorectum | rectum adenocarcinoma | Male | >=65 | III/IV | Chemotherapy | 5-fluorouracil | PD | |
| LDHB | insertion | Frame_Shift_Ins | novel | c.833dupT | p.Met281AspfsTer5 | p.M281Dfs*5 | P07195 | protein_coding | TCGA-G5-6233-01 | Colorectum | rectum adenocarcinoma | Male | >=65 | III/IV | Chemotherapy | 5-fluorouracil | PD | ||
| LDHB | SNV | Missense_Mutation | c.104N>T | p.Ala35Val | p.A35V | P07195 | protein_coding | deleterious(0.04) | possibly_damaging(0.461) | TCGA-AX-A1CE-01 | Endometrium | uterine corpus endometrioid carcinoma | Female | <65 | I/II | Unspecific | Paclitaxel | SD | |
| LDHB | SNV | Missense_Mutation | rs532712842 | c.472C>T | p.Arg158Cys | p.R158C | P07195 | protein_coding | tolerated(0.08) | possibly_damaging(0.51) | TCGA-AX-A2HD-01 | Endometrium | uterine corpus endometrioid carcinoma | Female | >=65 | III/IV | Unknown | Unknown | SD |
| Page: 1 2 3 4 |
Top |
Related drugs of malignant transformation related genes |
| Identification of chemicals and drugs interact with genes involved in malignant transfromation |
| (DGIdb 4.0) |
| Entrez ID | Symbol | Category | Interaction Types | Drug Claim Name | Drug Name | PMIDs |
| Page: 1 |

Copyright 2023-Present -The University of Texas Health Science Center at Houston |